2560
Prediction of the Prognostic Factors of Breast Cancer Using MRI with a Continuous-Time Random-Walk Diffusion Model
Huan Chang1, Dawei Wang2, Yuting Li3, Shaoxin Xiang4, Ke Xue4, Peng Kong5, and Qingshi Zeng2
1Department of Radiology, Shandong Provincial Qianfoshan Hospital, Shandong University, Jinan, China, 2Department of Radiology, The First Affiliated Hospital of Shandong First Medical University & Shandong Provincial Qianfoshan Hospital, Jinan, China, 3Department of Radiology, The First College of Clinical Medicine, Shandong University of Traditional Chinese Medicine, Jinan, China, 4MR Collaboration, Central Research Institute, United Imaging Healthcare, Shanghai, China, 5Department of Breast Surgery, The First Affiliated Hospital of Shandong First Medical University & Shandong Provincial Qianfoshan Hospital, Jinan, China
1Department of Radiology, Shandong Provincial Qianfoshan Hospital, Shandong University, Jinan, China, 2Department of Radiology, The First Affiliated Hospital of Shandong First Medical University & Shandong Provincial Qianfoshan Hospital, Jinan, China, 3Department of Radiology, The First College of Clinical Medicine, Shandong University of Traditional Chinese Medicine, Jinan, China, 4MR Collaboration, Central Research Institute, United Imaging Healthcare, Shanghai, China, 5Department of Breast Surgery, The First Affiliated Hospital of Shandong First Medical University & Shandong Provincial Qianfoshan Hospital, Jinan, China
Synopsis
Keywords: Breast, Diffusion/other diffusion imaging techniques
Breast cancer is a heterogeneous tumor, and its treatment is customized determined by the pathologic and tumor molecular features. This study used a continuous-time random-walk (CTRW) diffusion model to characterize prognostic factors status of breast lesions. The parameter β showed significantly differences in ER and PR status and showed significant correlation with ER and PR expression, and the combination of Dm, α, and β produced the best performance in identifying ER and PR status. Our study demonstrated that the CTRW parameters as potential biomarkers were superior to conventional ADC in predicting prognostic factors of breast cancer.Introduction
Breast cancer is a complex and heterogeneous tumor, and its treatment is extremely customized and frequently determined by the common pathologic characteristics and tumor molecular biomarkers1.Previous research had shown that diffusion-weighted imaging (DWI) can improve overall diagnostic accuracy, sensitivity and specificity of breast cancer detection 2. However, the diagnostic value of mono-exponential diffusion model was limited by assuming Gaussian diffusion of water molecules and lacking specific parameters to reflect the heterogeneous and complex tumor microenvironment3.
Several studies had proposed that the parameters α and β derived from the continuous-time random-walk (CTRW) diffusion model can reflect the degree of tissue heterogeneity in time and space domains4-6. Together with parameter Dm, the three parameters can assess different dimensions of complex microstructure and heterogeneity in tumor.
However, the research of the CTRW model in identifying molecular prognostic factors is still rare. Therefore, this study aims to investigate the potential value of CTRW model in determining prognostic factors status of breast lesions and evaluating their relationships.
Methods
MRI acquisition:Fifty-three breast malignant lesions with different prognostic factors status were enrolled in this study (Table 1). MRI examinations were performed with a 3.0T scanner (uMR 790, United Imaging Healthcare, Shanghai, China) to obtain 16 b-values (0, 10, 20, 30, 50, 70, 100, 150, 200, 400, 800, 1200, 1500, 2000, 2500, 3000 s/mm2) diffusion-weighted imaging (DWI).
Image analysis:
The CTRW model was calculated by the following equation4,7:
S / S 0 = Eα [-(bDm)β]
where Dm is an anomalous diffusion coefficient, α and β are parameters related to temporal and spatial diffusion heterogeneity, respectively, and Eα is a Mittag-Leffler function.
The apparent diffusion coefficient (ADC) derived from a conventional mono-exponential DWI model was calculated using the following equation:
S / S0 = eb*ADC
where S0 (b-values=0 s/mm2) and S (b-values=400, 800 s/mm2) are the signal intensity in the voxel with different b-values.
Regions of interest (ROIs) were drawn manually on one slice with the largest tumor area (cystic or nec rotic areas were excluded) on diffusion image with b=1200 s/mm2. These ROIs were then copied onto the Dm, α, β, and ADC maps.
Stained nuclei indicated positive estrogen receptor (ER) or progesterone receptor (PR) expression in >1% of cancer cells on 10% high-power fields. An immunohistochemical score of 3+ or 2+ with fluorescence in situ hybridization amplification with a ratio ≥2.0 were considered human epidermal growth factor receptor-2 (HER2) positive. High Ki-67 expression was defined tumor with a labeling index >20%.
Statistics:
The CTRW parameters (Dm, α, and β) and ADC were compared among the prognostic factors status by Mann–Whitney U-test. Binary logistic regression and receiver operating characteristic (ROC) curve analysis were used to evaluate the diagnostic performance of the individual ADC or CTRW parameters and their combinations in distinguishing the prognostic factors status. Spearman correlation was used to evaluate the associations between the parameters and various prognostic factors.
Result
The β was significantly higher in ER-negative than ER-positive group (P=0.007) (Table 2, Figure 1). The Dm, ADC were significantly lower and the β was higher in PR-negative than PR-positive group (P=0.011, 0.019, 0.010, respectively) (Figure 1). No significant differences were observed among the parameters in HER2 and Ki67 status (Table 2). For differentiating ER and PR status, the combination of Dm, α, and β produced the highest sensitivity (81.8%, 80.0%, respectively) and the area under the curve (AUC) (0.801 and 0.774, respectively) (Table 3).Furthermore, the β showed a significantly positive association with Ki67 expression (r=0.275, P=0.046) and a significantly negative correlation with ER and PR expression (r=-0.315, P=0.021 and r=-0.387, P=0.004, respectively), whereas Dm and ADC were negatively correlated with Ki-67 expression (r=-0.299, P=0.030 and r=-0.276, P=0.045) and Dm was positively correlated with PR expression (r=0.295, P=0.032) (Figure 2).
Discussion
This explorative study found that β was significantly lower in the ER-positive and PR-positive group. The β was related to spatial diffusion heterogeneity4-6, and a higher β indicated that the water molecules diffusion process with more unbalanced steps. Therefore, the lower β meant higher spatiotemporal diffusion heterogeneity in the ER-positive and PR-positive lesions. In addition, the Dm, ADC were higher in the PR-positive group, which is speculated to be related to perfusion contribution and vascularity6,8.Furthermore, the combination of Dm, α, and β produced the best performance in identifying ER and PR status. The CTRW parameters represented tissue cellularity and heterogeneity in space and time domains, which indicated that combining CTRW parameters could provide complementary tissue properties in describing complex lesions.
The Ki67 expression was significantly correlated with Dm, ADC, and β. This could be interpreted as the dense cellularity and nuclear enlargement appear in high Ki67 proliferation subgroups, and this active proliferative status leads to restricted diffusion of water molecules.
The parameter β showed the significant correlation with the ER, PR, and Ki67 expression. This may indicate the potential to provide prognostic factors through the parameter β. Therefore, the CTRW model, appeared to provide a more nuanced representation of the microenvironment, with connection to hormonal expression levels9.
In conclusion, our findings highlight the CTRW parameters as potential biomarkers are superior to ADC in differentiating and predicting prognostic factors of breast cancer.
Acknowledgements
NOReferences
1. Amornsiripanitch N, Nguyen VT, Rahbar H, Hippe DS, Gadi VK, Rendi MH, Partridge SC. Diffusion-weighted MRI characteristics associated with prognostic pathological factors and recurrence risk in invasive ER+/HER2- breast cancers. J Magn Reson Imaging. 2018 Jul;48(1):226-236.2. Maltez de Almeida JR, Gomes AB, Barros TP, Fahel PE, de Seixas Rocha M. Subcategorization of Suspicious Breast Lesions (BI-RADS Category 4) According to MRI Criteria: Role of Dynamic Contrast-Enhanced and Diffusion-Weighted Imaging. AJR Am J Roentgenol. 2015 Jul;205(1):222-31.
3. Iima, M. et al. Quantitative Non-Gaussian Diffusion and Intravoxel Incoherent Motion Magnetic Resonance Imaging. Investigative Radiology, 2015 50(4), 205–211.
4. Karaman MM, Sui Y, Wang H, Magin RL, Li Y, Zhou XJ. Differentiating low- and high-grade pediatric brain tumors using a continuous-time random-walk diffusion model at high b-values. Magn Reson Med. 2016 Oct;76(4):1149-57.
5. Karaman MM, Zhang J, Xie KL, Zhu W, Zhou XJ. Quartile histogram assessment of glioma malignancy using high b-value diffusion MRI with a continuous-time random-walk model. NMR Biomed. 2021 Apr;34(4):e4485.
6. Zhang J, Weaver TE, Zhong Z, Nisi RA, Martin KR, Steffen AD, Karaman MM, Zhou XJ. White matter structural differences in OSA patients experiencing residual daytime sleepiness with high CPAP use: a non-Gaussian diffusion MRI study. Sleep Med. 2019 Jan;53:51-59.
7. Ingo, C., et al. On random walks and entropy in diffusion-weighted magnetic resonance imaging studies of neural tissue. Magnetic Resonance in Medicine, 2014 71(2) :617–627.
8. Kim SH, Cha ES, Kim HS, Kang BJ, Choi JJ, Jung JH, Park YG, Suh YJ. Diffusion-weighted imaging of breast cancer: correlation of the apparent diffusion coefficient value with prognostic factors. J Magn Reson Imaging. 2009 Sep;30(3):615-20.
9. Cho, G. Y., Moy, L., Kim, S. G., Baete, S. H., Moccaldi, M., Babb, J. S., Sigmund, E. E. Evaluation of breast cancer using intravoxel incoherent motion (IVIM) histogram analysis: comparison with malignant status, histological subtype, and molecular prognostic factors. European Radiology, 2016 26(8), 2547–2558.
Figures
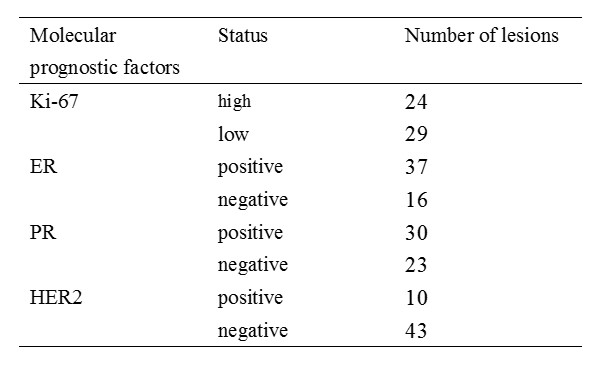
Table 1. Molecular prognostic factors of malignant lesions enrolled in this study.
Abbreviations: ER=estrogen receptor; PR=progesterone receptor; HER2= human epidermal growth factor receptor 2.
Abbreviations: ER=estrogen receptor; PR=progesterone receptor; HER2= human epidermal growth factor receptor 2.
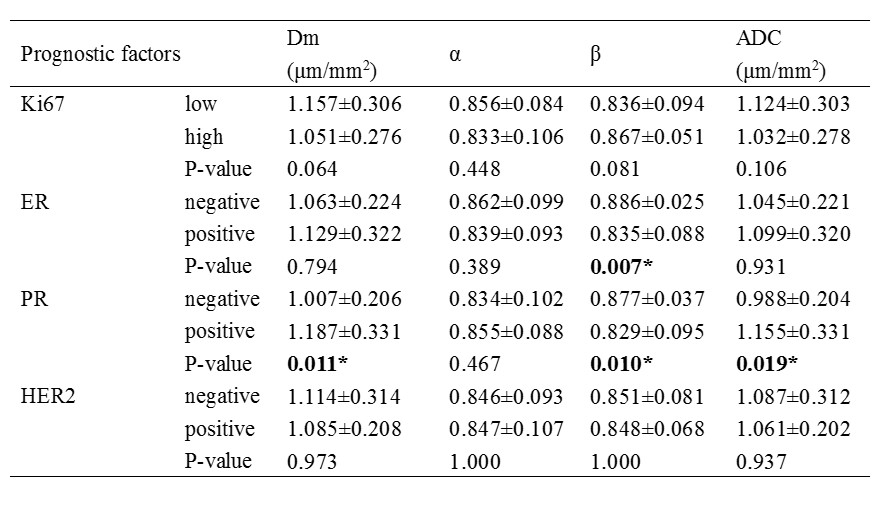
Table 2. Comparison of Dm, α, β, and ADC among molecular prognostic factors.
Abbreviations: ER=estrogen receptor; PR=progesterone receptor; HER2= human epidermal growth factor receptor 2. *P-value less than 0.05.
Abbreviations: ER=estrogen receptor; PR=progesterone receptor; HER2= human epidermal growth factor receptor 2. *P-value less than 0.05.
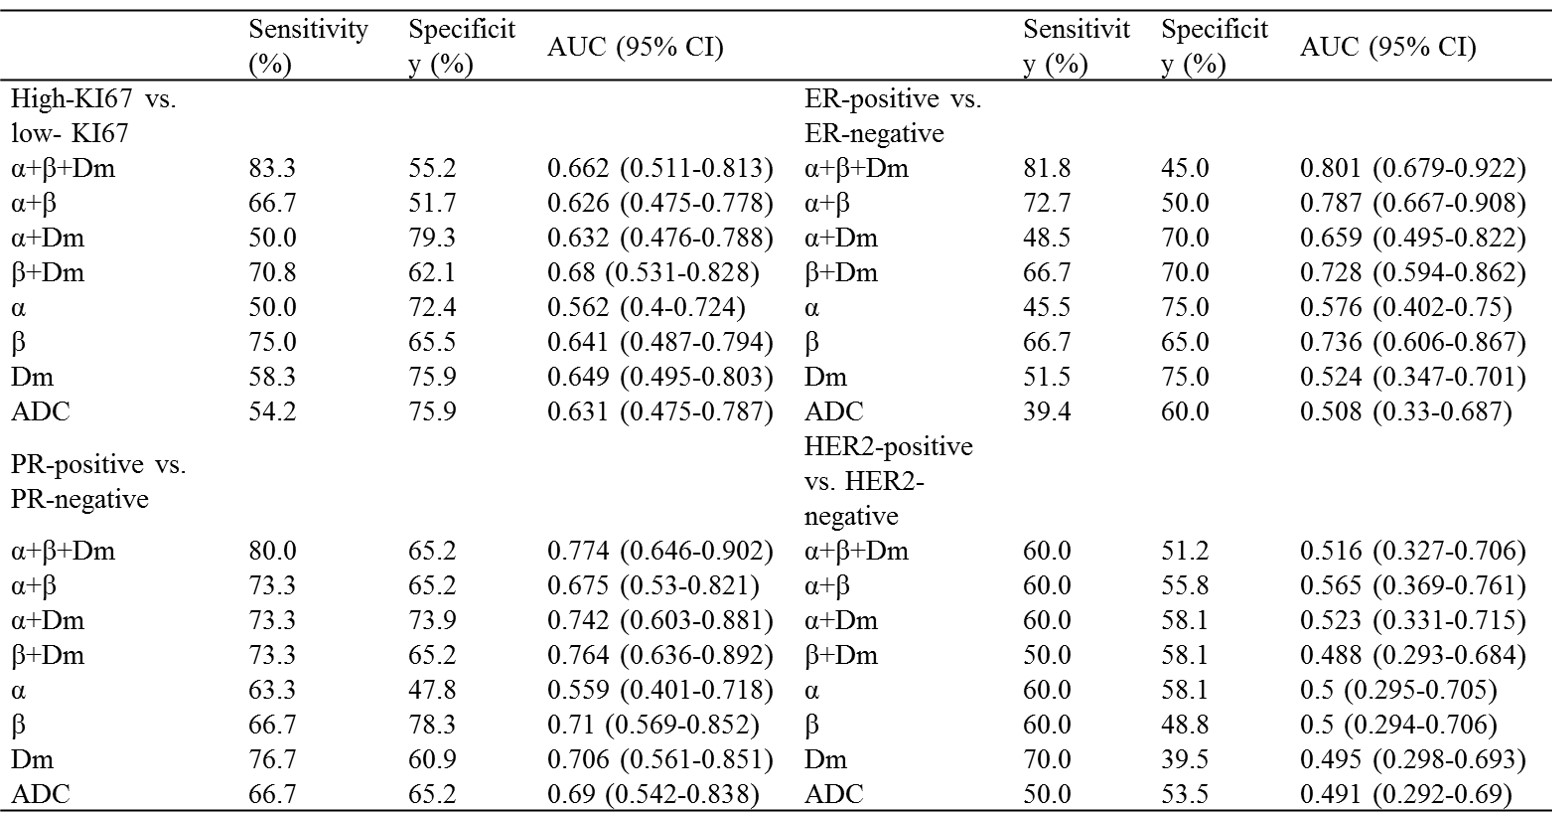
Table 3. ROC analysis of the diagnostic performance for Dm, α, β, and ADC in discriminating different molecular prognostic factors status.
Abbreviations: ER=estrogen receptor; PR=progesterone receptor; HER2= human epidermal growth factor receptor 2, CI = Confidence Interval.
Abbreviations: ER=estrogen receptor; PR=progesterone receptor; HER2= human epidermal growth factor receptor 2, CI = Confidence Interval.
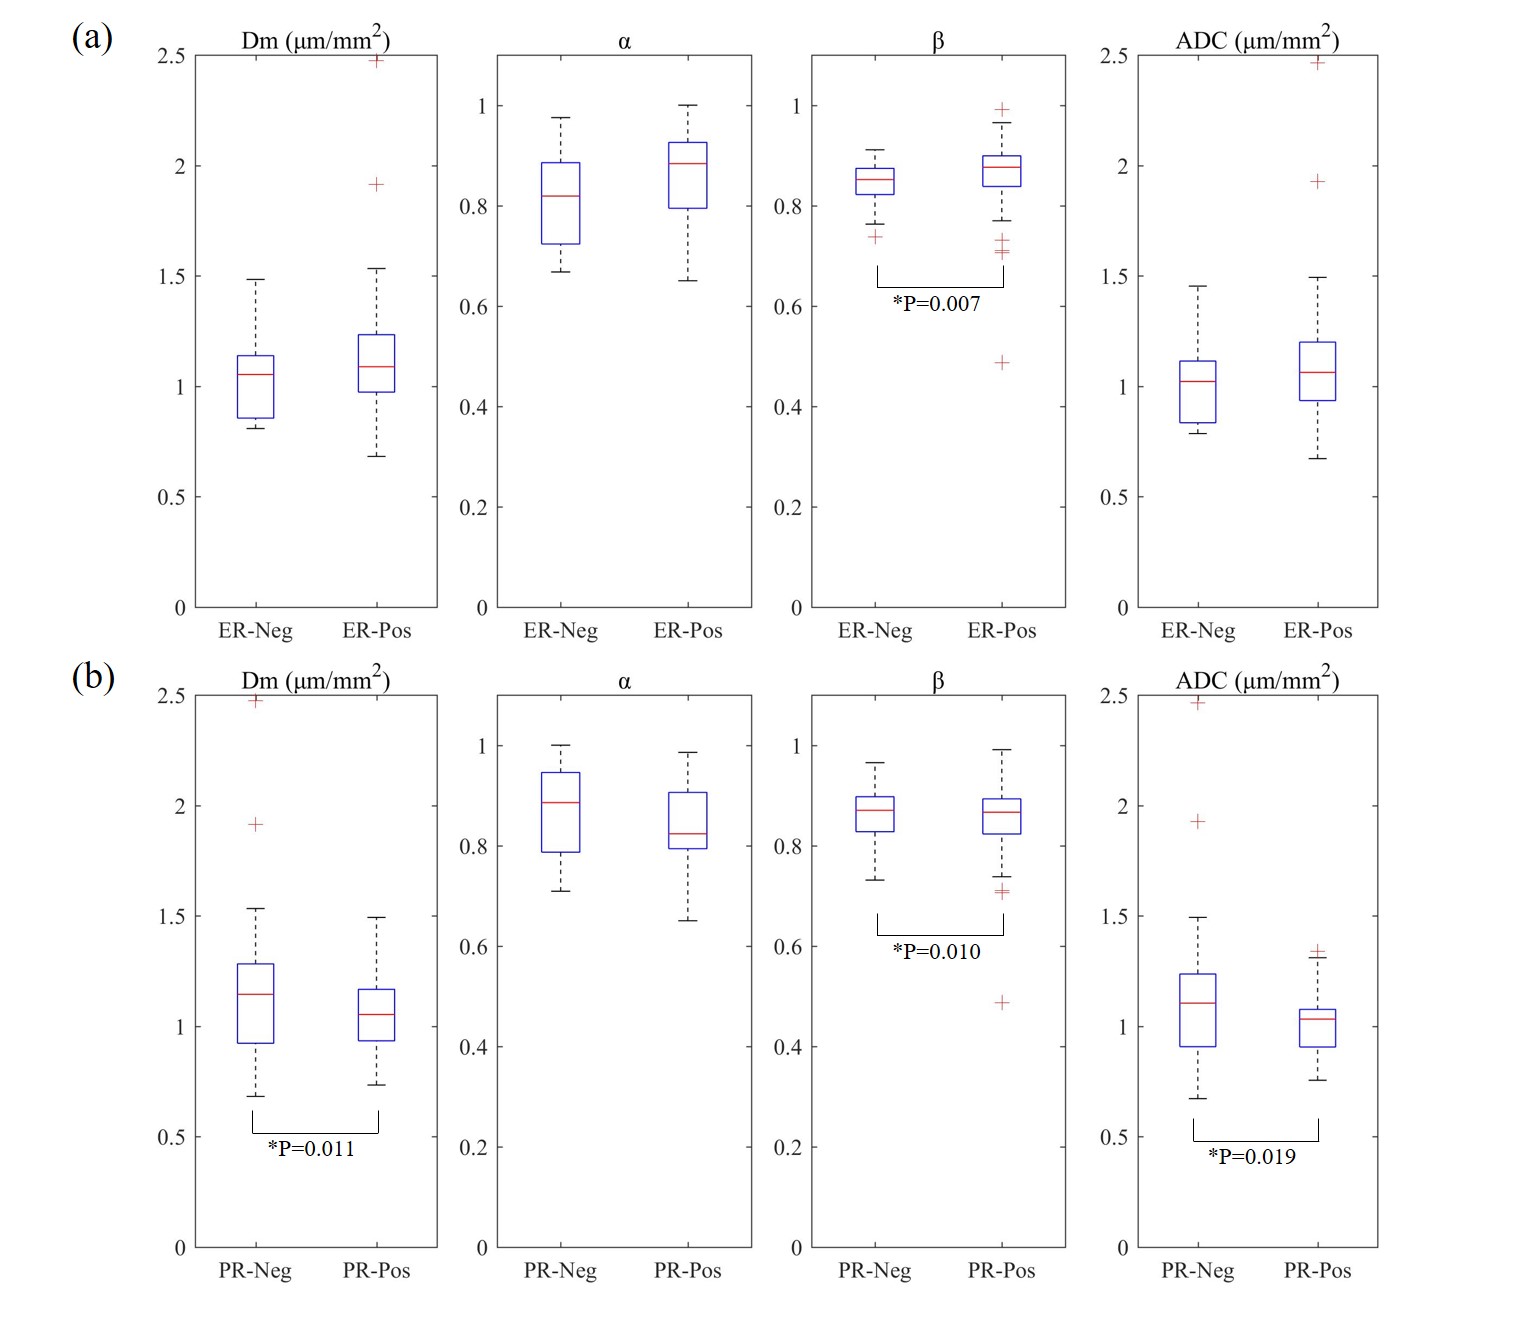
Figure 1. Box and whisker plots of mean values of the CTRW parameters, Dm, α, β and ADC for (a) ER-positive and ER-negative groups and (b) PR-positive and PR-negative groups. Significant findings (p<0.05) are marked with * and their corresponding p value. Abbreviations: ER=estrogen receptor; PR=progesterone receptor; HER2=human epidermal growth factor receptor 2, Neg= negative, Pos=positive.
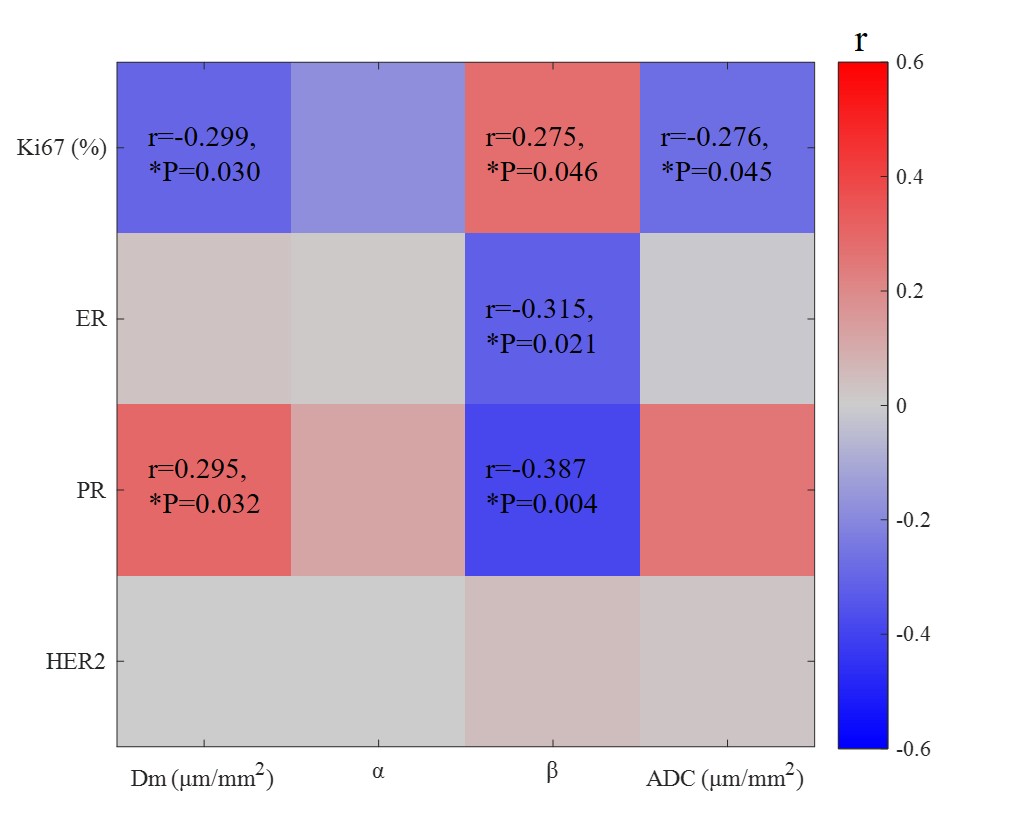
Figure 2. Matrix plot of the significant correlation coefficients between CTRW parameters and prognostic factors. Colored entries indicate Pearson correlation coefficients with positive (red) or negative (blue). Abbreviations: ER=estrogen receptor; PR=progesterone receptor; HER2= human epidermal growth factor receptor 2.
DOI: https://doi.org/10.58530/2023/2560