2556
Value of ADC Histogram Analysis in the Differentiation of Benign and Malignant Breast Lesions Based on Multiplexed Sensitivity Encoding1Ningxia Medical University, yin chuan, China, 2General Hospital of Ningxia Medical University, yinchuan, China, 3GE Healthcare China, xian, China
Synopsis
Keywords: Breast, Cancer
The ADC histogram parameters based on the MUSE-DWI are important indicators for breast cancer diagnosis. ADC5% was more accurate for lesion discrimination than ADCMUSE.
Synopsis
In this study, we aim to investigate the differential diagnostic efficacy of ADC histogram parameters and ADC values based on multiplexed sensitivity encoding (MUSE) in benign and malignant breast lesions. It was concluded that the ADC histogram parameters were statistically significant different between benign and malignant lesions, among which ADC5% had the highest differential diagnostic value. The ADC5% outperformed ADCMUSE(ADC values obtained by conventional delineation methods)in discriminating malignant and benign lesions, which has potential clinical value for improving diagnostic accuracy of breast lesions.Summary of main findings
The ADC histogram parameters based on the MUSE-DWI are important indicators for breast cancer diagnosis. ADC5% was more accurate for lesion discrimination than ADCMUSE.Introduction
Breast cancer has become the most commonly diagnosed cancer1, and early detection and diagnosis of breast diseases are crucial for the prognosis of breast cancer. Diffusion-weighted imaging (DWI) is an effective parameter for distinguishing benign and malignant lesions23. However, DWI is mainly based on single-shot echo-planar imaging (SS-EPI), which is prone to geometric distortion4. MUSE-DWI integrates a sensitivity-encoding parallel imaging method and achieves a better signal-to-noise ratio (SNR) due to its improved matrix inversion conditioning5, thereby improving the reliability of ADC values diagnosis. However, the ADC values of the lesions by placing regions of interest (ROI) manually on representative sections of the tumors can lead to interobserver variability and misdiagnosis due to histological heterogeneity of the tumor6.ADC histogram analysis is an emerging image analysis technology that can analyze the entire tumor tissue component7, which has been widely applied for many systems and has shown good diagnosticperformance6,8-10.
The purpose of the study was to explore the diagnostic performance of the whole lesion ADC histogram parameters and ADC values based on the MUSE-DWI sequence in benign and malignant breast lesions.
Material and Methods
The clinical data and preoperative MRI imaging data of 119 breast lesions confirmed by pathology were retrospectively analyzed, including 34 benign lesions and 85 malignant lesions. All patients underwent breast MRI routine sequence, dynamic contrast-enhanced MRI (DCE-MRI), and MUSE-DWI. The MUSE-DWI sequence was delineated by Firevoxel software to obtain the ADC histogram parameters(mean, StDev, CoeffOfVariation, skewness, kurtosis, entropy, ADC1%, ADC5%, ADC10%, ADC25%, ADC50%, ADC75%, ADC90%, ADC95%, ADC99%). Next, the ADCMUSE(ADC values obtained by conventional delineation methods)were measured by GE ADW4.7 workstation. The independent Student’s t-test and Mann-Whitney U test were used to compare the differences between the two groups. The receiver operating characteristic (ROC) curve was used to evaluate the diagnostic performance.Results
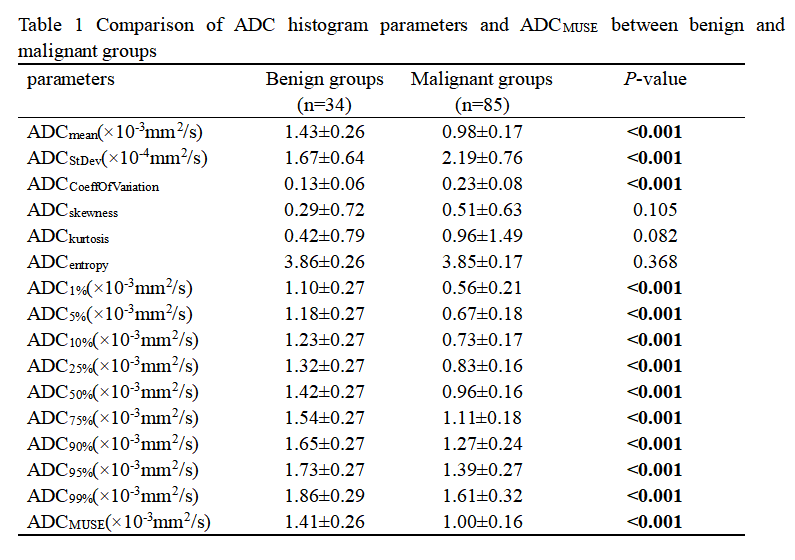
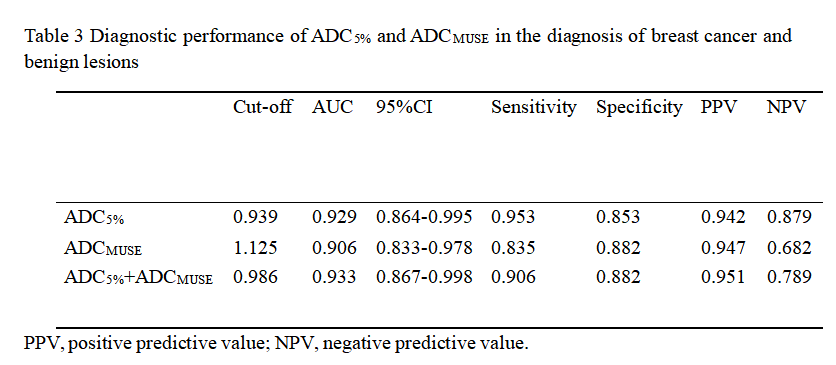
Except for ADCskewness, ADCkurtosis, and ADCentropy of ADC histogram parameters, the other parameters were significantly different between the two groups(all P<0.05, Table 1). The ADCmean, ADC1%, ADC5%, ADC10%, ADC25%, ADC50%, ADC75%, ADC90%, ADC95%, and ADC99% of malignant group were significantly lower than those of benign group, ADCStDev and ADCCoeffOfVariation were significantly higher than those of benign group. ADC5% had the highest differential diagnosis value, the area under the curve (AUC) was 0.929(Table 2), the cut-off value was 0.94×10⁻³mm2/s, and the sensitivity and specificity were 0.953 and 0.853(Table 3). The ADCMUSE was statistically significant in the two groups (P<0.05), AUC was 0.906, with a cut-off value of 1.13×10⁻³mm2/s, and the sensitivity and specificity were 0.835 and 0.882(Table 3). The AUC of ADC5% combined with ADCMUSE value was 0.933(Table 3, Figure 3), and the sensitivity and specificity were 0.906 and 0.882, respectively.Discussion and Conclusion
This study demonstrated that the ADCMUSE of malignant lesions was significantly lower than that of benign lesions, and the difference was statistically significant, which is consistent with Daimiel et al5. Compared with the research of Daimiel et al., the number of cases in this study had increased and the diagnostic value of the ADC histogram parameters had been further explored. Our study showed that the ADC histogram parameters were meaningful in differentiating benign and malignant breast lesions, among which ADC5% had the highest differential diagnostic value. ADC5% combined with ADCMUSE could further improve the diagnostic performance. Suo et al.11 believed that the minimum ADC may best represent the most aggressive component of tumor, however, the minimum ADC value may be more susceptible to outliers from noise, artifact, and adjacent structure. Therefore, the low percentile value of ADC is more suitable to reflect the restricted diffusion of water molecules in tumor cells. In this study, the lowest percentile value (ADC5%) was found to be the best diagnostic efficacy. To conclude, ADCMUSE and ADC histogram parameters were significantly different between benign and malignant breast lesions, which is worth further study.Acknowledgements
The author thanks Professor Chen Bing for his guidance and advice during the writing process of the article.References
1. Sung H, Ferlay J, Siegel RL, et al. Global Cancer Statistics 2020: GLOBOCAN Estimates of Incidence and Mortality Worldwide for 36 Cancers in 185 Countries. CA Cancer J Clin 2021;71:209-249.
2. Partridge SC, Nissan N, Rahbar H, Kitsch AE, Sigmund EE. Diffusion-weighted breast MRI: Clinical applications and emerging techniques. J Magn Reson Imaging 2017;45:337-355.
3. Zhu G, Luo J, Ouyang Z, et al. The Assessment of Prostate Cancer Aggressiveness Using a Combination of Quantitative Diffusion-Weighted Imaging and Dynamic Contrast-Enhanced Magnetic Resonance Imaging. Cancer Manag Res 2021;13:5287-5295.
4. Johansson J, Lagerstrand K, Ivarsson L, Svensson PA, Hebelka H, Maier SE. Brain diffusion MRI with multiplexed sensitivity encoding for reduced distortion in a pediatric patient population. Magn Reson Imaging 2022;87.
5. Daimiel NI, Lo GR, Morris EA, et al. High-Spatial-Resolution Multishot Multiplexed Sensitivity-encoding Diffusion-weighted Imaging for Improved Quality of Breast Images and Differentiation of Breast Lesions: A Feasibility Study. Radiol Imaging Cancer 2020;2:e190076.
6. Ozturk M, Polat AV, Selcuk MB. Whole-lesion ADC histogram analysis versus single-slice ADC measurement for the differentiation of benign and malignant soft tissue tumors. Eur J Radiol 2021;143:109934.
7. Kang Y, Choi SH, Kim YJ, et al. Gliomas: Histogram analysis of apparent diffusion coefficient maps with standard- or high-b-value diffusion-weighted MR imaging--correlation with tumor grade. Radiology 2011;261:882-890.
8. Hao Y, Pan C, Chen W, Li T, Zhu W, Qi J. Differentiation between malignant and benign thyroid nodules and stratification of papillary thyroid cancer with aggressive histological features: Whole-lesion diffusion-weighted imaging histogram analysis. J Magn Reson Imaging 2016;44:1546-1555.
9. Guo Y, Kong QC, Li LQ, et al. Whole Volume Apparent Diffusion Coefficient (ADC) Histogram as a Quantitative Imaging Biomarker to Differentiate Breast Lesions: Correlation with the Ki-67 Proliferation Index. Biomed Res Int 2021;2021.
10. Kang Y, Choi SH, Kim Y, et al. Gliomas: Histogram analysis of apparent diffusion coefficient maps with standard- or high-b-value diffusion-weighted MR imaging--correlation with tumor grade. Radiology 2011;261.
11. Suo S, Zhang K, Cao M, et al. Characterization of breast masses as benign or malignant at 3.0T MRI with whole-lesion histogram analysis of the apparent diffusion coefficient. Journal of magnetic resonance imaging : JMRI 2016;43.
Figures
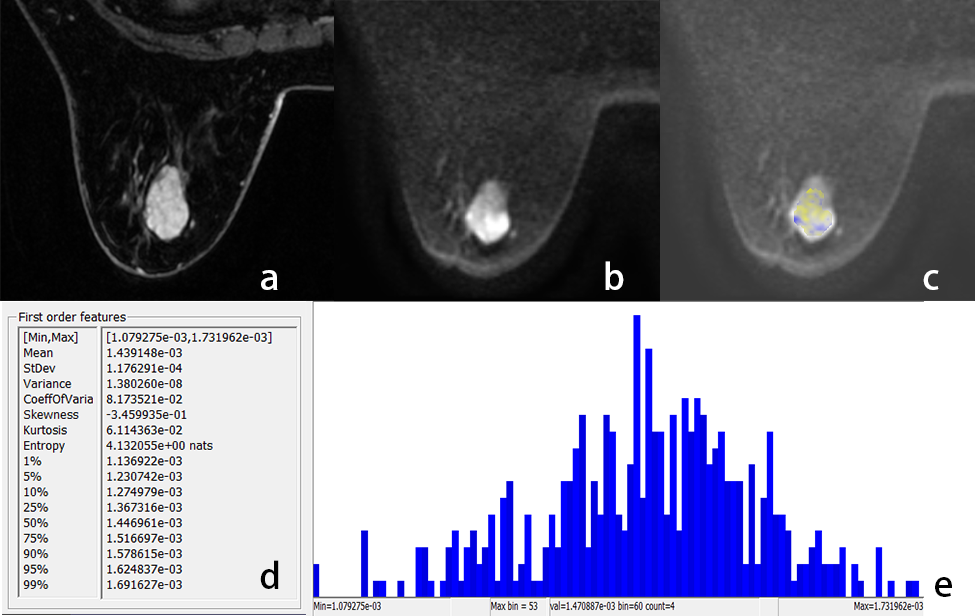
Figure 1 A 73-year-old female with fibroadenoma. The ROI was manually drawn around the whole tumor margin of the MUSE-DWI (b)with reference to DCE-MRI (a). The ADC parameters (d) and histogram (e) were automatically generated.
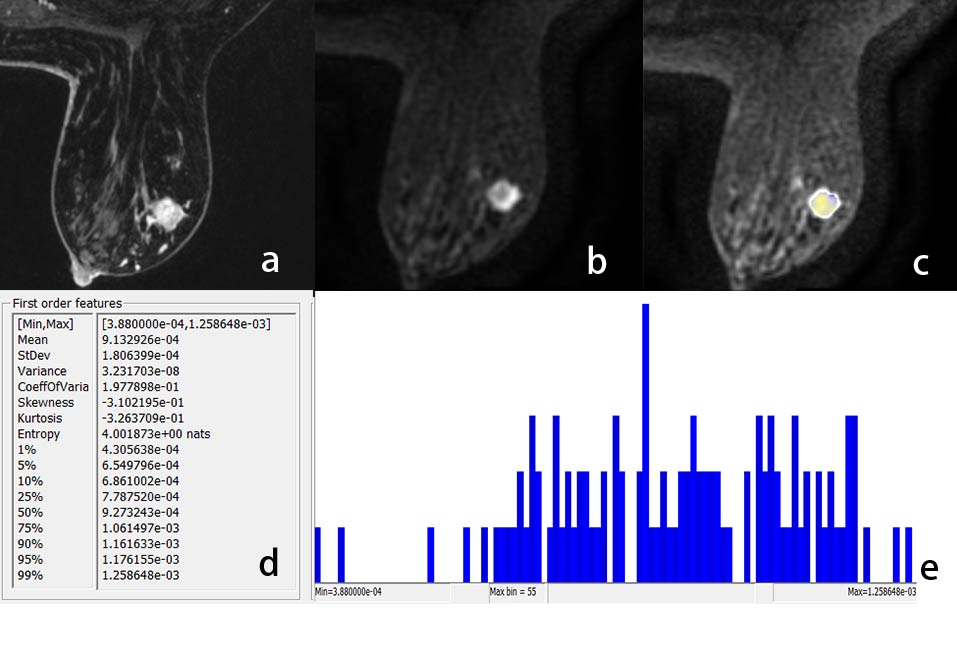
Figure 2 A 58-year-old female with non-specific invasive carcinoma. The ROI was manually drawn around the whole tumor margin of the MUSE-DWI (b)with reference to DCE-MRI (a). The ADC parameters (d) and histogram (e) were automatically generated.
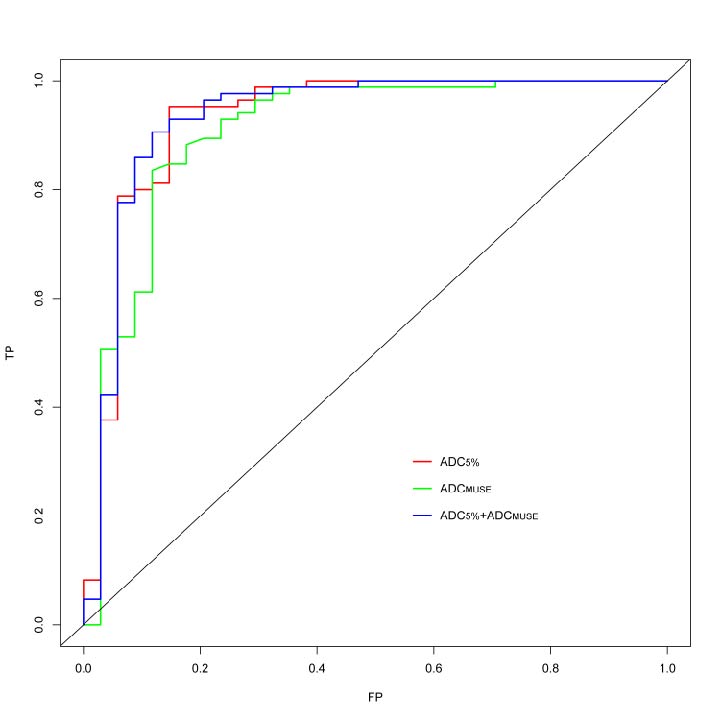
Figure 3 ROC curve analysis of the ADC5% and ADCMUSE for the differentiation of breast benign and malignant tumors