2551
Apparent Diffusion Coefficient in Breast MRI1Radiology, University of California, San Diego, San Diego, CA, United States, 2Circulation and Medical Imaging, Norwegian University of Science and Technology, Trondheim, Norway, 3Global MR Application and Workflow, GE Healthcare, Boston, MA, United States, 4Radiation medicine, University of California, San Diego, San Diego, CA, United States, 5Bioengineering, University of California, San Diego, San Diego, CA, United States, 6Neurosciences, University of California, San Diego, San Diego, CA, United States
Synopsis
Keywords: Breast, Diffusion/other diffusion imaging techniques
Diffusion weighted Imaging (DWI) acquisitions are often part of breast cancer MRI protocols. The signal intensity decrease as a function of the b-value in diffusion imaging is non-linear and complex with inconsistent Apparent Diffusion Coefficients. In this abstract, we investigate ADC mapping computation and accuracy. Mapping techniques gave similar performances, with comparable medians and standard deviations.Introduction
Apparent diffusion coefficient (ADC) acquisitions are often part of breast cancer MRI protocols1. ADC mapping in breast DWI-MRI is challenging. Breasts have high adipose tissue content and thus breast MRI requires efficient fat suppression pulses. Suppressing or decreasing the signal of large parts of the breasts lead to low SNR regions, impairing ADC estimations. In practice, scanners and medical software offer built-in mapping functions, but their ADC estimation process is often inaccessible to the user. Additionally, when manually generating ADC maps, there is discussion on the optimal approach. The signal decrease as a function of the b-value in diffusion imaging is not linear, complex and inconsistent ADCs can be computed. Patient care and follow-up could then be impaired. The purpose of the study is to investigate best practices for ADC map computation regarding both image conspicuity of suspicious findings and ADC accuracy. In this abstract, we propose a method for approaching non-physical and unreliable values and grading ADC accuracy.Methods
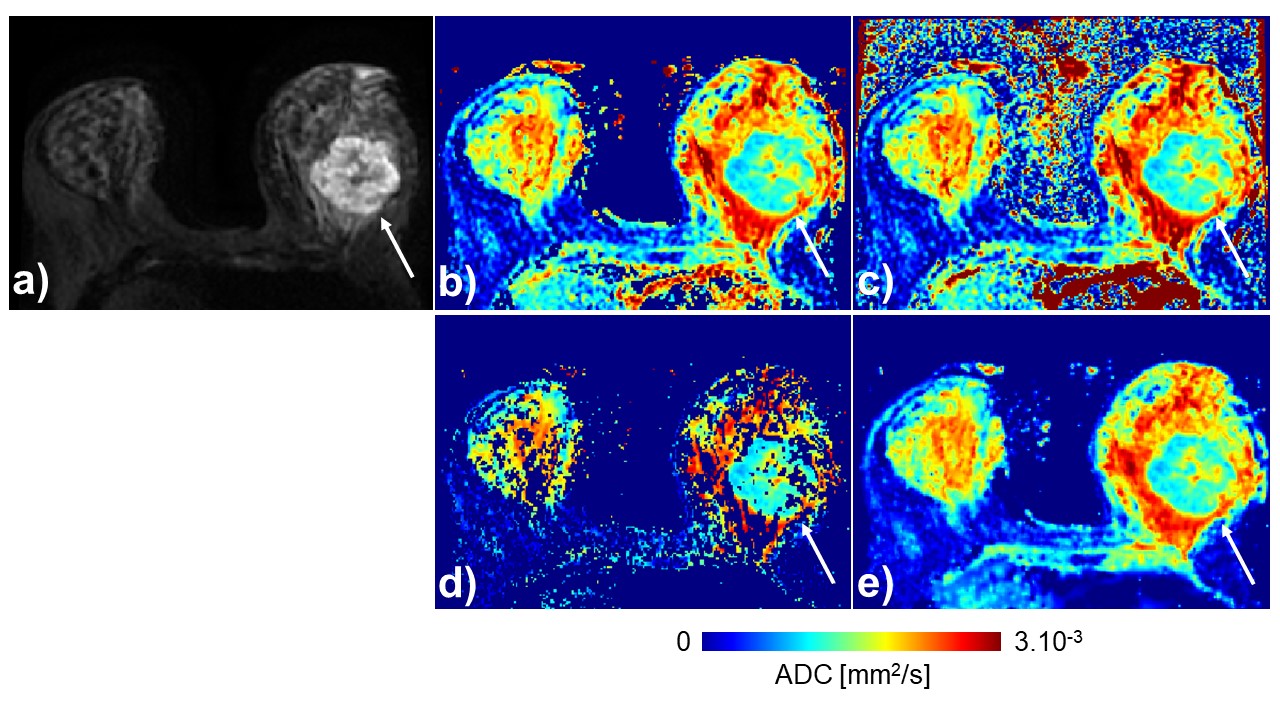
The dataset was composed of 13 patients with biopsy-proven breast cancer. Patients underwent routine clinical breast exam, including Dynamic Contrast Enhanced (DCE) and DWI MRI. Conventional DWI was performed using Array coil Spatial Sensitivity Encoding (ASSET) with the following parameters: TE/TR (ms): 58.5/4075; b-values (N directions): 0 (1), 100 (1), 600 (1), 800 (1) s/mm2; FOV: 340x340mm2; matrix: 128x128; in-plane resolution: 2.7x2.7mm2; slice thickness: 5mm; Nslices: 40; Z-dir coverage: 20cm; acq time: 3min 56s.ADC maps were computed with OsiriX2 as a gold standard reference. Images were threshold at 1% of the maximum signal intensity at b = 0 s/mm2 to remove background voxels. Comparatively, ADC maps were computed using Matlab (R2017a, Mathworks, USA) using mono-exponential nonlinear fitting. All four b-values were used in both cases. 95% confidence intervals (95% CI) were estimated for each ADC as well. Voxels reaching non-physical ADC values (< 0 or > 3.10-3 mm2/s) or unsatisfying 95% CI were replaced by missing data (NaNs). Finally, missing data in the breast were estimated using a sparse smoothing function3.
Cancer regions of interest (ROIs) were delineated under the supervision of a radiologist using ITK-SNAP4. ADCs median and standard deviation of computed ADC in each ROI were measured in OsiriX generated maps (O-maps) and smoothed maps (S-maps). Moreover, ADCs median and standard deviation were measured in maps with missing data (NaN-maps), only considering non-missing data.
Results
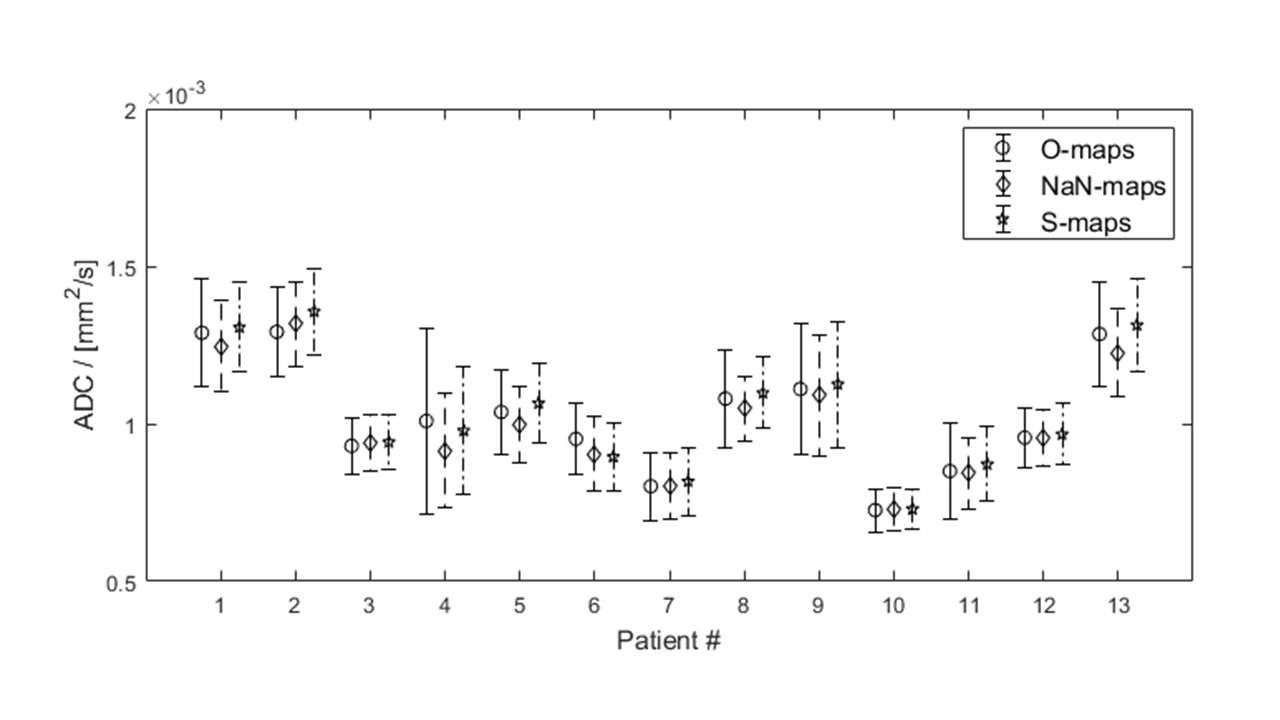
The methodology described allowed to create O-maps, NaN-maps and S-maps for each patient, an example is given in Figure 1. The difference between O-maps and NaN-maps was 2.7 ± 2.6% (min: 0.05%, max: 9.3%) and the difference between O-maps and S-maps was 2.4 ± 1.6% (min: 0.5%, max: 6.0%). The percentage of voxels located in the breast that were replaced with NaNs in comparison to the whole matrix volume was 24.3 ± 13.0%. ADC medians and standard deviations for each patient are represented in Figure 2. The average standard deviation was of 2.92.10-4, 2.47.10-4 and 2.54.10-4 mm2/s in cancer ROIs for O-maps, NaN-maps and S-maps, respectively.Discussion
In this abstract, we investigate ADC map computation and the accuracy of output values. Overall, all mapping techniques gave similar performances, with comparable medians and standard deviations. However, the large number of voxels replaced by NaNs because of non-linear fitting convergence issues (whether reaching non-physical values or wide 95% confidence interval) illustrate what is at stake in this study. Calculating ADC values in breast DWI is complex, and maps should be handled with care. ADC maps can help improve ADC conspicuity as illustrated in Figure 2, but the absolute measurement of ADC is still variable. This is likely one of the reasons that prevents the definition of clear ADC thresholds between benign and malignant lesions in breast imaging5. Methods of handling non-physical or unreliable values differ widely across imaging sites and manufacturers. The solution we propose to recover missing data uses a smoothing function and gives similar results as the ADC plug-in, in OsiriX.Next steps of the project include working with post-processed DWI data (distortion, noise and eddy current corrections). Some of the DWI data used here had distortion artifacts in the contralateral breast, compared to the biopsied cancer. More patients should be included as well. Moreover, the study was performed on cancers only, which have the highest signal at relatively high b-values (800 s/mm2). The method used in the abstract should be tested on benign lesions where signal is lower to estimate the number of unreliable voxels.
Acknowledgements
No acknowledgement found.References
1. Lo G, McLaughlin A, Jacques A, et al. Does Medicare-eligible high-risk breast cancer screening MRI target the right women? J Med Imaging Radiat Oncol. 2020;64(2):220-228. doi:10.1111/1754-9485.13009
2. Rosset A, Spadola L, Ratib O. OsiriX: An Open-Source Software for Navigating in Multidimensional DICOM Images. J Digit Imaging. 2004;17(3):205-216. doi:10.1007/s10278-004-1014-6
3. Garcia D. Robust smoothing of gridded data in one and higher dimensions with missing values. Comput Stat Data Anal. 2010;54(4):1167-1178. doi:10.1016/j.csda.2009.09.020
4. Yushkevich PA, Piven J, Hazlett HC, et al. User-guided 3D active contour segmentation of anatomical structures: significantly improved efficiency and reliability. NeuroImage. 2006;31(3):1116-1128. doi:10.1016/j.neuroimage.2006.01.015
5. Baltzer P, Mann RM, Iima M, et al. Diffusion-weighted imaging of the breast-a consensus and mission statement from the EUSOBI International Breast Diffusion-Weighted Imaging working group. Eur Radiol. 2020;30(3):1436-1450. doi:10.1007/s00330-019-06510-3
Figures