2548
Physiological contributions of ECG-derived respiration to BOLD fluctuations during resting-state and respiratory modulations1ISR-Lisboa and Department of Bioengineering, Instituto Superior Técnico – Universidade de Lisboa, Lisbon, Portugal
Synopsis
Keywords: fMRI, Multimodal, ECG, respiration
Physiological signal acquisition during fMRI may be used for multiple purposes, though it usually requires additional setup which may increase complexity and cause subject discomfort. Since ECG is modulated by respiration, an ECG-derived respiration (EDR) may be obtained without needing extra equipment for EEG-fMRI studies, which inherently use the ECG. In this work, EDR signals were computed for resting-state and two respiratory challenges modulating respiration patterns, to validate their use in the MR environment. Their performance for estimating physiological regressors of BOLD-fMRI signals was similar to the one obtained by using concurrently acquired respiratory signals.Introduction
Physiological signal acquisition during functional magnetic resonance imaging (fMRI) may serve multiple purposes: physiological noise correction of non-neuronal blood oxygen level-dependent (BOLD) sources, study of physiological modulations of brain activity or simply monitoring throughout experiments1. However, it usually requires additional setup, such as respiratory belts and photoplethysmography, which may increase preparation time and subject discomfort2. EEG-fMRI studies inherently require the use of the electrocardiogram (ECG) for artifact correction. Since ECG is modulated by respiration, an ECG-derived respiration (EDR) may also be obtained without needing extra equipment2. EDR estimation has been explored for EEG-fMRI, yet it has not been validated or evaluated in situations in which the subject holds their breath or significantly changes their breathing rate3. Hence, we evaluate the performance of EDR signals for explaining BOLD-fMRI during resting-state and two respiratory challenges modulating respiration patterns, by comparing them with measured respiratory signals.Methods
EEG-fMRI data was acquired from female healthy subjects during: 4.82min of resting state (RS) (N = 10), a slow paced breathing (SPB) task with a 2-min 0.1Hz respiration preceded and followed by 1-min free breathing periods (N = 9) and a breath-hold (BH) task with 4.5min, comprising 4 cycles of post-exhalation breath-hold followed by free breathing and naturally paced breathing (N=12). Some subjects performed more than one task and only 3 performed all of them.We used a 3T Siemens Vida system (64-channel RF coil, 2D-EPI, TR/TE=1260/30ms, in-plane GRAPPA-2, SMS-3, 60 slices, 2.2mm iso resolution). Respiratory signal (Resp) was acquired with the integrated BioMatrix Sensors at 400Hz and ECG as part of the MR-compatible EEG system (Brain Products) at 5000Hz.Gradient artifact correction4, downsampling (250Hz) and bandpass filtering (0.05-40Hz) were applied to the ECG. EDRs were extracted with 7 method categories: ECG envelope (ENV), heart-rate variability (HRV), amplitude modulation (AM), QRS-area modulation (QRS-AM), principal component analysis (PCA), kernel PCA (kPCA), and empirical mode decomposition (EMD)3. Several EDRs were obtained for some categories (e.g. variations relying on different ECG features), resulting in 51 EDRs. Both Resp and ECG were normalized and downsampled to 10Hz, to compute similarity metrics5,6: correlation (maximum over a lag of +/-5s, optimizing for phase delays, and with no lag, to mimic a real situation with unknown optimal lags); coherence (magnitude squared coherence averaged over a respiratory frequency band). Using optimal lags, the EDR method yielding the highest correlation with Resp for each category was selected for all tasks.
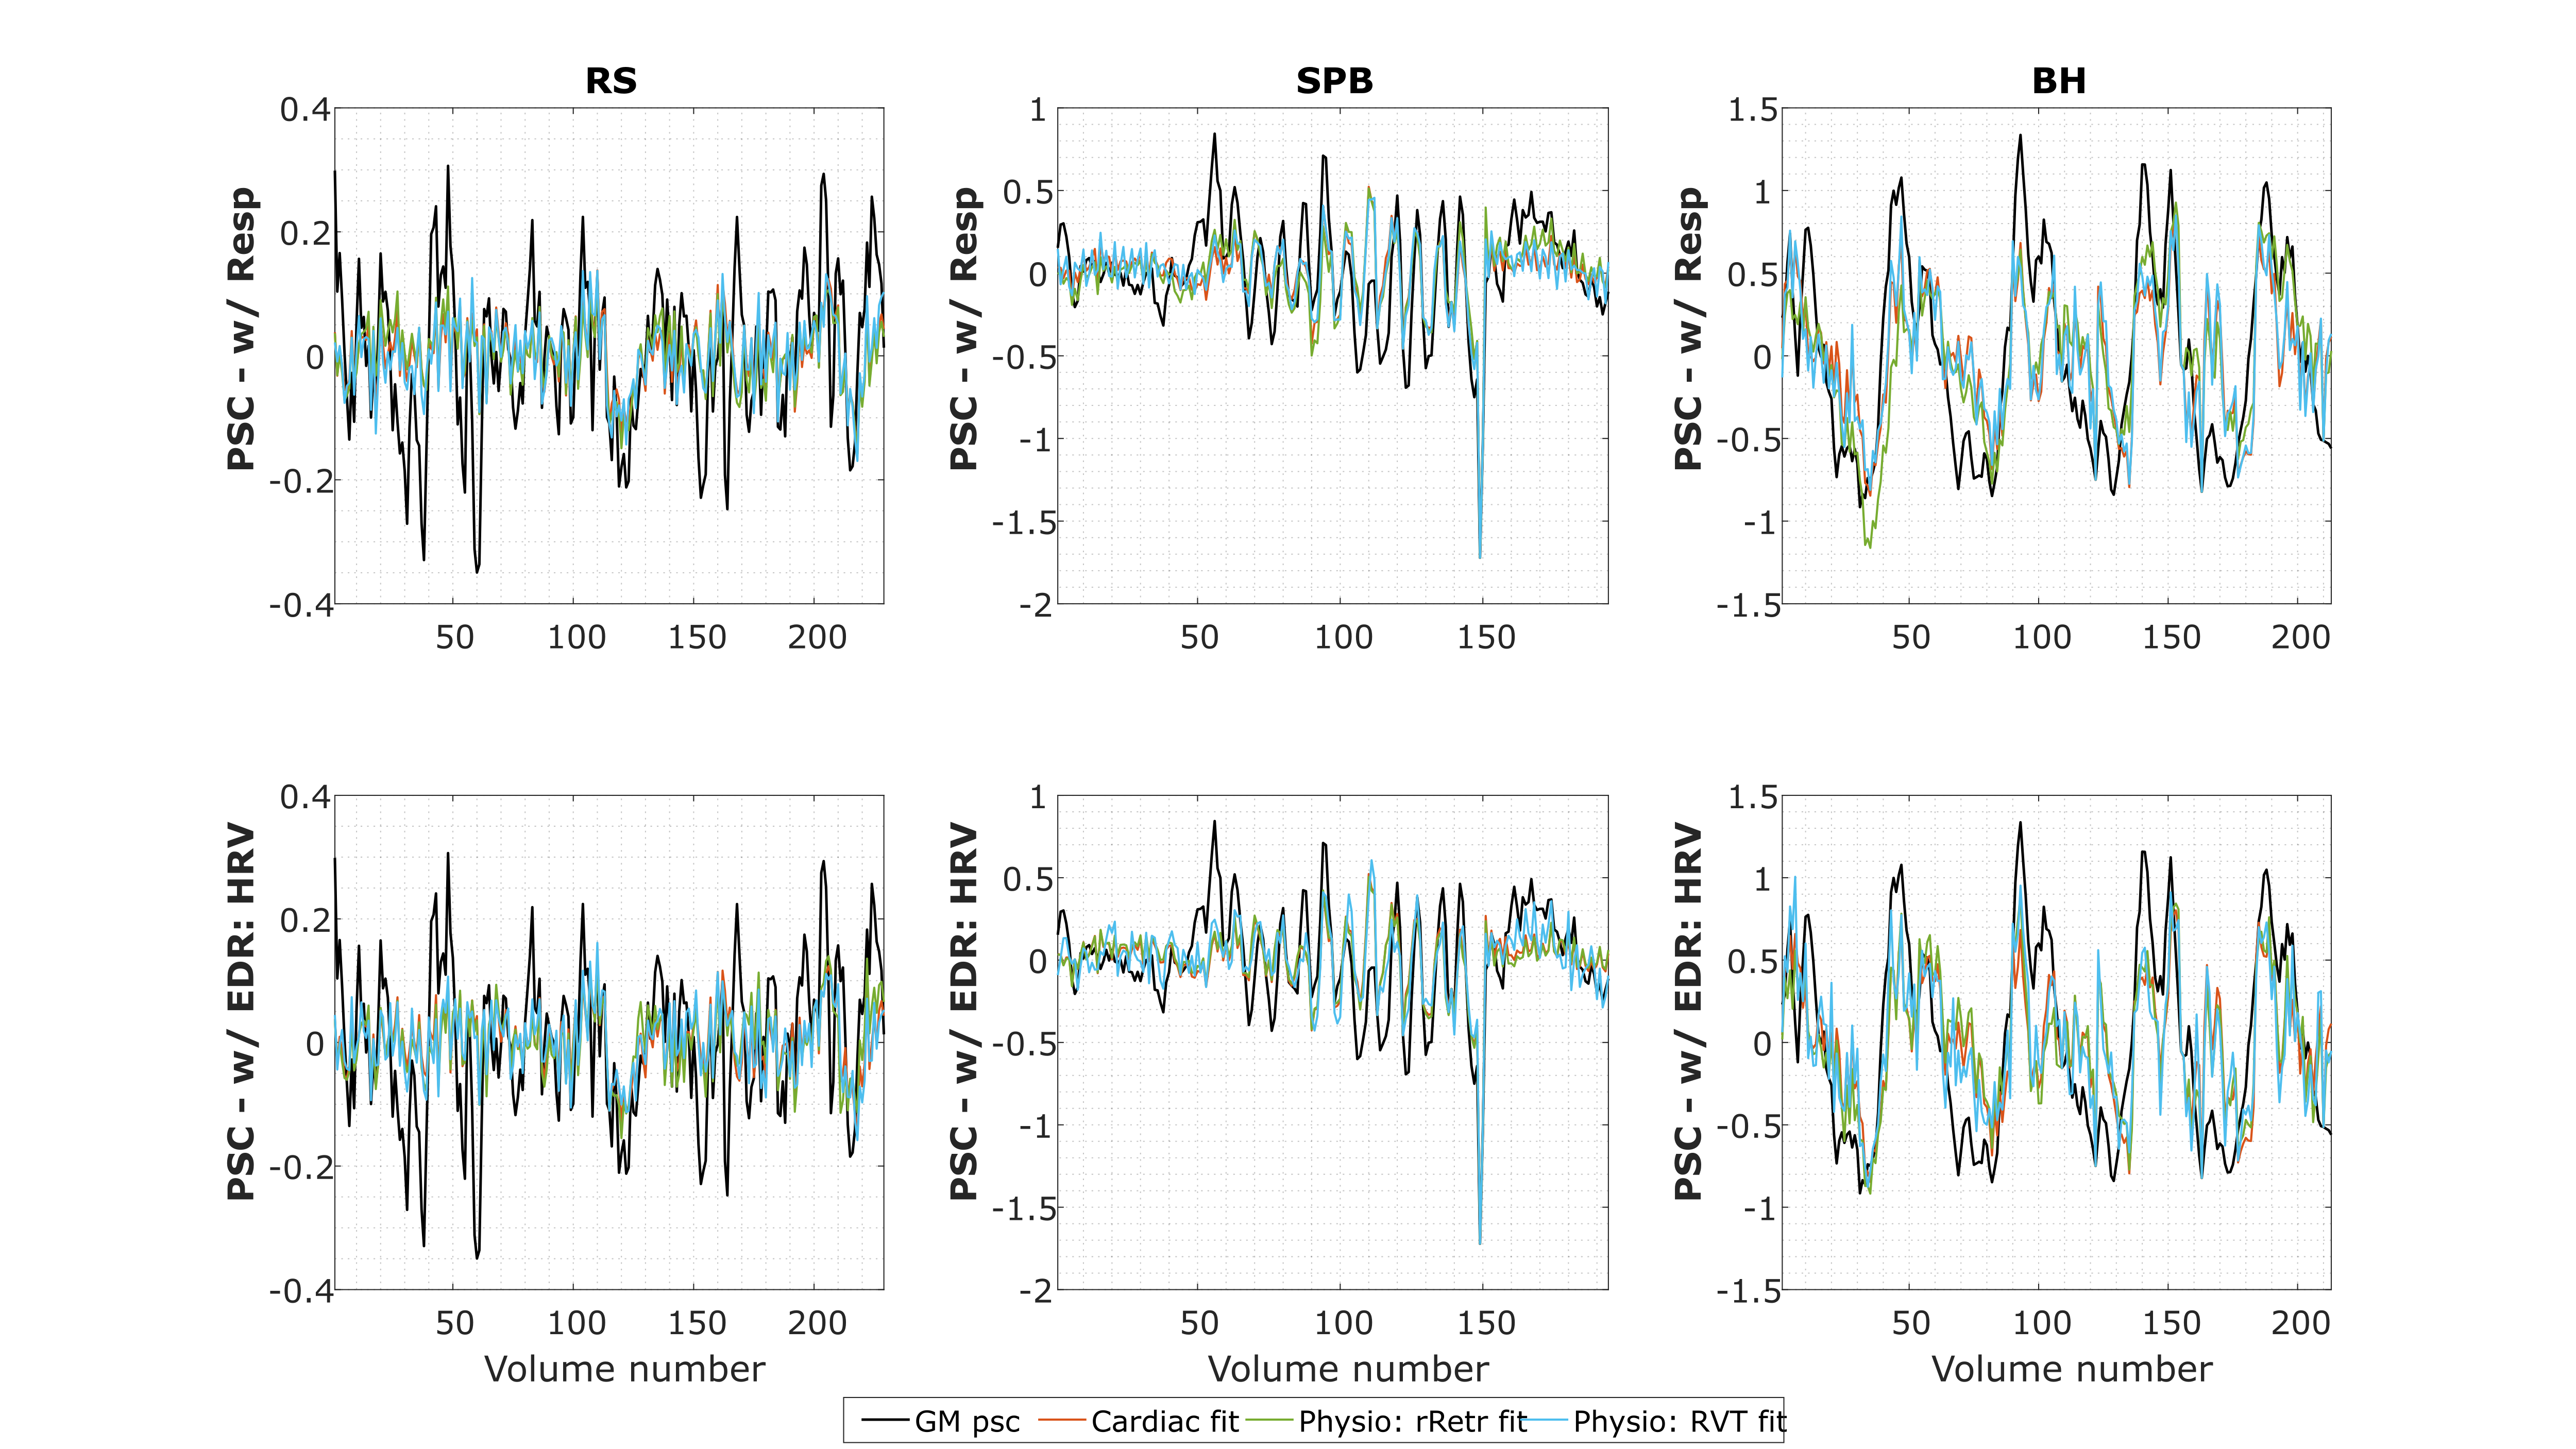
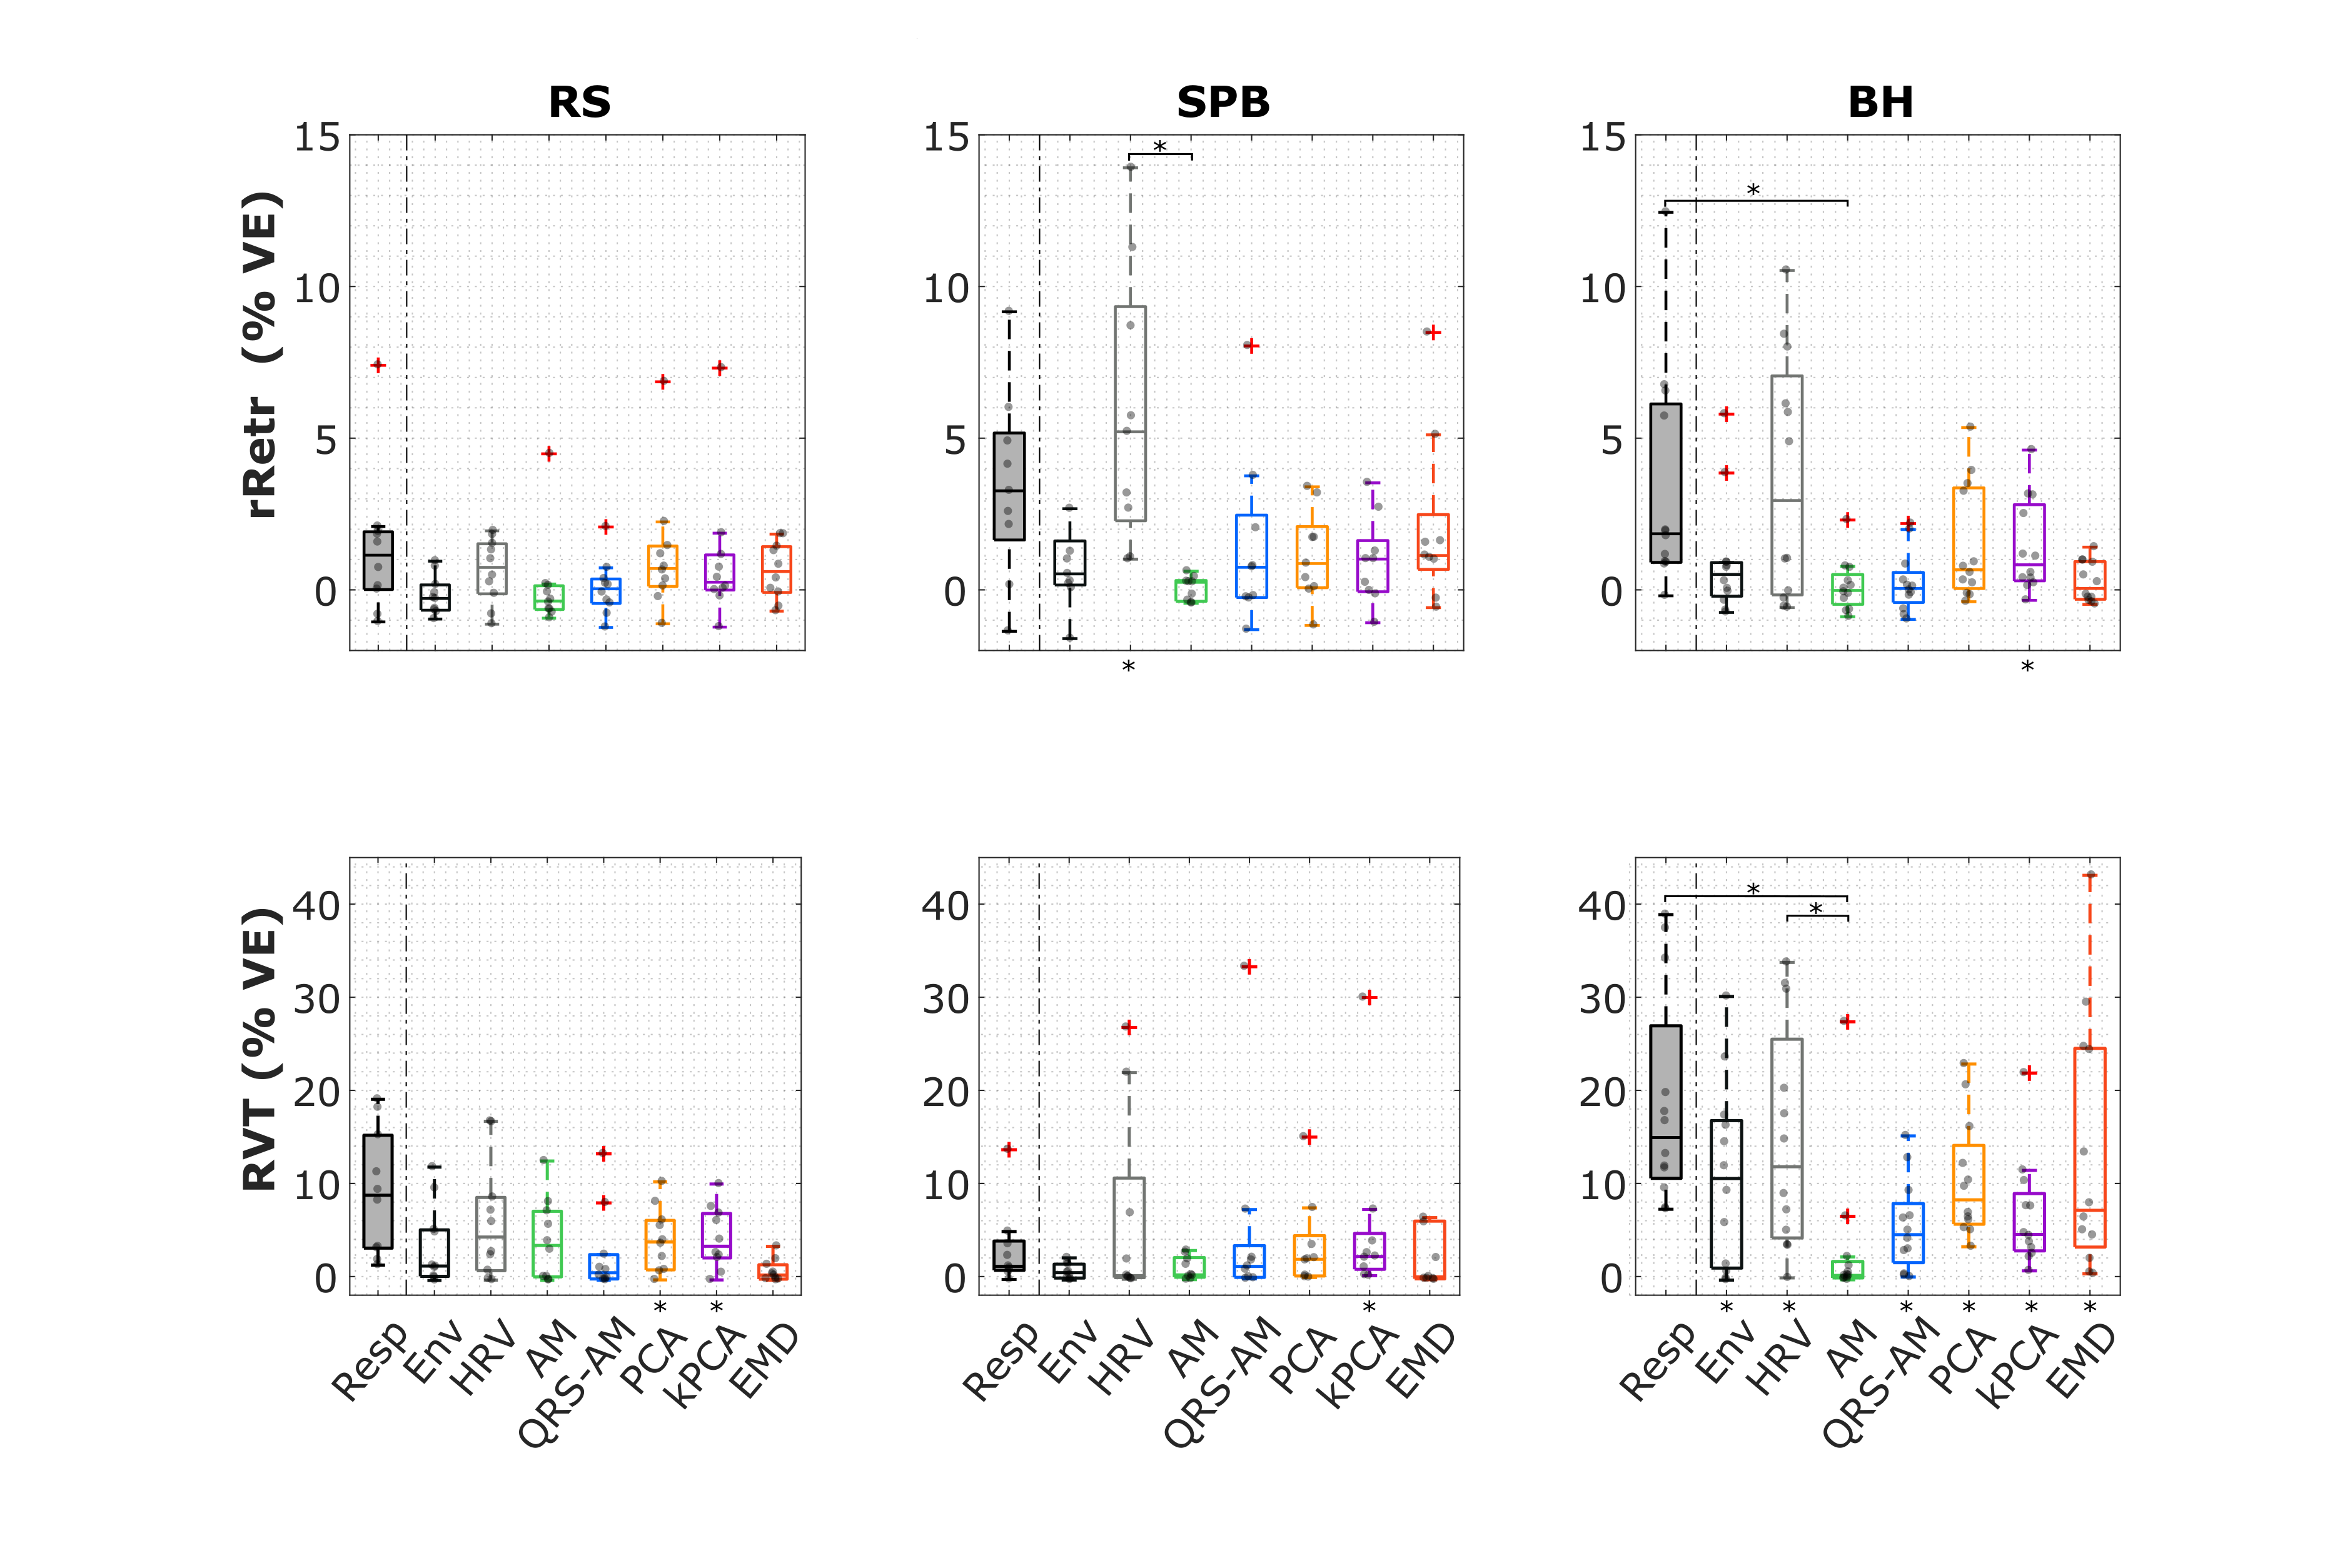
To investigate the contribution of respiratory fluctuations measured by EDR to the BOLD-fMRI data, cardiac and respiratory regressors were obtained from Resp and EDR (with no lag). The BOLD data was preprocessed (corrected for distortion and motion, and high-pass filtered) and three general linear models (GLM) were fitted to the average BOLD signal in gray matter (GM), including 6 realignment parameters and motion outliers (for SPB, a task block was included too): Cardiac only (RETROICOR cardiac terms; cardiac rate), Physio-rRetr (Cardiac; RETROICOR respiratory terms); and Physio-RVT (Cardiac; respiratory volume per time, RVT)7,8,9,10.The variance explained (VE) was computed from the adjusted R2 (R2adj).
Results
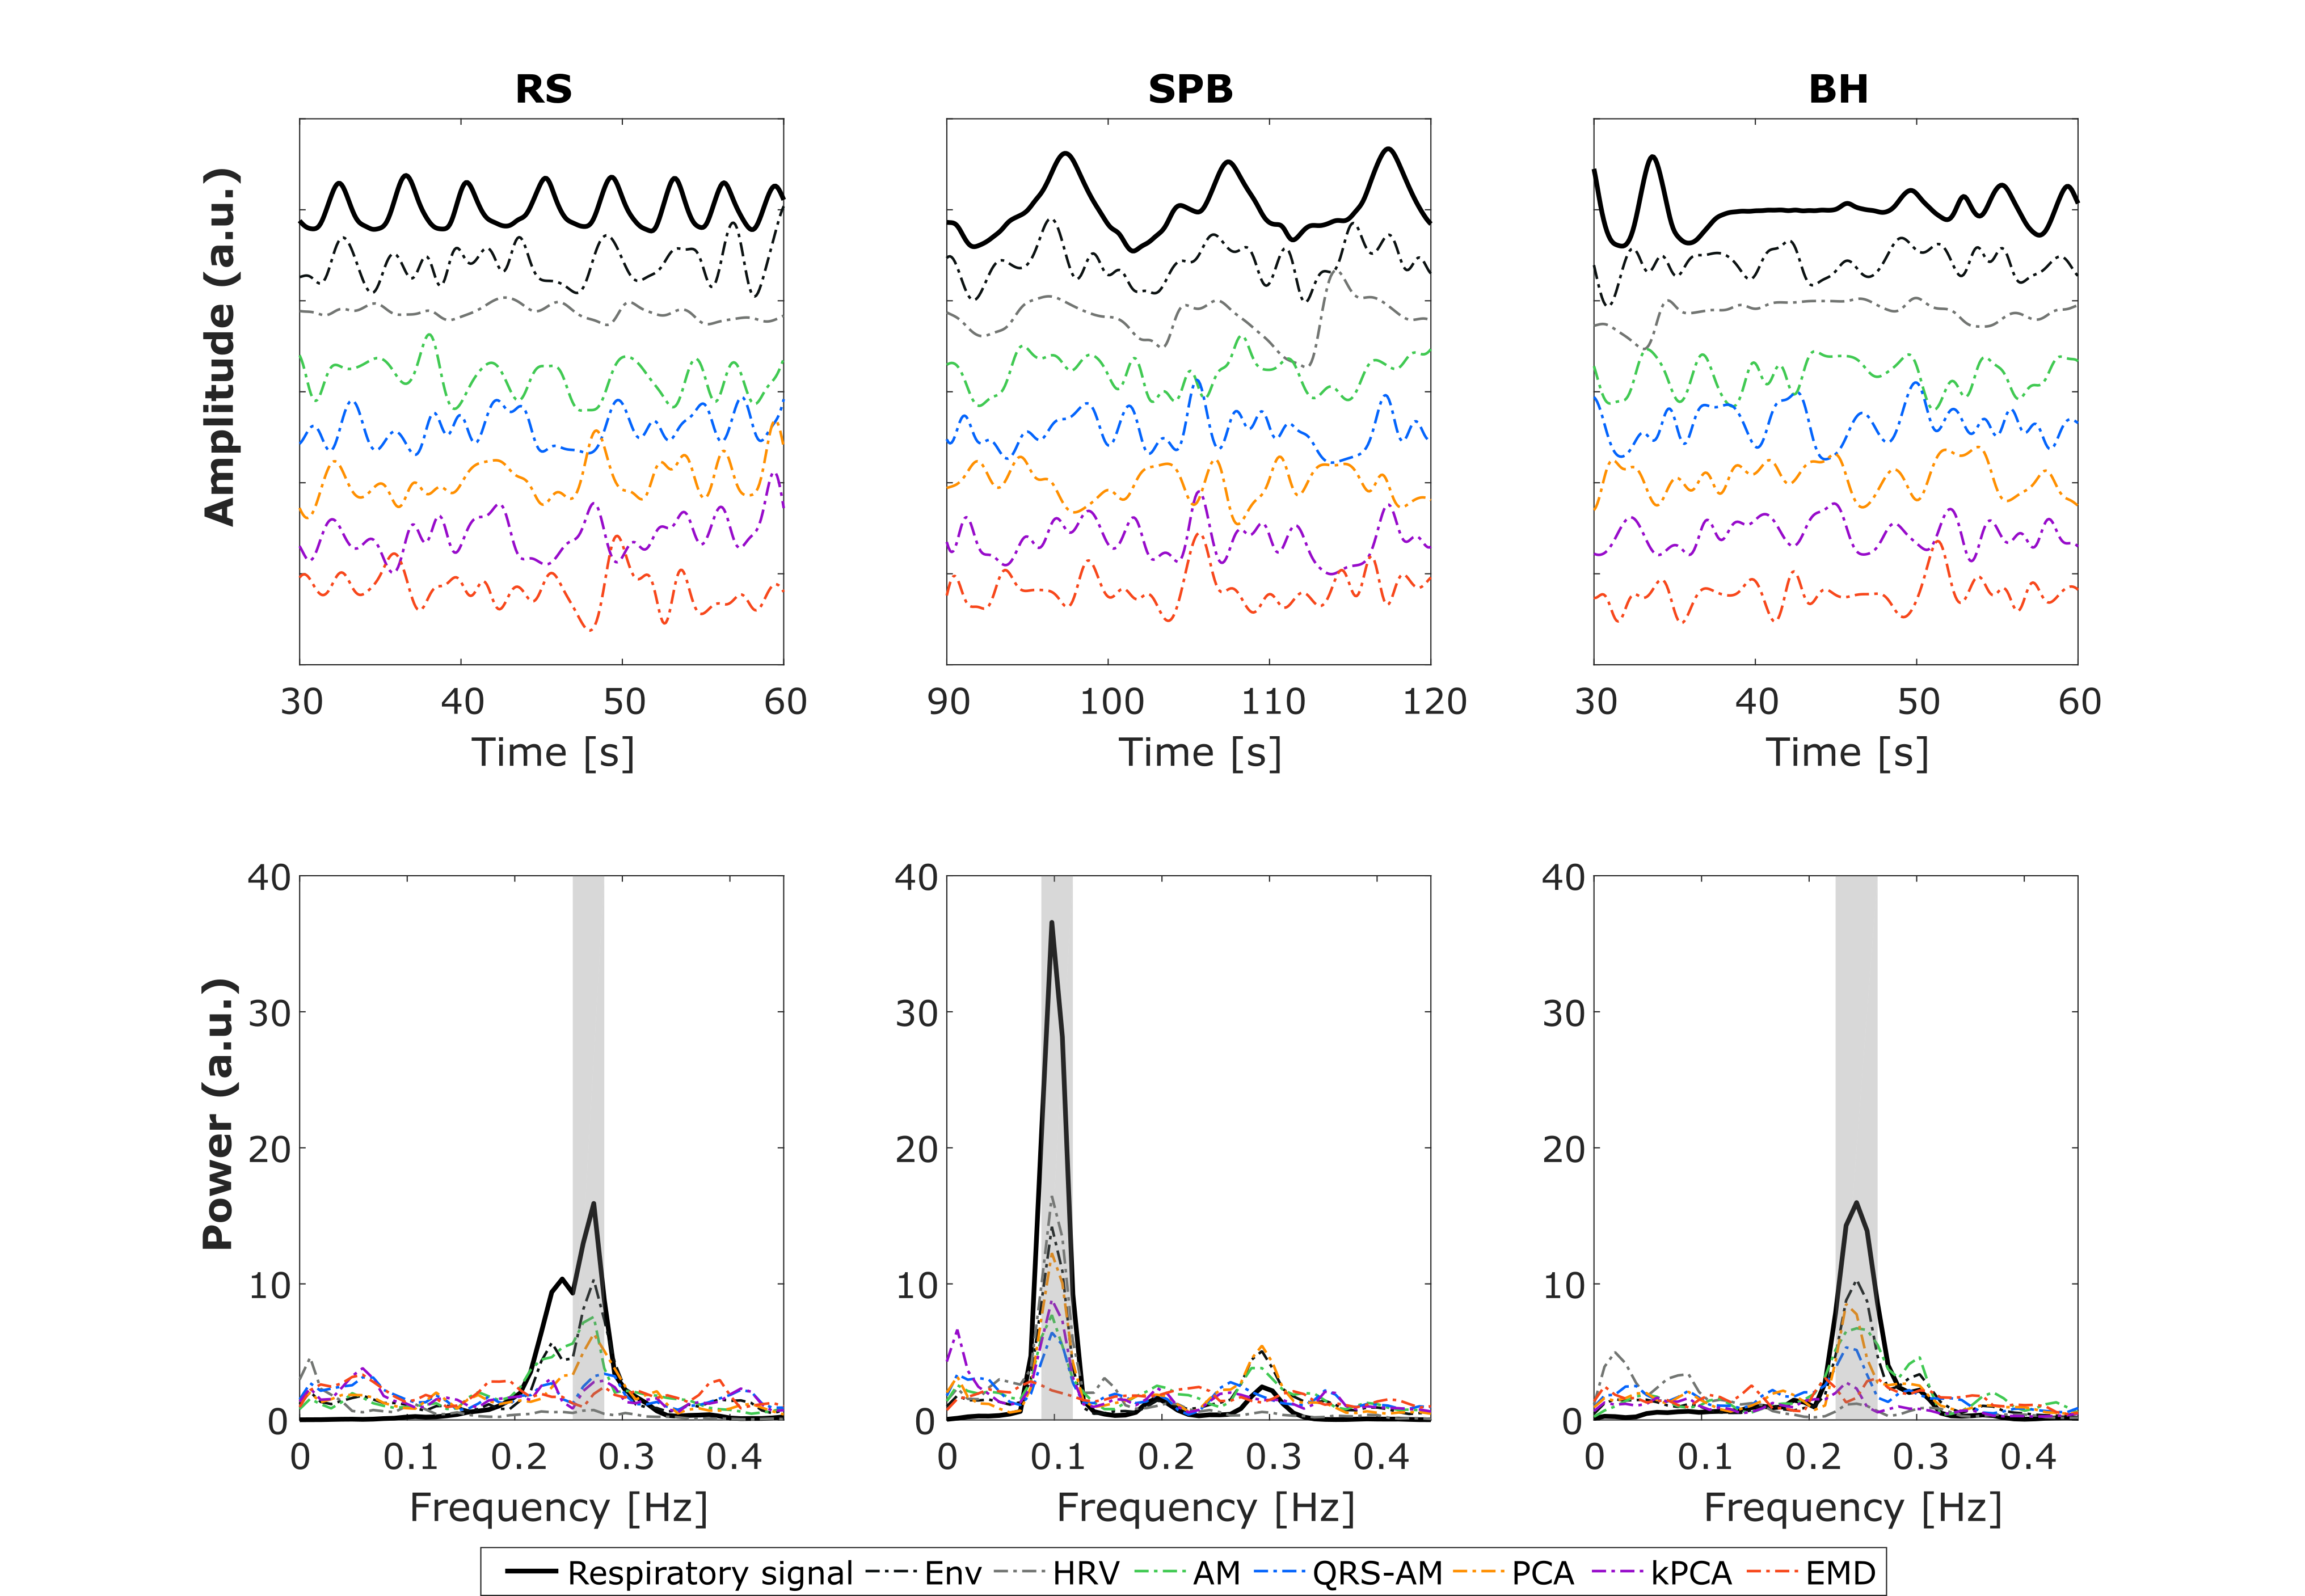
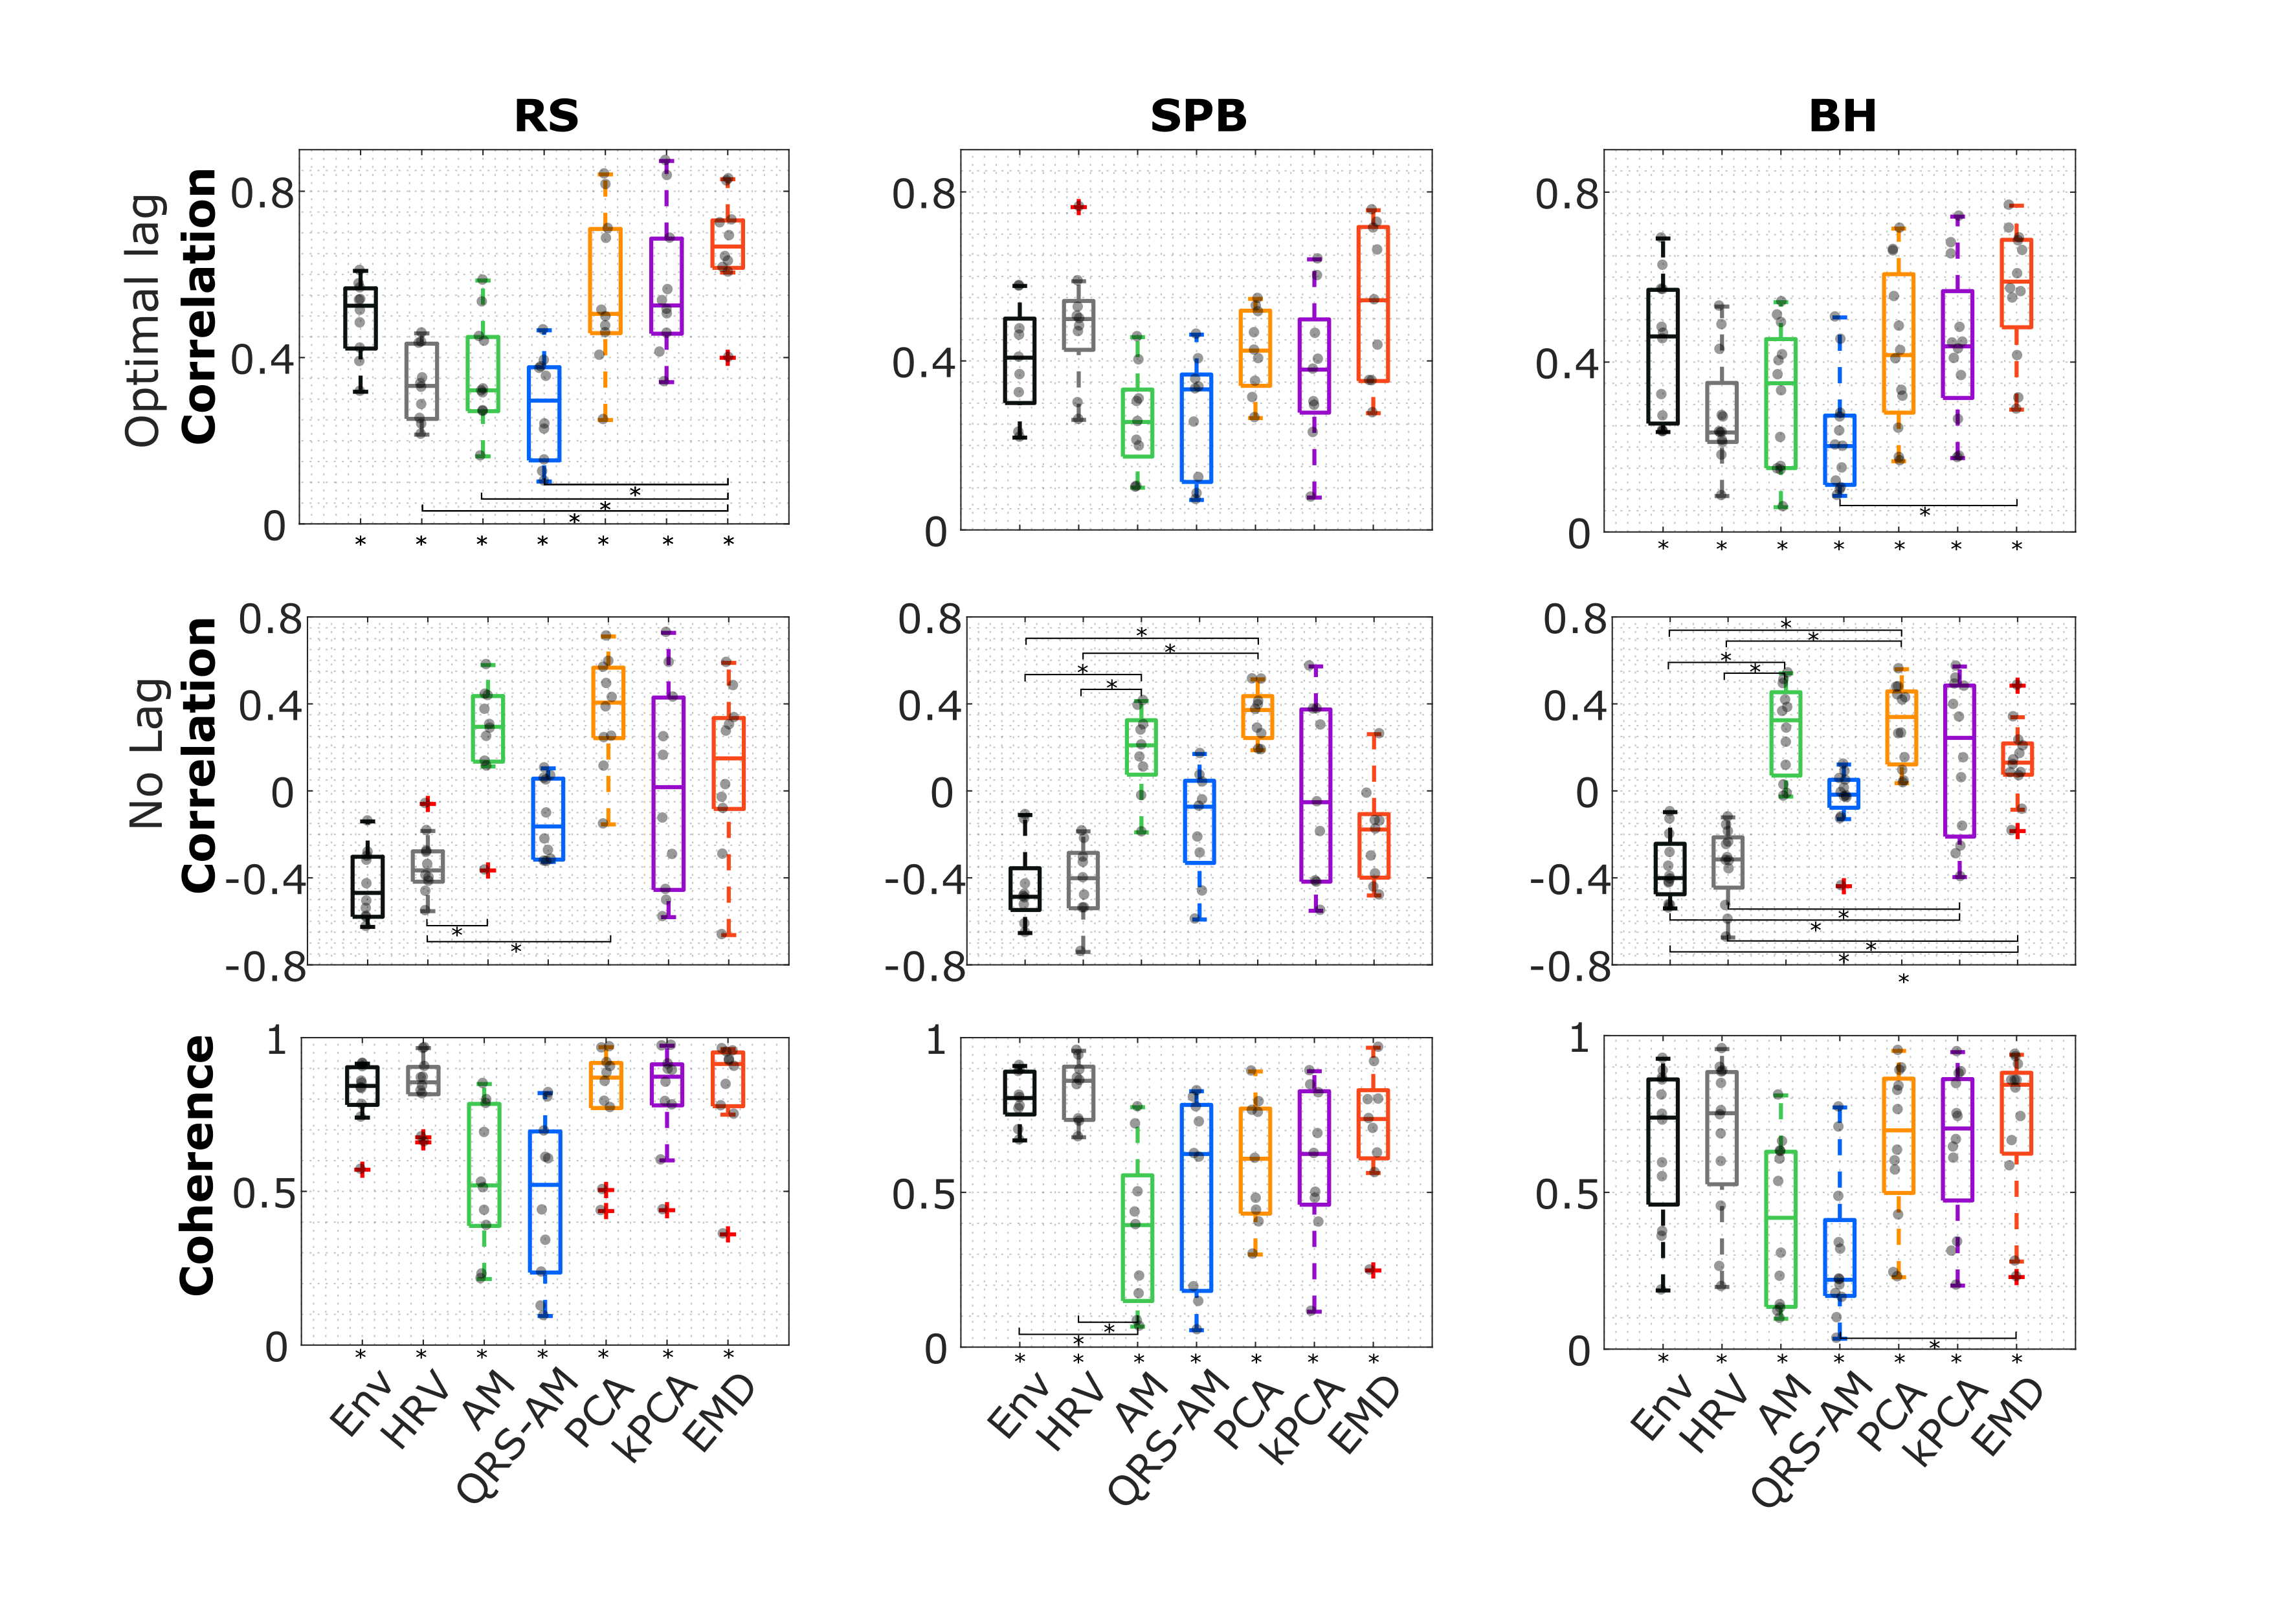
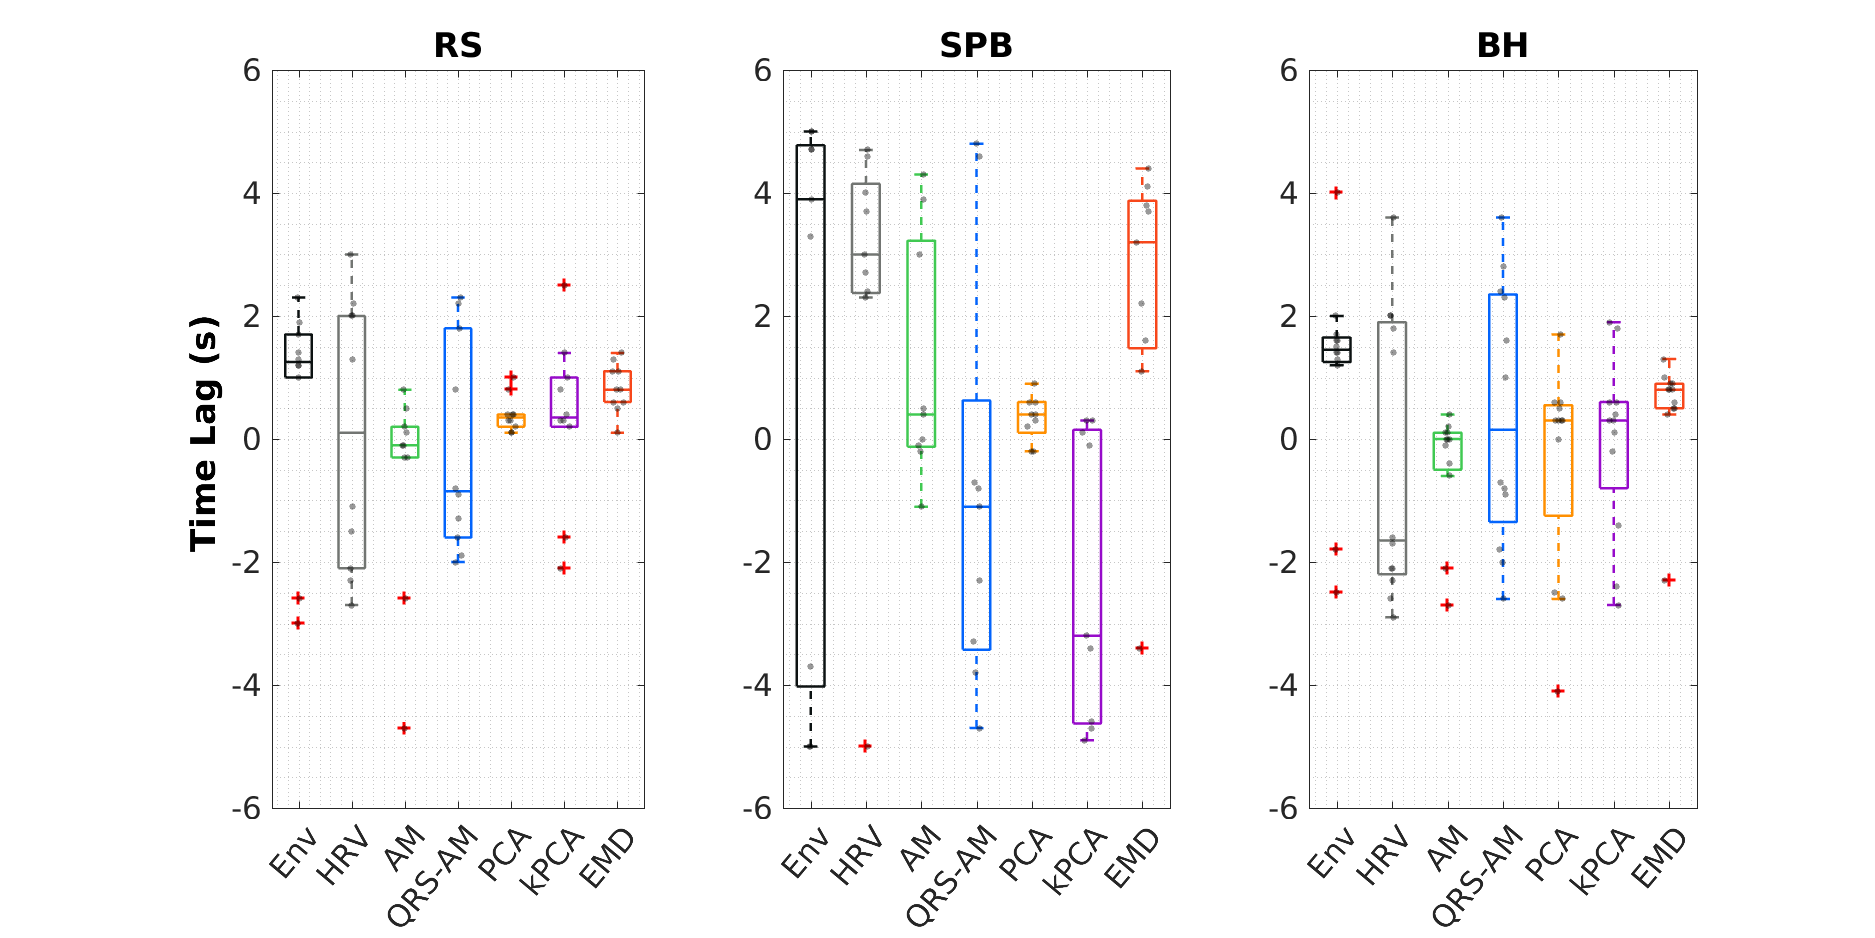
The example (Fig.1) suggests that EDR methods differ in their ability to accommodate breathing changes, with amplitude differences, though their power spectra overlap the respiratory frequency band. Using optimal lags, all EDRs are significantly correlated with Resp, for RS and BH (but not for SPB, with a smaller sample size). With no lag, this effect disappears and correlation differs significantly between EDR methods more often, with PCA performing consistently better and HRV consistently worse than at least one other method (Fig.2). This may be explained by the large scattering of optimal time lags, which are also mostly not centered around zero (Fig3). Regarding physiological regression of the BOLD signal, both Physio models (using Resp and EDRs) are able to fit the data, following it more closely in the case of respiratory tasks (Fig4). The performance of EDRs when estimating VE differs for rRetr and RVT and is dependent on the task (Fig5). Nevertheless, results suggest that HRV is the most consistent method.Discussion
Although all EDR methods were similar to the ground-truth, with the optimal lag, EMD showed the highest similarity, in line with previous work3. However, the correlation was affected by the fact that the time lag varies a lot between subjects for some methods, representing a limitation when a ground-truth respiration is not available. Yet, coherence values, unaffected by lags, were considered significantly large. This, and the fact that frequency features play an important role in estimating the regressors, may explain why HRV, with one of the largest coherence values for all tasks, appeared to provide the best models. In general, though smaller, the VE obtained from the EDRs was not significantly different from the one obtained with Resp, indicating the feasibility of using EDRs as a physiological regressor in resting-state EEG-fMRI as well as tasks with substantial respiratory modulations. In fact, EDR methods performed well in the latter case, possibly representing an alternative when respiration is being monitored as a key factor and the signal gets lost or highly corrupted.Conclusions
Overall, EDR methods provided good Resp estimates, even in the presence of respiratory modulations, being useful for monitoring and computation of physiological regressors.Acknowledgements
We acknowledge the FCT through grants PTDC/EMD-EMD/29675/2017, LISBOA-01-0145-FEDER-029675, UIDB/50009/2020 and PD/BD/150356/2019.References
1. Bulte, D., & Wartolowska, K. (2017). Monitoring cardiac and respiratory physiology during FMRI. NeuroImage, 154, 81–91. https://doi.org/10.1016/j.neuroimage.2016.12.001
2. Varon, C., Morales, J., Lázaro, J., Orini, M., Deviaene, M., Kontaxis, S., Testelmans, D., Buyse, B., Borzée, P., Sörnmo, L., Laguna, P., Gil, E., & Bailón, R. (2020). A Comparative Study of ECG-derived Respiration in Ambulatory Monitoring using the Single-lead ECG. Scientific Reports, 10(1), 5704. https://doi.org/10.1038/s41598-020-62624-5
3. Abreu, R., Nunes, S., Leal, A., & Figueiredo, P. (2017). Physiological noise correction using ECG-derived respiratory signals for enhanced mapping of spontaneous neuronal activity with simultaneous EEG-fMRI. NeuroImage, 154, 115–127. https://doi.org/10.1016/j.neuroimage.2016.08.008
4. Niazy, R. K., Beckmann, C. F., Iannetti, G. D., Brady, J. M., & Smith, S. M. (2005). Removal of FMRI environment artifacts from EEG data using optimal basis sets. NeuroImage, 28(3), 720–737. https://doi.org/10.1016/j.neuroimage.2005.06.067
5. Widjaja, D., Varon, C., Dorado, A., Suykens, J. A. K., & Van Huffel, S. (2012). Application of Kernel Principal Component Analysis for Single-Lead-ECG-Derived Respiration. IEEE Transactions on Biomedical Engineering, 59(4), 1169–1176. https://doi.org/10.1109/TBME.2012.2186448
6. Varon, C., & Van Huffel, S. (2015). ECG-derived respiration for ambulatory monitoring. 2015 Computing in Cardiology Conference (CinC), 169–172. https://doi.org/10.1109/CIC.2015.7408613
7. Glover, G. H., Li, T.-Q., & Ress, D. (2000). Image‐based method for retrospective correction of physiological motion effects in fMRI: RETROICOR. 6.
8. Bianciardi, M., Fukunaga, M., van Gelderen, P., Horovitz, S. G., de Zwart, J. A., Shmueli, K., & Duyn, J. H. (2009). Sources of functional magnetic resonance imaging signal fluctuations in the human brain at rest: A 7 T study. Magnetic Resonance Imaging, 27(8), 1019–1029. https://doi.org/10.1016/j.mri.2009.02.004
9. Birn, R. M., Murphy, K., & Bandettini, P. A. (2008). The effect of respiration variations on independent component analysis results of resting state functional connectivity. Human Brain Mapping, 29(7), 740–750. https://doi.org/10.1002/hbm.20577
10. Chang, C., Cunningham, J. P., & Glover, G. H. (2009). Influence of heart rate on the BOLD signal: The cardiac response function. NeuroImage, 44(3), 857–869. https://doi.org/10.1016/j.neuroimage.2008.09.029
Figures