2547
Network representation of fMRI timeseries using visibility graphs1Australian Catholic University, Melbourne, Australia
Synopsis
Keywords: Data Analysis, fMRI (resting state)
Timeseries can be mapped into graphs by linking visibility of the signal at each time-point with respect to others – an approach known as visibility graph. We used visibility graph analysis to convert fMRI data into complex networks. We then evaluated the graph theoretical properties of this network and characterised their robustness to motion and test-retest reliability between sessions. We show that time-series network features such as average degree, average path length, and clustering coefficient are highly sensitive to motion. However, on a low-motion dataset they have a good reliability between sessions.Introduction
A timeseries can be mapped into a network by linking the visibility of the signal at each time-point with respect to others – an approach known as visibility graphs (VG) [1]. A VG network recapitulates intra-timeseries relationships, which can be analysed using methods derived from graph theory. Such analyses can generate rich repertoire of features useful for characterising the structure and dynamics of the time-series data[2, 3]. Studies have shown that time-series graphs can capture the structure in the data that is beyond what can be achieved by conventional statistical and signal processing techniques [4]. To further evaluate the potential of VG-based approach for analysis of fMRI data, test–retest reliability and robustness of features and measures derived from time-series networks is needed. In this study, we provide the first such evaluation by examining 1) the impact of motion of VG-based features, and 2) test–retest reliability of features extracted from VG of time-series.Methods
Natural visibility graphsGiven an fMRI time series $$$x_t$$$, the Natural Visibility Graph (NVG) defines the connectivity (E) between nodes $$$𝑣_𝑖$$$, and $$$𝑣_𝑗$$$, if there is a line of visibility between the signal amplitude $$$x_i$$$ and $$$x_j$$$. Therefore, any two datapoints ($$$t_i$$$, $$$x_i$$$) and ($$$t_j$$$, $$$x_j$$$) will be connected nodes of the graph, if any other data points ($$$t_k$$$, $$$x_k$$$) which lie between them meet the following criteria.$$ x_k < x_j + (x_i - x_j) \frac {(t_j - t_k)} {(t_j - t_i)}$$Weighted NVG can be obtained by using Euclidian distance between time-points as weighting factor.The graphs obtained using NVG can be analysed using graph-theoretical methods. In this work we use five global properties of the graph, 1) average weighted degree, 2) average path length, 3) global clustering coefficient, 4) number of communities, and 5) clustering coefficient to characterise the time-series graphs.
Data and processing
The dataset used in the present study was obtained from the Human Connectome Project (HCP) S1200 release [5]. The participants (n=1113) for HCP study were young healthy adults between the age of 22 and 37 years. The current study uses the data from the participants who completed all four runs with a final sample of 1010 individuals (mean age 29 ±4 years, 453 males). fMRI preprocessing steps included 1) removal of spatial artifacts and distortions, 2) correction of head motion, 3) spatial registration to the MNI (Montreal Neurological Institute) standard space and 3) removal of motion-related and structured physiological noise artefacts using ICA-FIX. Data were analyzed in CIFTI (Connectivity Informatics Technology Initiative) format, in which cortical surface timeseries and subcortical volume time series re combined in a grayordinate dense time series file. Head motion was quantified using framewise displacement [6]. The pre-processed fMRI time-series data from each session (REST1 and REST2) were temporally concatenated across the two runs within the session. This generated approximately 30 mins of rs-fMRI data for session. The fMRI data were parcellated into individual time-series using Schaefer 400 atlas and used for NVG analysis.
Robustness and reliability estimates
To estimate the impact of motion on features, we identified correlation (Pearson’s) between each feature and percentage of motion events (defined as FD>0.2) across the participants. Next, to identify allowable percentage of motion events (that can be scrubbed) without compromising the features, we ran Pearson’s correlation between percentage of motion events in the data and visibility graphs features for percentage threshold from 50% to 95% in the steps of 0.5%. This allowed us identify appropriate threshold.To estimate reliability of visibility graph features between two sessions (REST1 and REST2), we used intraclass correlation method. ICC was used to quantify to which extent the visibility graph features for each regions could separate within and between subjects.
Results
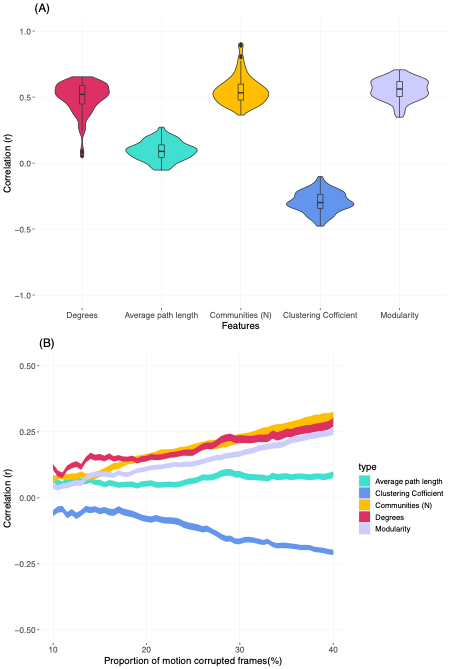
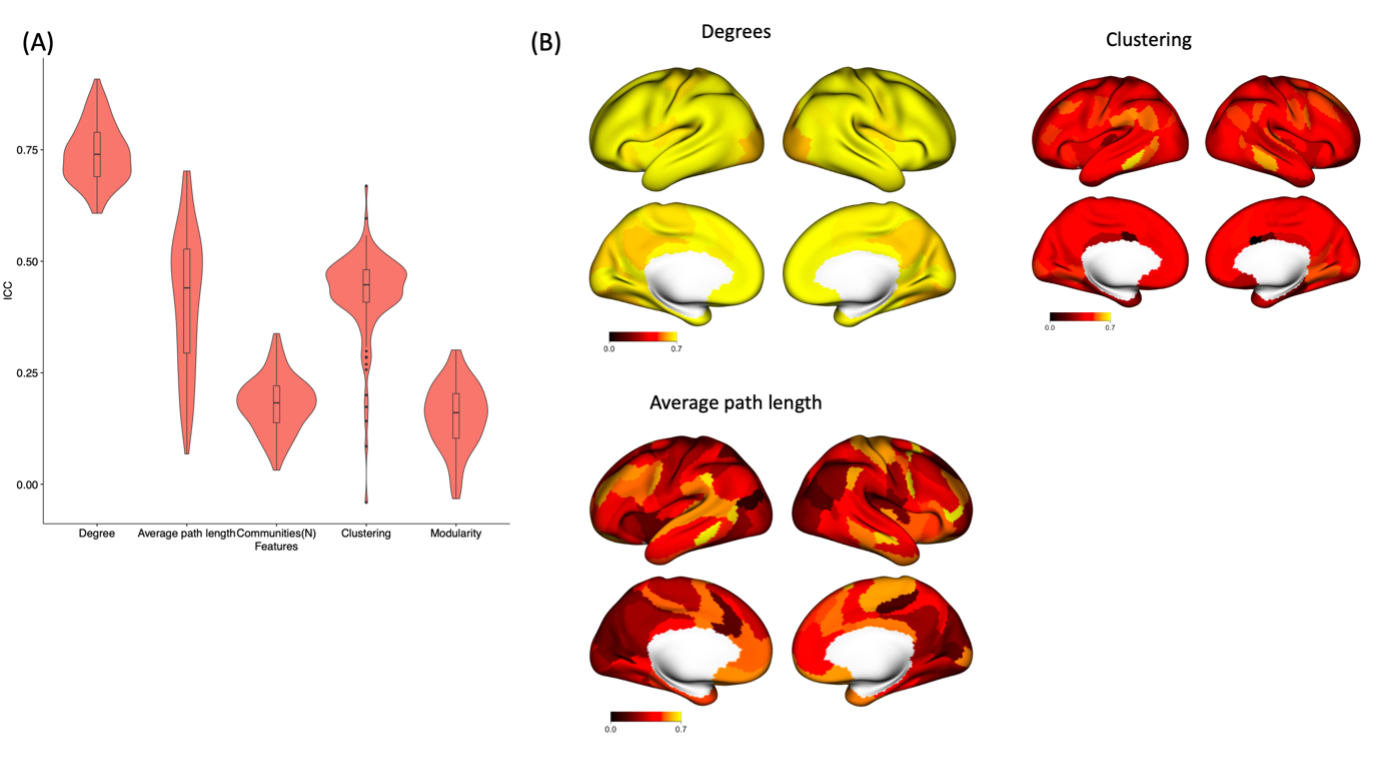
Figure 1 shows the relationship between motion (Framewise displacement) in fMRI time-series and VG features. The largest impact of motion was observed on the number of communities (r = 0.55 ± 0.11), modularity (r = 0.55 ± 0.08), and average degrees (r = 0.50± 0.12), followed by clustering coefficient (r = -0.29 ± 0.08) NVG features. The average path length feature was least affected by motion (r = 0.09± 0.07). . On average, the correlation between motion and VG features falls to less than r = 0.1, when the motion corrupted data frames are less than 20%.The intraclass correlation analysis within this dataset showed a good test-retest reliability between two sessions (Rest1 and Rest2) for the average degrees VG feature (ICC=0.74 ± 0.06). The clustering coefficient (ICC = 0.43 ± 0.09) and average path length (ICC=0.41± 0.15) also showed moderate reliability. Whereas, other features (number of communities and modularity) were associated with weak reliability (ICC<0.2) (Figure 2).
Conclusion
We have shown that small movements can alter VG features of fMRI data. On a low-motion dataset, network features such as average degree, average path length, and clustering coefficient showed good test-retest reliability between sessions.Acknowledgements
Data were provided [in part] by the Human Connectome Project, WU-Minn Consortium (Principal Investigators: David Van Essen and Kamil Ugurbil; 1U54MH091657) funded by the 16 NIH Institutes and Centers that support the NIH Blueprint for Neuroscience Research; and by the McDonnell Center for Systems Neuroscience at Washington University.References
1. Lacasa, L.; Luque, B.; Ballesteros, F.; Luque, J.; Nuno, J. C., From time series to complex networks: the visibility graph. Proc Natl Acad Sci U S A 2008, 105, (13), 4972-5.
2. Sannino S; Stramaglia S; Lacasa L; D., M., Visibility graphs for fMRI data: Multiplex temporal graphs and their modulations across resting-state networks. . Network Neuroscience 2017, 1(3), (3), 208-221.
3. Varley, T. F.; Sporns, O., Network Analysis of Time Series: Novel Approaches to Network Neuroscience. Front Neurosci-Switz 2022, 15.
4. Stephen, M.; Gu, C.; Yang, H., Visibility Graph Based Time Series Analysis. PLoS One 2015, 10, (11), e0143015.
5. Van Essen, D. C.; Smith, S. M.; Barch, D. M.; Behrens, T. E. J.; Yacoub, E.; Ugurbil, K.; Consortium, W.-M. H., The WU-Minn Human Connectome Project: An overview. Neuroimage 2013, 80, 62-79.
6. Power, J. D.; Schlaggar, B. L.; Petersen, S. E., Recent progress and outstanding issues in motion correction in resting state fMRI. Neuroimage 2015, 105, 536-551.
Figures