2543
Increased BOLD resting-state fluctuation amplitude following upregulation of inhibitory activity with the GABA agonist alprazolam1Beth Israel Deaconess Medical Center, Harvard Medical School, Boston, MA, United States, 2University of Pennsylvania, Philadelphia, PA, United States
Synopsis
Keywords: Data Analysis, fMRI (resting state), Pharmacological MRI | Drugs | GABA | Brain connectivity
Neural activity reflects a complex interplay between excitatory and inhibitory signaling. Yet, the BOLD signal is typically interpreted as related to excitatory activity. However, GABAergic neurotransmission also requires metabolism and BOLD may be sensitive to this inhibitory activity that can promote coordinated activity across networks. Here, we evaluated the changes in BOLD rsfMRI and rsCBF metrics (amplitude of low frequency fluctuations (ALFF), intrinsic connectivity (IC) and local correlations (LC)) after oral administration of alprazolam, a GABA agonist, in healthy volunteers. We observed a highly significant increase of BOLD ALFF across the cortex that suggests increasing inhibition can increase BOLD signals.Introduction
Pharmacological MRI uses functional MRI (fMRI) to assess effects of pharmacological manipulation on regional brain function. Arterial Spin Labeling (ASL) imaging of cerebral blood flow (CBF) and Blood Oxygenation Level Dependent (BOLD) imaging of brain activity fluctuations can be used for this purpose. In this context, the simplistic picture of coupling between fMRI and brain activity may be inadequate because drugs may directly affect vasculature (1,2) and differential modulation of cell types may alter response (3). Acquisition of multiple functional imaging measures may help to clarify complex pharmacologic responses. Furthermore, the relationship between Gamma-aminobutyric acid (GABA) concentration, the main inhibitory neurotransmitter in the human brain, and BOLD signals is probably more complex than originally stated. Indeed, some studies have found negative correlations between them (4), while others have not shown significance (5). Here, we compared the changes in BOLD rsfMRI and rsCBF metrics derived from ASL time series data after oral administration of alprazolam, a GABA agonist, in healthy volunteers.Methods
Studies were performed in N=30 volunteers (17 Females, age range: 19-42) recruited as part of a double-blinded study approved by the institutional review board. The participation involved two days of scanning, separated by one week, and the subjects were randomized to receive two out of three treatments: placebo, citalopram (20 mg) (preliminary results reported elsewhere (6)) and alprazolam (0.5 mg), in an incomplete block design. The protocol included a baseline MRI exam, the administration of the drug and a second identical MRI exam performed 2h later to account for the drug's pharmacokinetics. The subjects were scanned at 3T (Discovery MR750), using body coil RF transmission and a 32-channel head coil for reception (Nova Medical). Acquisitions included a 1mm isotropic 3D T1-w FSPGR sequence, an ASL sequence using a golden-angle Stack-of-Spirals RARE trajectory (7) and 2D multi-band gradient-echo EPI for BOLD rsfMRI. Reconstruction of ASL images was performed as previously described (7). CBF quantification was performed using a two-compartment model (8). BOLD fluctuations were quantified as percent signal change. Standard preprocessing was performed for both rsCBF and BOLD rsfMRI. Global normalization was not performed to allow global fluctuations of the signal to be assessed. The first five volumes for BOLD rsfMRI data and the first volume for rsCBF data were removed because of transient equilibration effects. To assess changes in spontaneous fluctuations after pharmacological manipulation, we used the CONN toolbox (9) for both rsCBF and BOLD rsfMRI analyses. The first level analysis consisted of computing voxel-level measures of global and local connectivity patterns (realignment and scrubbing added as covariates). We computed amplitude of low frequency fluctuations (ALFF) maps (10), local correlation (LC) maps within a radius of 25mm (11), and intrinsic connectivity (IC) (12) to assess connectivity across the entire brain. We performed a voxel-wise general linear model to compare drug effect on the brain between the alprazolam group and the placebo group for each of the three fluctuation measures. Two-sided cluster-level T-contrasts were obtained using non-parametric statistics (voxel-level threshold, p <0.01 uncorrected, and cluster-level threshold p <0.05 cluster-mass FDR). To increase statistical power and provide specificity to GABA-A distribution hypotheses, we also performed analyses using values derived by weighted summation of signals over GABA-A density maps. Using a publicly available PET-based human atlas of the GABA-A receptor (13), a target of alprazolam, we computed a total weighted factor, for every scan of every subject, which is calculated by summing voxel-wise the voxel value (ALFF, IC or LC) multiplied with the GABA-A density value. Next, within R, we fit a linear mixed-effect model defining the weighted factor as the outcome variable, the conditions as a fixed effect and subjects as a crossed random effect. Significant results were defined with p <0.05.Results
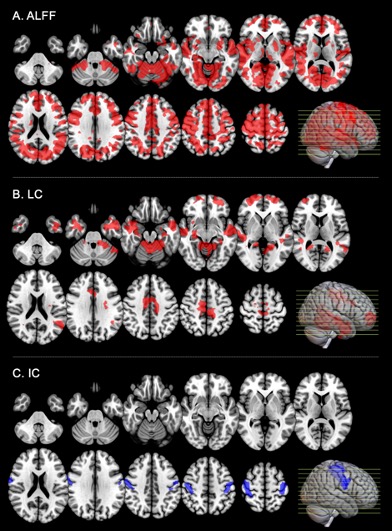
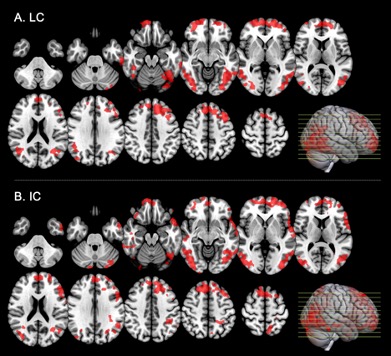
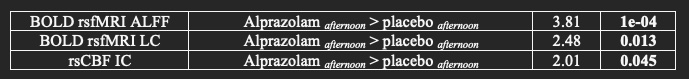
An increase of the amplitude of BOLD signal fluctuations, measured with ALFF, was observed across almost the entire neocortex with both image-based and GABA-A-weighted regional analyses (Fig1A, Tab1) after alprazolam uptake. In contrast, rsCBF ALFF showed no significant change on either image-based or GABA-A-weighted regional analyses. Though not as significant as the BOLD ALFF changes, increased BOLD LC was observed in some areas of the image-based analysis (Fig1B), and on the GABA-A regional analyses (Tab1). A decrease of IC in primary motor areas was observed with image-based analysis (Fig1C) but not with GABA-A regional analyses. A significant increase of correlated activity after alprazolam intake, assessed with rsCBF, was observed in frontal, orbito-frontal, temporal and parietal regions on both LC and IC maps (Fig2). However, the GABA-A-weighted ROI analyses only reached significance for IC (Tab1).Conclusion
We have shown a highly significant increase of BOLD ALFF not detected with rsCBF ALFF after alprazolam intake. More modest but still significant modulations of connectivity, primarily increases, were observed with both BOLD and rsCBF. These results suggest a positive relationship between BOLD signal and inhibition, at least in some circumstances. Factors affecting rsCBF ALFF have not been widely studied, but the absence of detectable rsCBF ALFF change despite increased BOLD ALFF suggests altered flow metabolism coupling with inhibition. Indeed, an increase of inhibitory interneuron activity might not always be accompanied with an increase of CBF (3) and other physiological parameters influence the BOLD signal increase.Acknowledgements
No acknowledgement found.References
1. Diukova A, Ware J, Smith JE, et al. Separating neural and vascular effects of caffeine using simultaneous EEG–FMRI: Differential effects of caffeine on cognitive and sensorimotor brain responses. NeuroImage 2012;62:239–249 doi: 10.1016/j.neuroimage.2012.04.041.
2. Drew PJ, Mateo C, Turner KL, Yu X, Kleinfeld D. Ultra-slow Oscillations in fMRI and Resting-State Connectivity: Neuronal and Vascular Contributions and Technical Confounds. Neuron 2020;107:782–804 doi: 10.1016/j.neuron.2020.07.020.
3. Howarth C, Mishra A, Hall CN. More than just summed neuronal activity: how multiple cell types shape the BOLD response. Philosophical Transactions of the Royal Society B: Biological Sciences 2021;376:20190630 doi: 10.1098/rstb.2019.0630.
4. Donahue MJ, Near J, Blicher JU, Jezzard P. Baseline GABA concentration and fMRI response. NeuroImage 2010;53:392–398 doi: 10.1016/j.neuroimage.2010.07.017.
5. Harris AD, Puts NAJ, Anderson BA, et al. Multi-regional investigation of the relationship between functional MRI blood oxygenation level dependent (BOLD) activation and GABA concentration. PLoS One 2015;10:e0117531 doi: 10.1371/journal.pone.0117531.
6. Munsch F, Taso M, Wolf D, et al. Pharmacological magnetic resonance imaging: BOLD and ASL provide complementary results. In: OHBM. Virtual; 2022.
7. Munsch F, Taso M, Zhao L, Lebel RM, Guidon A, Alsop DC. Rotated Stack of Spirals 3D RARE for Single-shot Volumetric ASL Acquisition. In: Proceedings of the 27th annual meeting of the ISMRM. Vol. 3931. Montreal, Canada; 2019.
8. Parkes LM. Quantification of cerebral perfusion using arterial spin labeling: Two-compartment models. Journal of Magnetic Resonance Imaging 2005;22:732–736 doi: 10.1002/jmri.20456.
9. Whitfield-Gabrieli S, Nieto-Castanon A. Conn: A Functional Connectivity Toolbox for Correlated and Anticorrelated Brain Networks. Brain Connectivity 2012;2:125–141 doi: 10.1089/brain.2012.0073.10. Yu-Feng Z, Yong H, Chao-Zhe Z, et al. Altered baseline brain activity in children with ADHD revealed by resting-state functional MRI. Brain and Development 2007;29:83–91 doi: 10.1016/j.braindev.2006.07.002.
11. Deshpande G, LaConte S, Peltier S, Hu X. Integrated local correlation: A new measure of local coherence in fMRI data. Human Brain Mapping 2009;30:13–23 doi: 10.1002/hbm.20482.
12. Martuzzi R, Ramani R, Qiu M, Shen X, Papademetris X, Constable RT. A whole-brain voxel based measure of intrinsic connectivity contrast reveals local changes in tissue connectivity with anesthetic without a priori assumptions on thresholds or regions of interest. NeuroImage 2011;58:1044–1050 doi: 10.1016/j.neuroimage.2011.06.075.
13. Nørgaard M, Beliveau V, Ganz M, et al. A high-resolution in vivo atlas of the human brain’s benzodiazepine binding site of GABAA receptors. NeuroImage 2021;232:117878 doi: 10.1016/j.neuroimage.2021.117878.
Figures