2536
Improved BOLD activation using multiecho acquisition in simultaneous brain-spinal cord fMRI1Stanford University, Stanford, CA, United States
Synopsis
Keywords: Data Processing, Spinal Cord, fmri, multiecho, brain
Functional activation within brain has been studied extensively using fMRI. But limiting investigation to only the brain provides a truncated view of the human central nervous system as it does not capture information exchange between brain and body periphery through spinal cord. Simultaneous brain-spinal cord fMRI provides a means to measure motor and pain activity across the central nervous system. BOLD signal, especially in spinal cord, usually suffers from poor signal-to-noise ratio (SNR) which can cause difficulty in detecting activation. Here, we demonstrate that multiecho acquisition improves spinal cord BOLD detection.Introduction:
Functional activation within brain has been studied extensively using fMRI. But limiting investigation to only the brain provides a truncated view of the human central nervous system as it does not capture information exchange between brain and body periphery through spinal cord. Simultaneous brain-spinal cord fMRI provides a means to measure motor and pain activity across the central nervous system. [1]-[4] BOLD signal, especially in spinal cord, usually suffers from poor signal-to-noise ratio (SNR) which can cause difficulty in detecting activation. Here, we demonstrate that multiecho acquisition improves spinal cord BOLD detection.Methods:
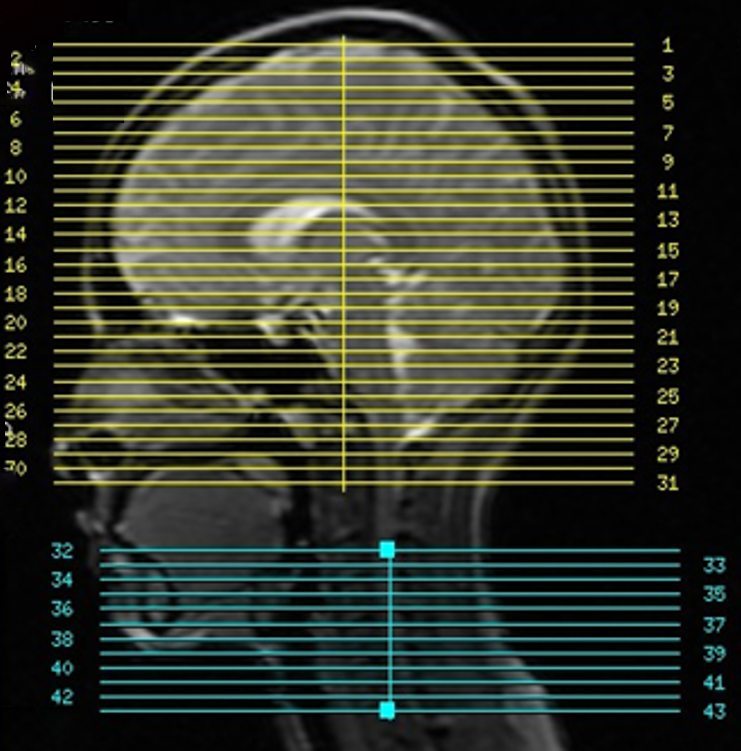
Using a dynamic shimming procedure previously reported [4], multiecho scans were collected at a GE 3T Discovery 750 scanner via 16-channel head & neck coil. fMRI sequence parameters: EPI GRAPPA (R=2) [5], # echoes=3, FOV for brain/spinal cord = 22cm/8cm, matrix size=64x64, TEs=15.3/36.3/57.4ms, TR=3.75s, partial Fourier factor=15/16, #slices=43 (31 brain/12 spine centered at C5), #volumes=80, slice thickness/spacing=5/0mm. (Figure 1) A block design of 15s on/off sensory motor task was implemented. During on-blocks, subject was instructed to focus on a flashing checker board and tap right thumb against four fingers individually and sequentially. During off-blocks, subject did not perform any task and focused only on a fixation cross. Physiological data was collected by respiratory belt and pulse oximeter.Data analysis: Physiological noise is removed from brain and spinal cord images by RETROICOR [6], followed by slice timing and motion correction. The three echo images were combined for optimal contrast using weights specified in [7] then transformed to standard space (MNI152 brain template, PAM50 spine template) before spatially smoothed (5×5×5mm for brain, 2×2×5mm for spine).
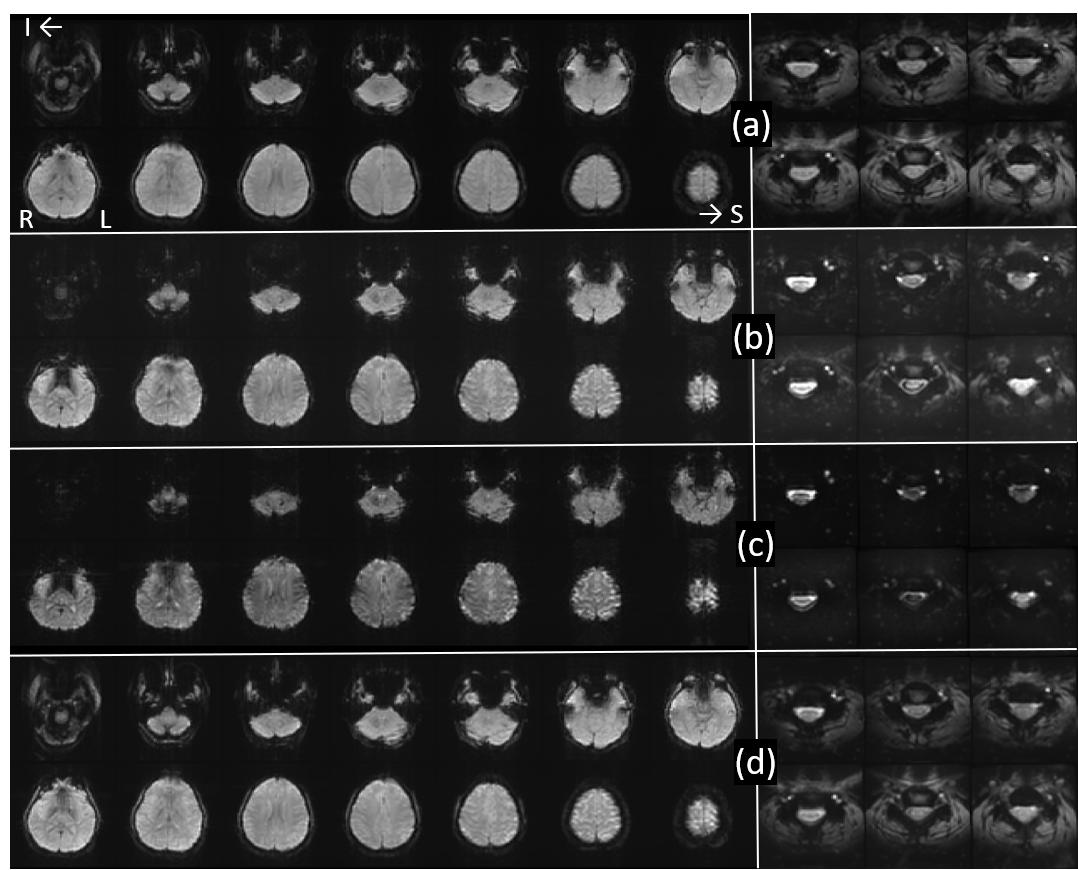
General Linear Model analysis for optimally-combined multiecho images was then performed under FSL FEAT [8]. Temporally averaged brain and spinal cord images, from each echo, and optimally combined images are displayed in Figure 2. Second-echo image is closest to optimal echo time. To compare optimally-combined multiecho images (Fig.2d) to second-echo images (Fig.2b, TE=36.3ms), the second-echo images were subject to the same FEAT analysis.
Results and Discussion:
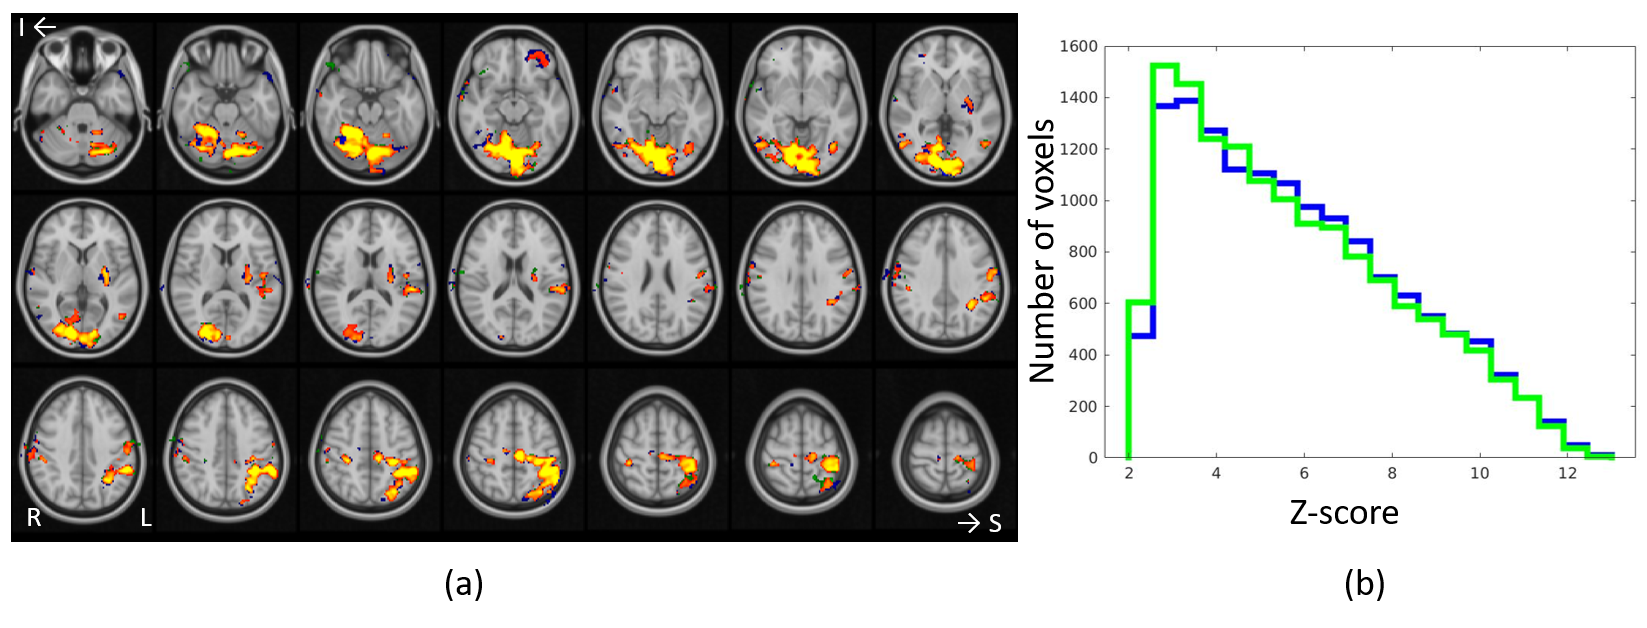
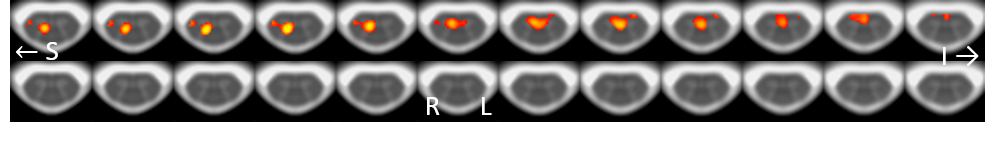
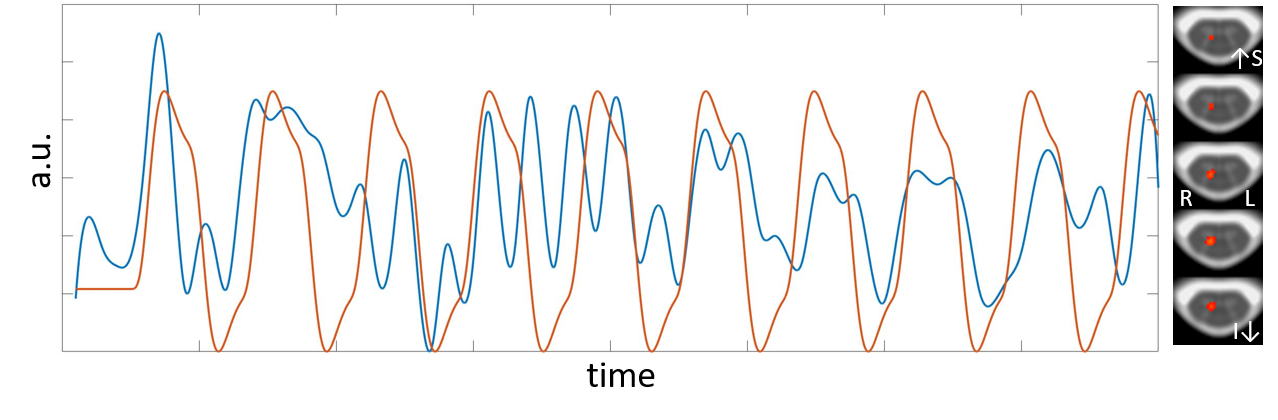
In brain, the optimally-combined multiecho activation is very similar to that from the second-echo images in Fig.3a because almost all activation voxels are common to both datasets. Among voxels commonly activated (Z>2.3), Z scores from the optimally-combined multiecho are slightly higher (Fig.3b). In spinal cord, on the other hand, optimally-combined multiecho induces significantly greater activation than that using second-echo (Fig.4). At threshold Z>2.3 and cluster threshold P=0.05, activation localized within ipsilateral spinal cord segment level C6 is readily observed from optimally-combined multiecho data. This activation corresponds to right thumb. [9] No activation was observed from second-echo spinal cord data even for threshold lowered to Z>1.6. This conclusion is further supported by a second dataset from the same participant at TE=32.9ms and partial Fourier factor=21/32.Figure 5 shows optimally-combined multiecho spinal cord time-course averaged over region-of-interest; defined as activation Z>3.1 within spinal segment C6, lowpass filtered with cutoff 0.1Hz. This spinal cord time-course closely follows the experiment design.
Conclusion:
Spinal cord fMRI data is generally noisier than brain data due to smaller voxel size, smaller anatomy, higher physiological noise sensitivity, and severely inhomogeneous magnetic field. The multiecho technique presented herein allows BOLD activation detection where single echo acquisition may falter. Although multiecho brain fMRI has been proven useful for improving BOLD sensitivity [10]-[11], this is the first study (to our knowledge) demonstrating distinct advantage of multiecho in spinal cord.Moving forward, this multiecho technique may be improved by optimizing echo time by further reducing readout duration; perhaps by increasing GRAPPA acceleration or decreasing partial Fourier factor.
Acknowledgements
R01 NS109450References
1. Cahill CM, Stroman PW. Mapping of neural activity produced by thermal pain in the healthy human spinal cord and brainstem: a functional magnetic resonance imaging study. Magnetic Resonance Imaging 2011 Apr;29(3):342–352.
2. Nash P, Wiley K, Brown J, Shinaman R, Ludlow D, Sawyer AM, et al. Functional magnetic resonance imaging identifies somatotopic organization of nociception in the human spinal cord. Pain 2013 Jun;154(6):776–781.
3. Thorpe JW, Moseley IF, Hawkes CH, MacManus DG, McDonald WI, Miller DH. Brain and spinal cord MRI in motor neuron disease. Journal of Neurology, Neurosurgery, and Psychiatry 1996 Sep;61(3):314–317.
4. Islam H, Law CSW, Weber KA, Mackey SC, Glover GH. Dynamic per slice shimming for simultaneous brain and spinal cord fMRI. Magn Reson Med. 2019 Feb;81(2):825-838.
5. Griswold MA, Jakob PM, Heidemann RM, Nittka M, Jellus V, Wang J, et al. Generalized autocalibrating partially parallel acquisitions (GRAPPA). Magnetic Resonance in Medicine 2002 Jun;47(6):1202–1210.
6. Glover GH, Li TQ, Ress D. Image-based method for retrospective correction of physiological motion effects in fMRI: RETROICOR. Magnetic Resonance in Medicine 2000 Jul;44(1):162–167.
7. Posse S, Wiese S, Gembris D, Mathiak K, Kessler C, Grosse-Ruyken ML, Elghahwagi B, Richards T, Dager SR, Kiselev VG. Enhancement of BOLD-contrast sensitivity by single-shot multi-echo functional MR imaging. Magn Reson Med 1999;42(1):87-97.
8. Smith SM, Jenkinson M, Woolrich MW, Beckmann CF, Behrens TE, Johansen-Berg H, Bannister PR, De Luca M, Drobnjak I, Flitney DE and others. Advances in functional and structural MR image analysis and implementation as FSL. Neuroimage 2004;23 Suppl 1:S208-19.
9. Kirshblum SC, Burns SP, Biering-Sorensen F, Donovan W, Graves DE, Jha A, Johansen M, Jones L, Krassioukov A, Mulcahey MJ, Schmidt-Read M, Waring W. International standards for neurological classification of spinal cord injury (revised 2011). J Spinal Cord Med. 2011 Nov;34(6):535-46.
10. Kundu P, Voon V, Balchandani P, Lombardo MV, Poser BA, Bandettini PA. Multi-echo fMRI: A review of applications in fMRI denoising and analysis of BOLD signals. Neuroimage. 2017 Jul 1;154:59-80.
11. Gonzalez-Castillo J, Panwar P, Buchanan LC, Caballero-Gaudes C, Handwerker DA, Jangraw DC, Zachariou V, Inati S, Roopchansingh V, Derbyshire JA, Bandettini PA. Evaluation of multi-echo ICA denoising for task based fMRI studies: Block designs, rapid event-related designs, and cardiac-gated fMRI. Neuroimage. 2016 Nov 1;141:452-468.
Figures