2533
Preliminary Functional Quantitative Susceptibility Mapping with Multi-Echo EPI
Jannette Nassar1, Oliver C. Kiersnowski1, Patrick Fuchs1, and Karin Shmueli1
1Medical Physics and Biomedical Engineering, University College London, London, United Kingdom
1Medical Physics and Biomedical Engineering, University College London, London, United Kingdom
Synopsis
Keywords: Data Analysis, Brain, Quantitative Susceptiblity Mapping, fQSM, fMRI
Functional QSM (fQSM) detects changes in blood oxygenation in response to neuronal activation, providing complementary information to conventional magnitude-based fMRI. For standard structural gradient-echo QSM, multi-echo (ME) acquisitions are more accurate than single-echoes. Preliminary work suggests this holds for ME-EPI. Previous fQSM studies used single-echo EPI with physiological noise correction but with ME-EPI, we observed fQSM activations in the visual cortex with a visual stimulus without physiological noise correction. ME and single-echo EPI fQSM were compared, showing that ME-EPI might be preferable. fQSM activations were weaker (maximum T-score=4 compared to 10 in fMRI) and more localised than fMRI, as expected.Introduction
Functional quantitative susceptibility mapping (fQSM) provides complementary information to conventional magnitude-based BOLD fMRI, showing potential to improve spatial localisation of neuronal activity1,2. This is because QSM reveals the blood susceptibility changes that underlie magnitude signal changes in the BOLD model of functional activation. fQSM is also based on the linear dependence of susceptibility on blood oxygenation3 rather than the non-linear dependence of the T2*-weighted signal magnitude on blood oxygenation4. Using multiple echoes provides more accurate QSM than single echo acquisitions for conventional 3D gradient-echo acquisitions5–7. Preliminary work suggests this holds for multi-echo EPI8. Further, there is increasing evidence that combining images from multiple echoes recovers signal drop-out and considerably increases fMRI sensitivity compared to conventional single-echo EPI9–11. Therefore, in this preliminary study, we investigated multi-echo EPI for fQSM and compared it to fQSM at each echo as all published fQSM studies, e.g.1,2,12,13, have used single-echo EPI. We also investigated the effect of the size of the smoothing kernel on fQSM activations.Methods
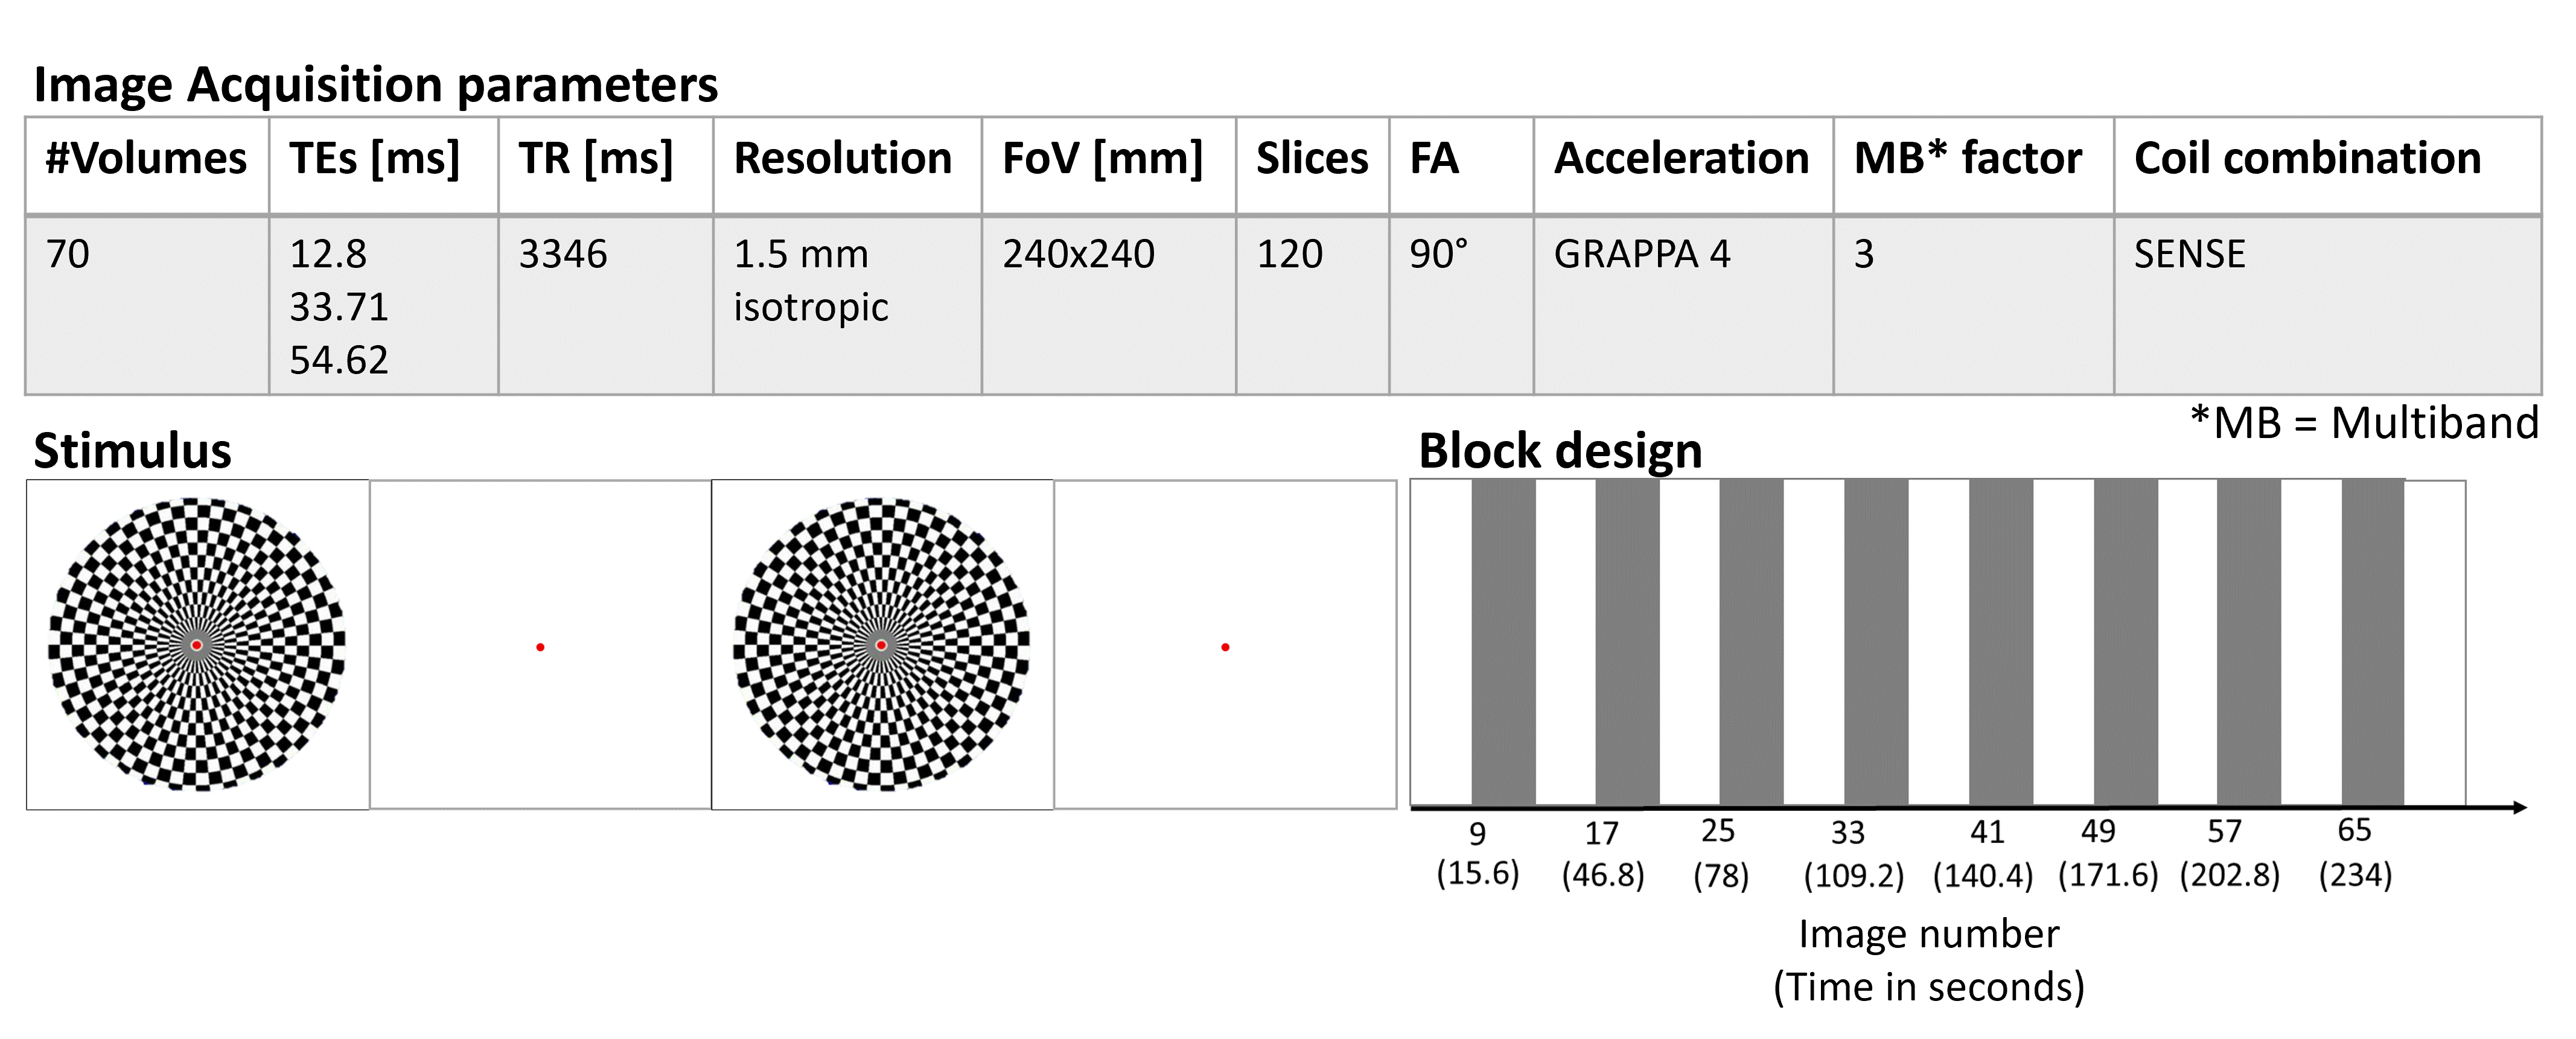
Image acquisition: 70 volumes of multi-echo GRE EPI were acquired in a healthy male volunteer (30 years old) on a 3T Siemens-Prisma using a 64-channel head coil with the parameters shown in Figure 1. Structural T1-weighted images were acquired for anatomical reference. fMRI stimulus: A standard visual stimulation paradigm was used to maximise the BOLD signal with a conventional block design shown in Figure 1.Data processing: For all multi-echo processing brain masks were calculated using FSL BET14 on the magnitude images from the second echo. For single-echo fQSM, BET masks were calculated on the magnitude image at each echo. For all analyses, transformations from the combined-magnitude timeseries registrations (1, below) were applied to the masks at each volume. All masks were eroded by a single voxel.
For the magnitude-based fMRI analysis, the multi-echo magnitude images were combined using T2*-weighted echo summation15. Quantitative susceptibility maps (QSM) were calculated from the phase images at each timepoint of the fMRI time-series: the total field map was calculated using a non-linear fit of the complex data16 plus Laplacian unwrapping17; intra-slice background fields were removed with 2D V-SHARP18 followed by 3D-PDF19 to remove inter-slice fields20 and susceptibility maps were calculated using non-linear total variation regularisation (FANSI, a = 2x10⁻⁴)21.
SPM1222,23 was used for fMRI and fQSM processing. Spatial pre-processing performed on both the combined magnitude images and the QSM included: (1) rigid-body realignment of the magnitude images to the first image in the time-series to correct for motion. The resulting transformations were then applied to the corresponding susceptibility maps (and masks). (2) spatial smoothing with an 8 mm FWHM Gaussian kernel to improve SNR and increase statistical power24. We investigated the effect of the FWHM (0, 2, 4, 6, 8 mm) of this kernel on the fQSM activation maps.
Note that, unlike previous fQSM studies, e.g.1,2, no additional physiological noise correction was performed. A general-linear model (GLM) was reconstructed with a regressor for the visual stimuli. Statistically significant changes were detected by voxel-wise t-tests. fMRI and fQSM activation maps were calculated using a threshold of p<0.001 and no FWE correction without restriction of minimum cluster size to allow individual supra-threshold voxels to be apparent.
Results and Discussion
Figure 2 shows a representative susceptibility map. Figure 3 shows fMRI and fQSM activation maps, in which activations appeared in the primary visual cortex as expected. Similar to previous fQSM studies1,2,12, the magnitude fMRI response was stronger (larger t-values) and more widespread (more activated voxels) than in the fQSM, with less noise in the timecourse (Figure 3). Despite the lack of physiological noise correction, voxels in the visual cortex show significant activation in the ME-EPI fQSM, similar to previous fQSM studies with a visual paradigm1,2. The results of fQSM for separate single echoes (Figure 4) show that the second echo (TE=33.71 ms) gave more statistically significant activations than the first echo (TE=12.8 ms), which showed no activations, and the third echo (TE=54.63 ms), which gave only one cluster. This might be because the second echo time is closest to the tissue T2* at which susceptibility contrast is maximized6. The activations in the ME-EPI fQSM (Figure 3) had fewer clusters more localized to the visual cortex than the fQSM at the second echo, suggesting that ME-EPI may provide more accurate fQSM than single-echo EPI. Figure 5 shows the effect of smoothing kernel size on fQSM activations. The FWHM=8 mm kernel was chosen as it gave the fewest clusters of activated voxels.Conclusions
Here, we showed that fQSM is feasible using multi-echo EPI, in contrast to previous fQSM studies which have used single-echo EPI. We observed fQSM activations in the visual cortex in response to a visual stimulus even without physiological noise correction that was essential in previous fQSM studies. This suggests that ME-EPI shows promise for fQSM although future work is needed to optimise physiological noise correction techniques for ME-EPI fQSM. As expected, activations in fQSM were weaker and more localised than in conventional BOLD-fMRI. It is not clear from this preliminary study whether this is due to improved spatial localisation of neuronal activity in fQSM or reflects its greater sensitivity to physiological noise.Acknowledgements
All authors except for Oliver Kiersnowski were supported by European Research Council Consolidator Grant DiSCo MRI SFN 770939.Oliver Kiersnowski was supported by the EPSRC-funded UCL Centre for Doctoral Training in Intelligent, Integrated Imaging in Healthcare (i4health)(EP/S021930/1).
References
[1] P. S. Özbay et al., “Probing neuronal activation by functional quantitative susceptibility mapping under a visual paradigm: A group level comparison with BOLD fMRI and PET,” NeuroImage, vol. 137, pp. 52–60, Aug. 2016, doi: 10.1016/j.neuroimage.2016.05.013.[2] D. Z. Balla et al., “Functional quantitative susceptibility mapping (fQSM),” NeuroImage, vol. 100, pp. 112–124, Oct. 2014, doi: 10.1016/j.neuroimage.2014.06.011.
[3] V. Jain, O. Abdulmalik, K. J. Propert, and F. W. Wehrli, “Investigating the magnetic susceptibility properties of fresh human blood for noninvasive oxygen saturation quantification,” Magn. Reson. Med., vol. 68, no. 3, pp. 863–867, 2012, doi: 10.1002/mrm.23282.
[4] J. R. Reichenbach, R. Venkatesan, D. A. Yablonskiy, M. R. Thompson, S. Lai, and E. M. Haacke, “Theory and application of static field inhomogeneity effects in gradient-echo imaging,” J. Magn. Reson. Imaging, vol. 7, no. 2, pp. 266–279, 1997, doi: 10.1002/jmri.1880070203.
[5] G. Gilbert, G. Savard, C. Bard, and G. Beaudoin, “Quantitative comparison between a multiecho sequence and a single-echo sequence for susceptibility-weighted phase imaging.,” Magn. Reson. Imaging, 2012, doi: 10.1016/j.mri.2012.02.008.
[6] B. Wu, W. Li, A. V. Avram, S.-M. Gho, and C. Liu, “Fast and tissue-optimized mapping of magnetic susceptibility and T2* with multi-echo and multi-shot spirals,” NeuroImage, vol. 59, no. 1, pp. 297–305, Jan. 2012, doi: 10.1016/j.neuroimage.2011.07.019.
[7] E. Biondetti, A. Karsa, D. L. Thomas, and K. Shmueli, “Investigating the accuracy and precision of TE-dependent versus multi-echo QSM using Laplacian-based methods at 3 T,” Magn. Reson. Med., vol. 84, no. 6, pp. 3040–3053, 2020, doi: 10.1002/mrm.28331.
[8] O. Kiersnowski, P. Fuchs, S. Wastling, M. Elgwely, J. Thornton, and K. Shmueli, “Optimising Multi-Echo and Single-Echo 2D EPI for Rapid QSM: What is the Maximum TE?,” QMR Lucca: Joint Workshop on MR phase, magnetic susceptibility and electrical properties mapping, Italy, 2022.
[9] B. A. Poser and D. G. Norris, “Investigating the benefits of multi-echo EPI for fMRI at 7 T,” NeuroImage, vol. 45, no. 4, pp. 1162–1172, May 2009, doi: 10.1016/j.neuroimage.2009.01.007.
[10] S. Posse, “Multi-echo acquisition,” NeuroImage, vol. 62, no. 2, pp. 665–671, Aug. 2012, doi: 10.1016/j.neuroimage.2011.10.057.
[11] P. Kundu et al., “Integrated strategy for improving functional connectivity mapping using multiecho fMRI,” Proc. Natl. Acad. Sci. U. S. A., vol. 110, no. 40, pp. 16187–16192, Oct. 2013, doi: 10.1073/pnas.1301725110.
[12] H. Sun, P. Seres, and A. h. Wilman, “Structural and functional quantitative susceptibility mapping from standard fMRI studies,” NMR Biomed., vol. 30, no. 4, p. e3619, 2017, doi: 10.1002/nbm.3619.
[13] Z. Chen and V. D. Calhoun, “Task-evoked brain functional magnetic susceptibility mapping by independent component analysis (ϿICA),” J. Neurosci. Methods, vol. 261, pp. 161–171, Mar. 2016, doi: 10.1016/j.jneumeth.2016.01.007.
[14] S. M. Smith, “Fast robust automated brain extraction,” Hum. Brain Mapp., vol. 17, no. 3, pp. 143–155, Nov. 2002, doi: 10.1002/hbm.10062.
[15] B. A. Poser, M. J. Versluis, J. M. Hoogduin, and D. G. Norris, “BOLD contrast sensitivity enhancement and artifact reduction with multiecho EPI: Parallel-acquired inhomogeneity-desensitized fMRI,” Magn. Reson. Med., vol. 55, no. 6, pp. 1227–1235, 2006, doi: 10.1002/mrm.20900.
[16] T. Liu, C. Wisnieff, M. Lou, W. Chen, P. Spincemaille, and Y. Wang, “Nonlinear formulation of the magnetic field to source relationship for robust quantitative susceptibility mapping,” Magn. Reson. Med., 2013, doi: 10.1002/mrm.24272.
[17] M. A. Schofield and Y. Zhu, “Fast phase unwrapping algorithm for interferometric applications,” Opt. Lett., vol. 28, no. 14, pp. 1194–1196, Jul. 2003, doi: 10.1364/ol.28.001194.
[18] W. Li, B. Wu, and C. Liu, “Quantitative susceptibility mapping of human brain reflects spatial variation in tissue composition,” NeuroImage, vol. 55, no. 4, pp. 1645–1656, Apr. 2011, doi: 10.1016/j.neuroimage.2010.11.088.
[19] T. Liu et al., “A novel background field removal method for MRI using projection onto dipole fields (PDF),” NMR Biomed., vol. 24, no. 9, pp. 1129–1136, Nov. 2011, doi: 10.1002/nbm.1670.
[20] H. Wei, Y. Zhang, E. Gibbs, N. K. Chen, N. Wang, and C. Liu, “Joint 2D and 3D phase processing for quantitative susceptibility mapping: application to 2D echo-planar imaging,” NMR Biomed., vol. 30, no. 4, Apr. 2017, doi: 10.1002/nbm.3501.
[21] “Fast nonlinear susceptibility inversion with variational regularization - Milovic - 2018 - Magnetic Resonance in Medicine - Wiley Online Library.” https://onlinelibrary.wiley.com/doi/10.1002/mrm.27073 (accessed Nov. 07, 2022).
[22] K. J. Friston, A. P. Holmes, K. J. Worsley, J.-P. Poline, C. D. Frith, and R. S. J. Frackowiak, “Statistical parametric maps in functional imaging: A general linear approach,” Hum. Brain Mapp., vol. 2, no. 4, pp. 189–210, 1994, doi: 10.1002/hbm.460020402.
[23] J. Ashburner, “SPM: A history,” NeuroImage, vol. 62, no. 2, pp. 791–800, Aug. 2012, doi: 10.1016/j.neuroimage.2011.10.025.
[24] M. K. Chung, “Gaussian kernel smoothing.” arXiv, Nov. 29, 2021. doi: 10.48550/arXiv.2007.09539.
Figures
Figure
1. Image
Acquisition and fMRI Stimulus Protocols: A checkerboard stimulus flickering at 8 Hz was
displayed for 15.6 s followed by a 15.6 s rest block of a fixation dot. The
blocks were alternated throughout the ME-EPI acquisition of 70 volumes. The
subject was instructed to fixate on a cross in the centre of the screen. The
first 5 volumes were discarded before further analysis.
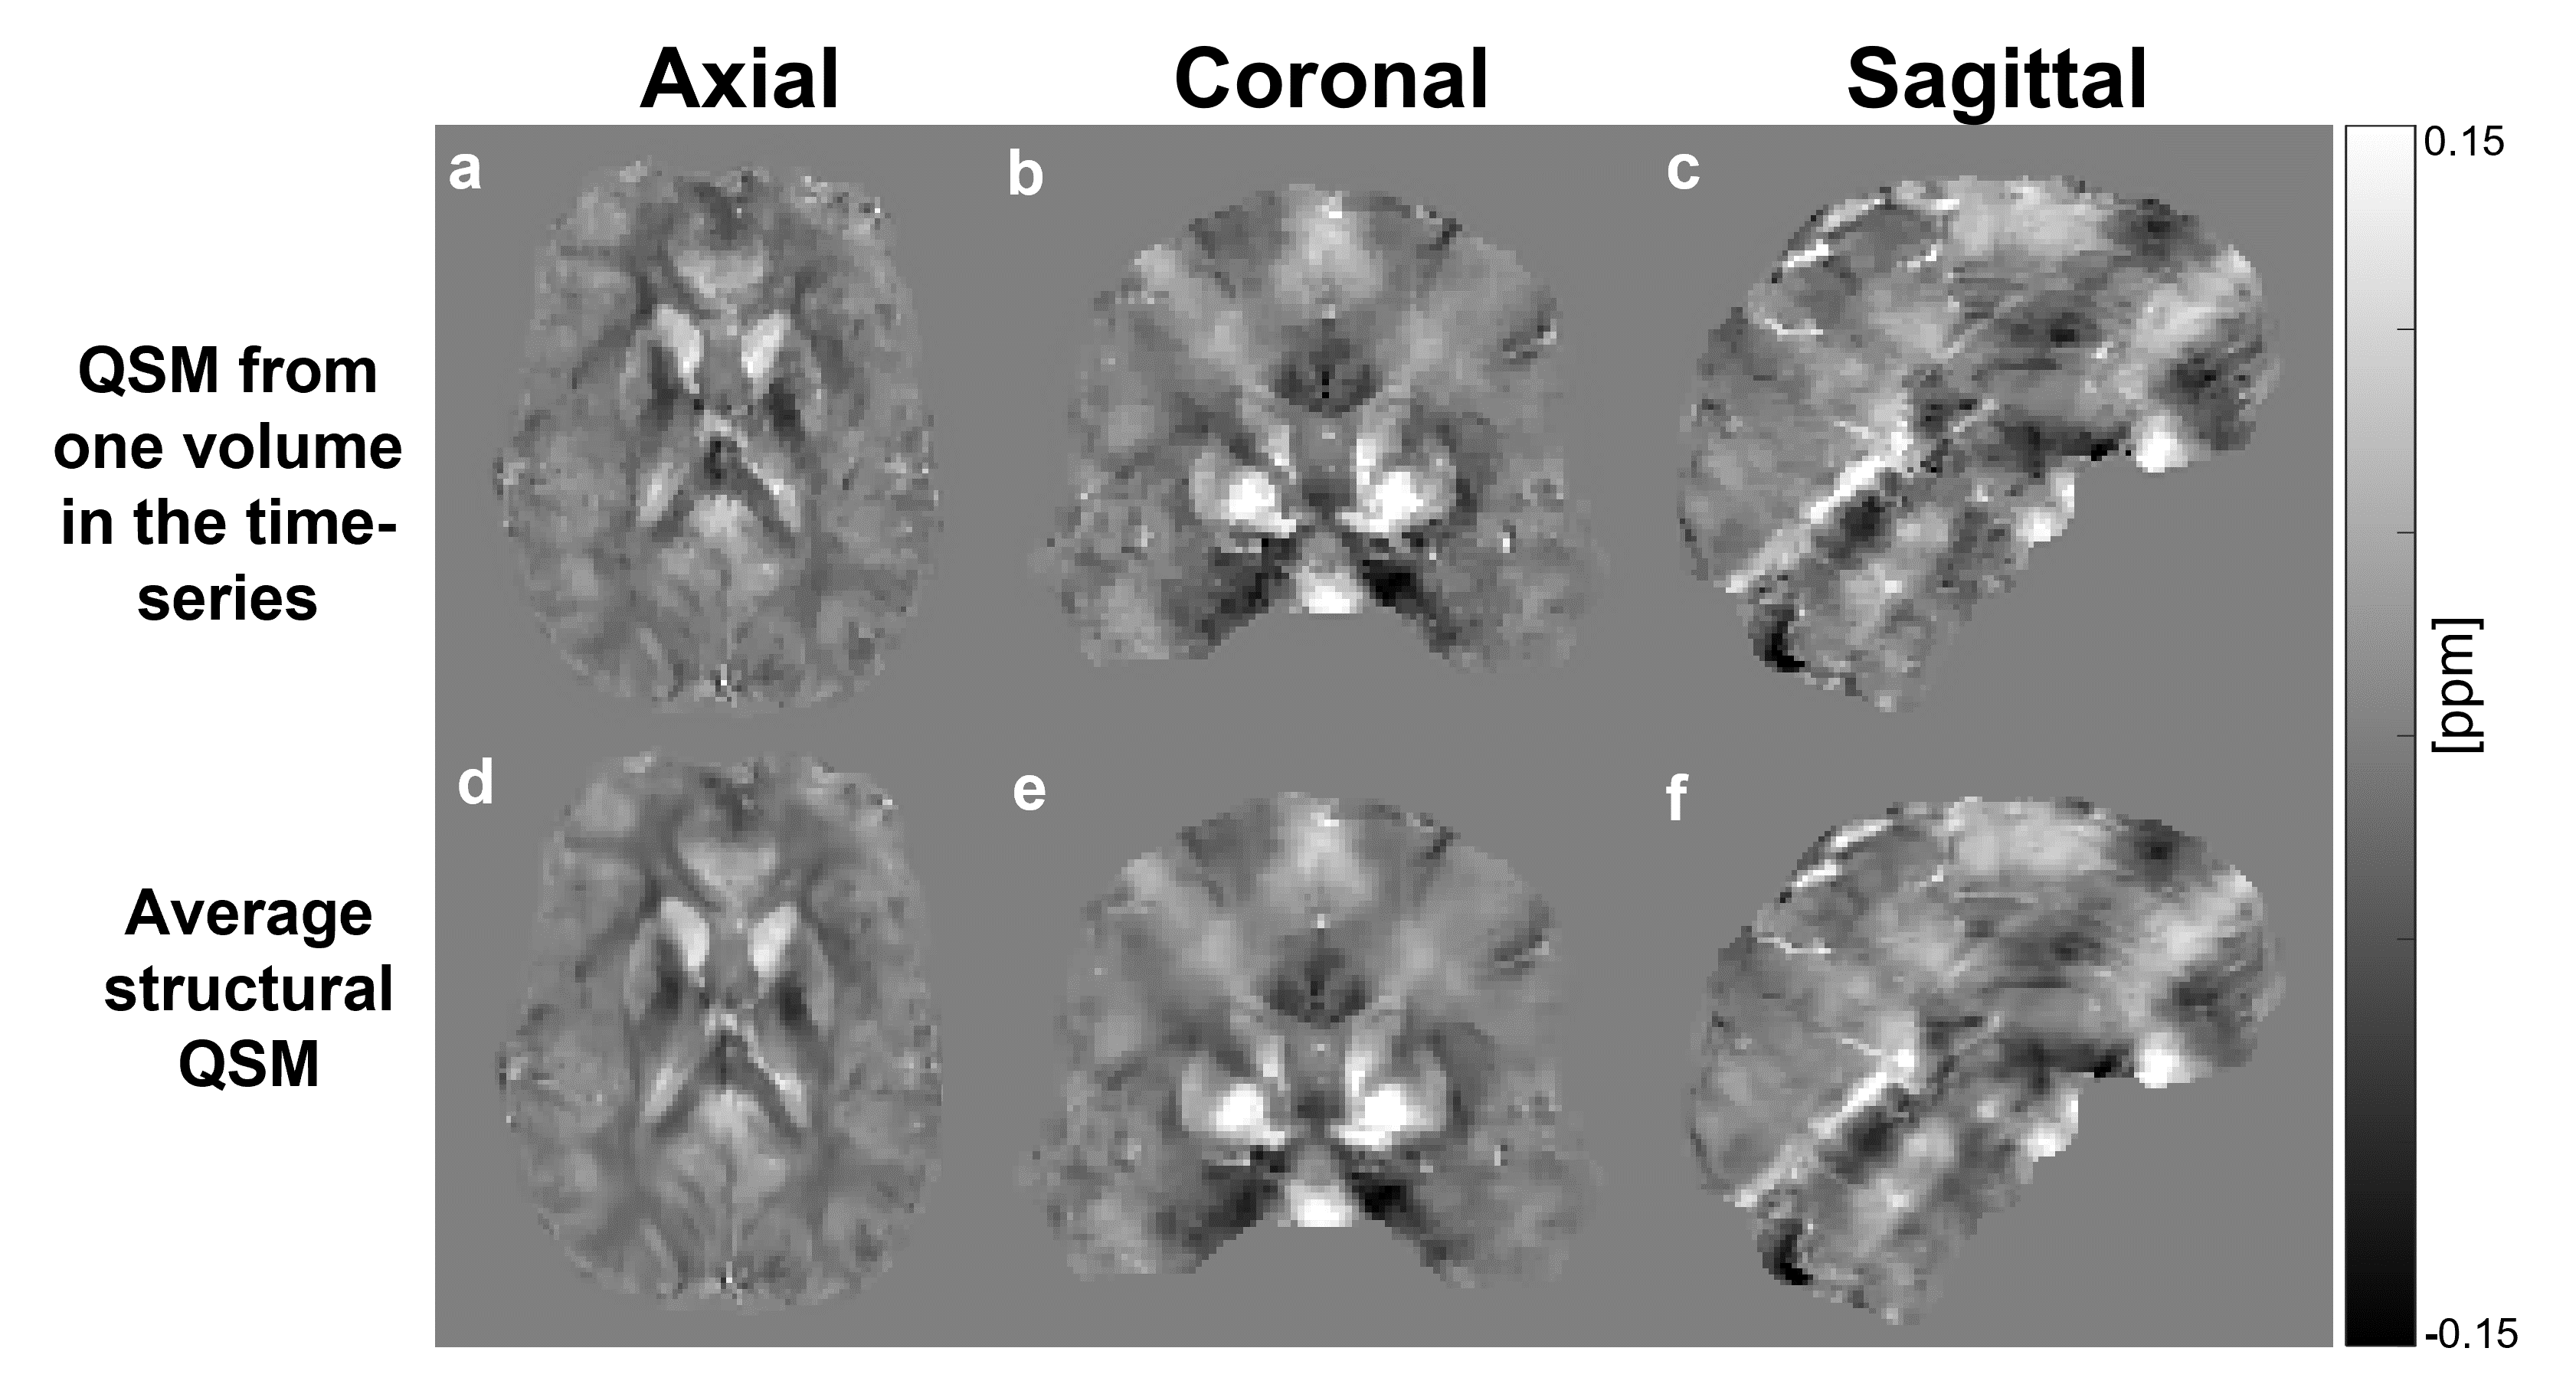
Figure 2. Representative QSM from the 13th volume (a, b, c)
and the structural QSM (d, e, f) obtained by averaging the coregistered susceptibility
maps across all the volumes in the time series.
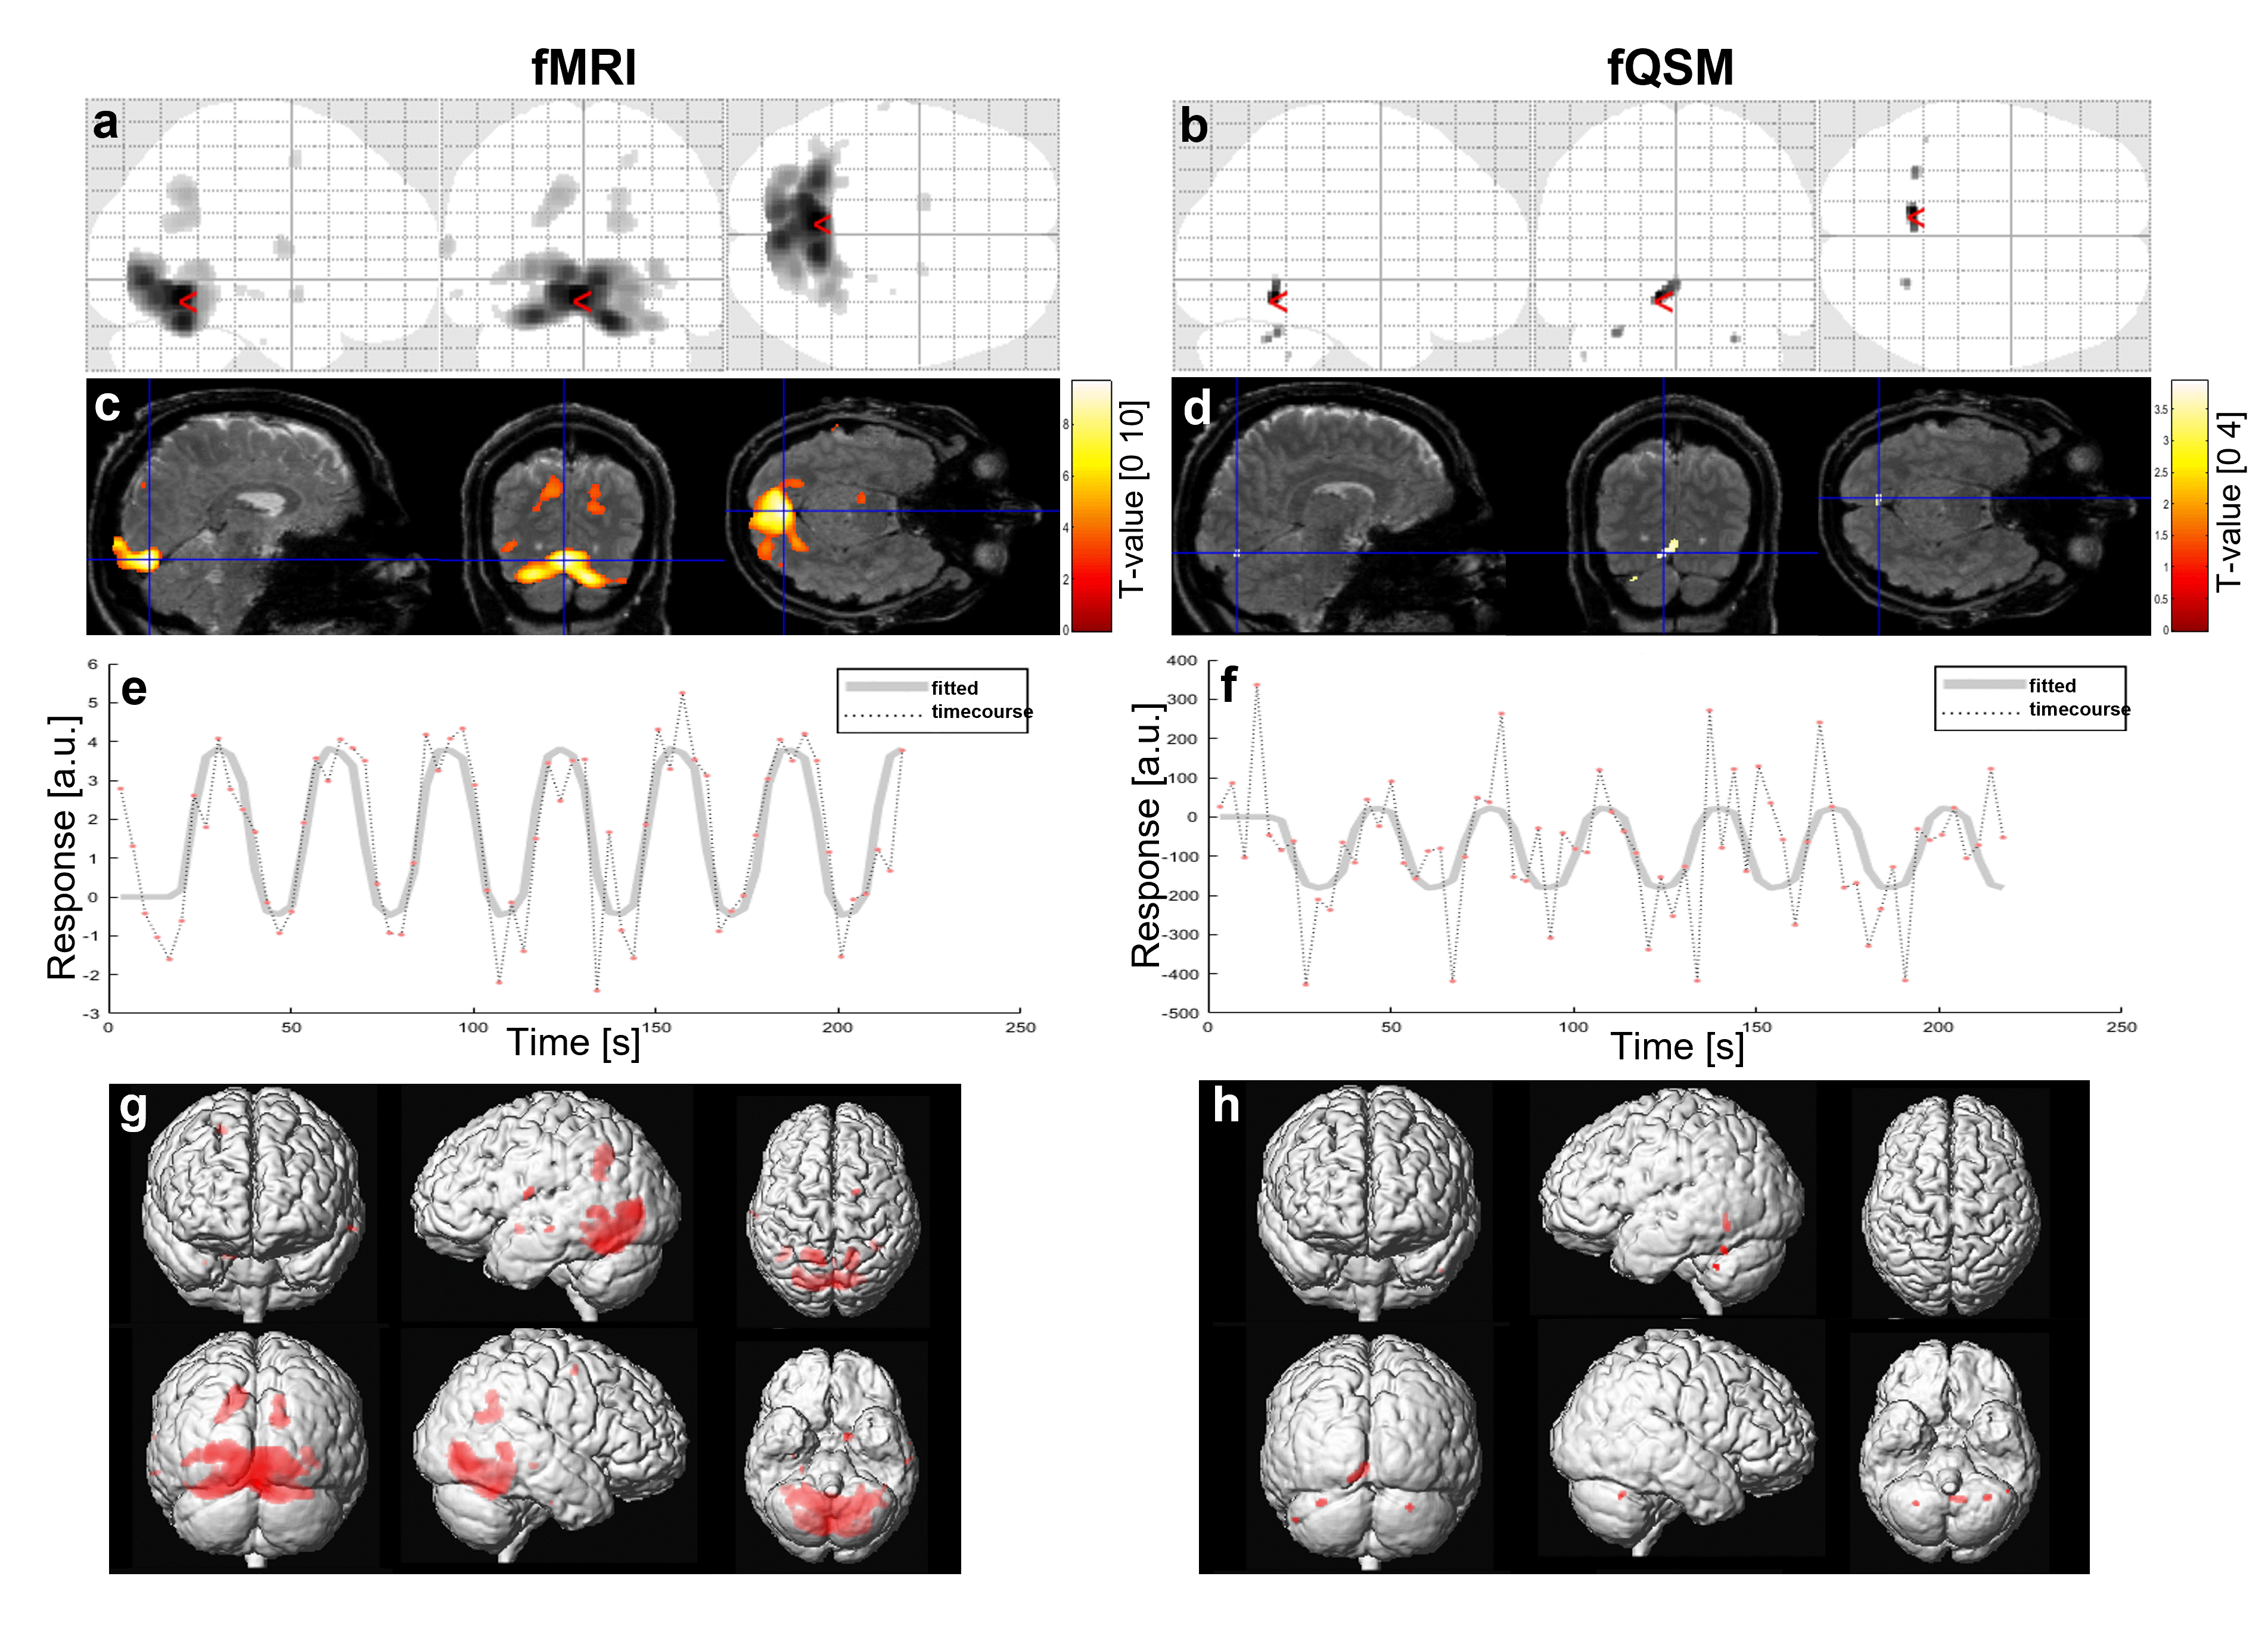
Figure 3. fMRI (a, c, e, g) and fQSM (b, d, f, h) Activations: activated voxels (threshold = p<0.001) are shown on a glass brain
(a,b) and a surface rendering of the brain (g,h). Activated voxels are
overlayed on the combined-echo magnitude images
from the first timepoint (c,d). Note the higher t-value range in c than d. The
time course and fitted response of the voxels with the maximum response marked
in (c) and (d) are denoted by the dotted line and the solid line in (e) and
(f), respectively.
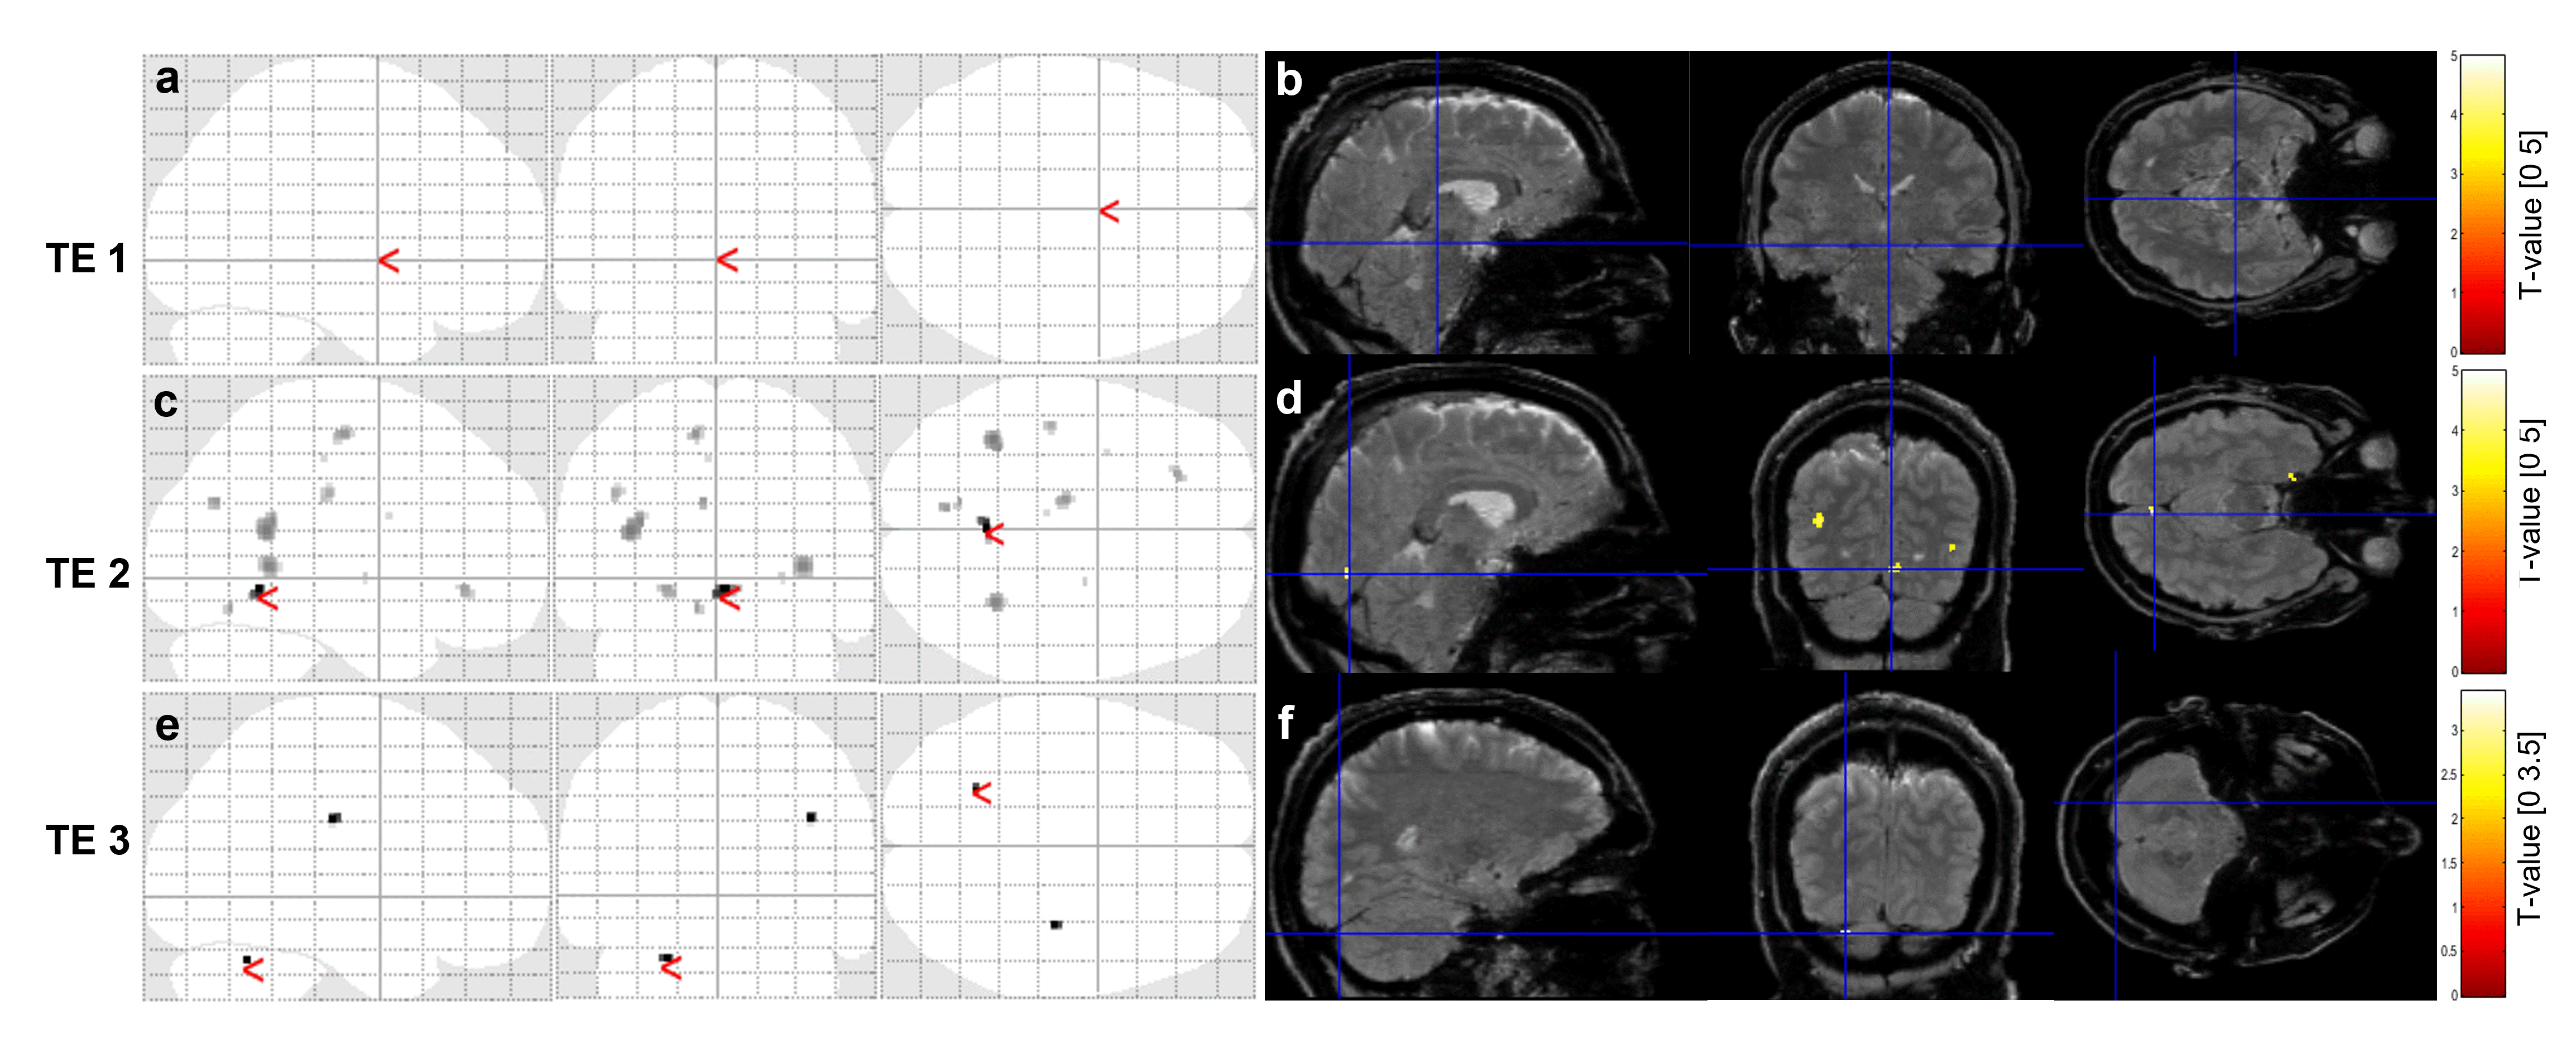
Figure 4. fQSM Activations at Each Echo of the ME-EPI QSM: Activated voxel
maps with a threshold of p<0.001 are shown in on a glass brain (a,c,e)
and overlayed on the combined-echo
magnitude image from the first volume in the time-series (b,d,f). There were no
activations present at the first echo (12.8 ms, a, b,). Activations at the
second echo (33.71 ms) are shown in (c) and (d), and those from the third echo
(54.62 ms) are shown in (e) and (f).
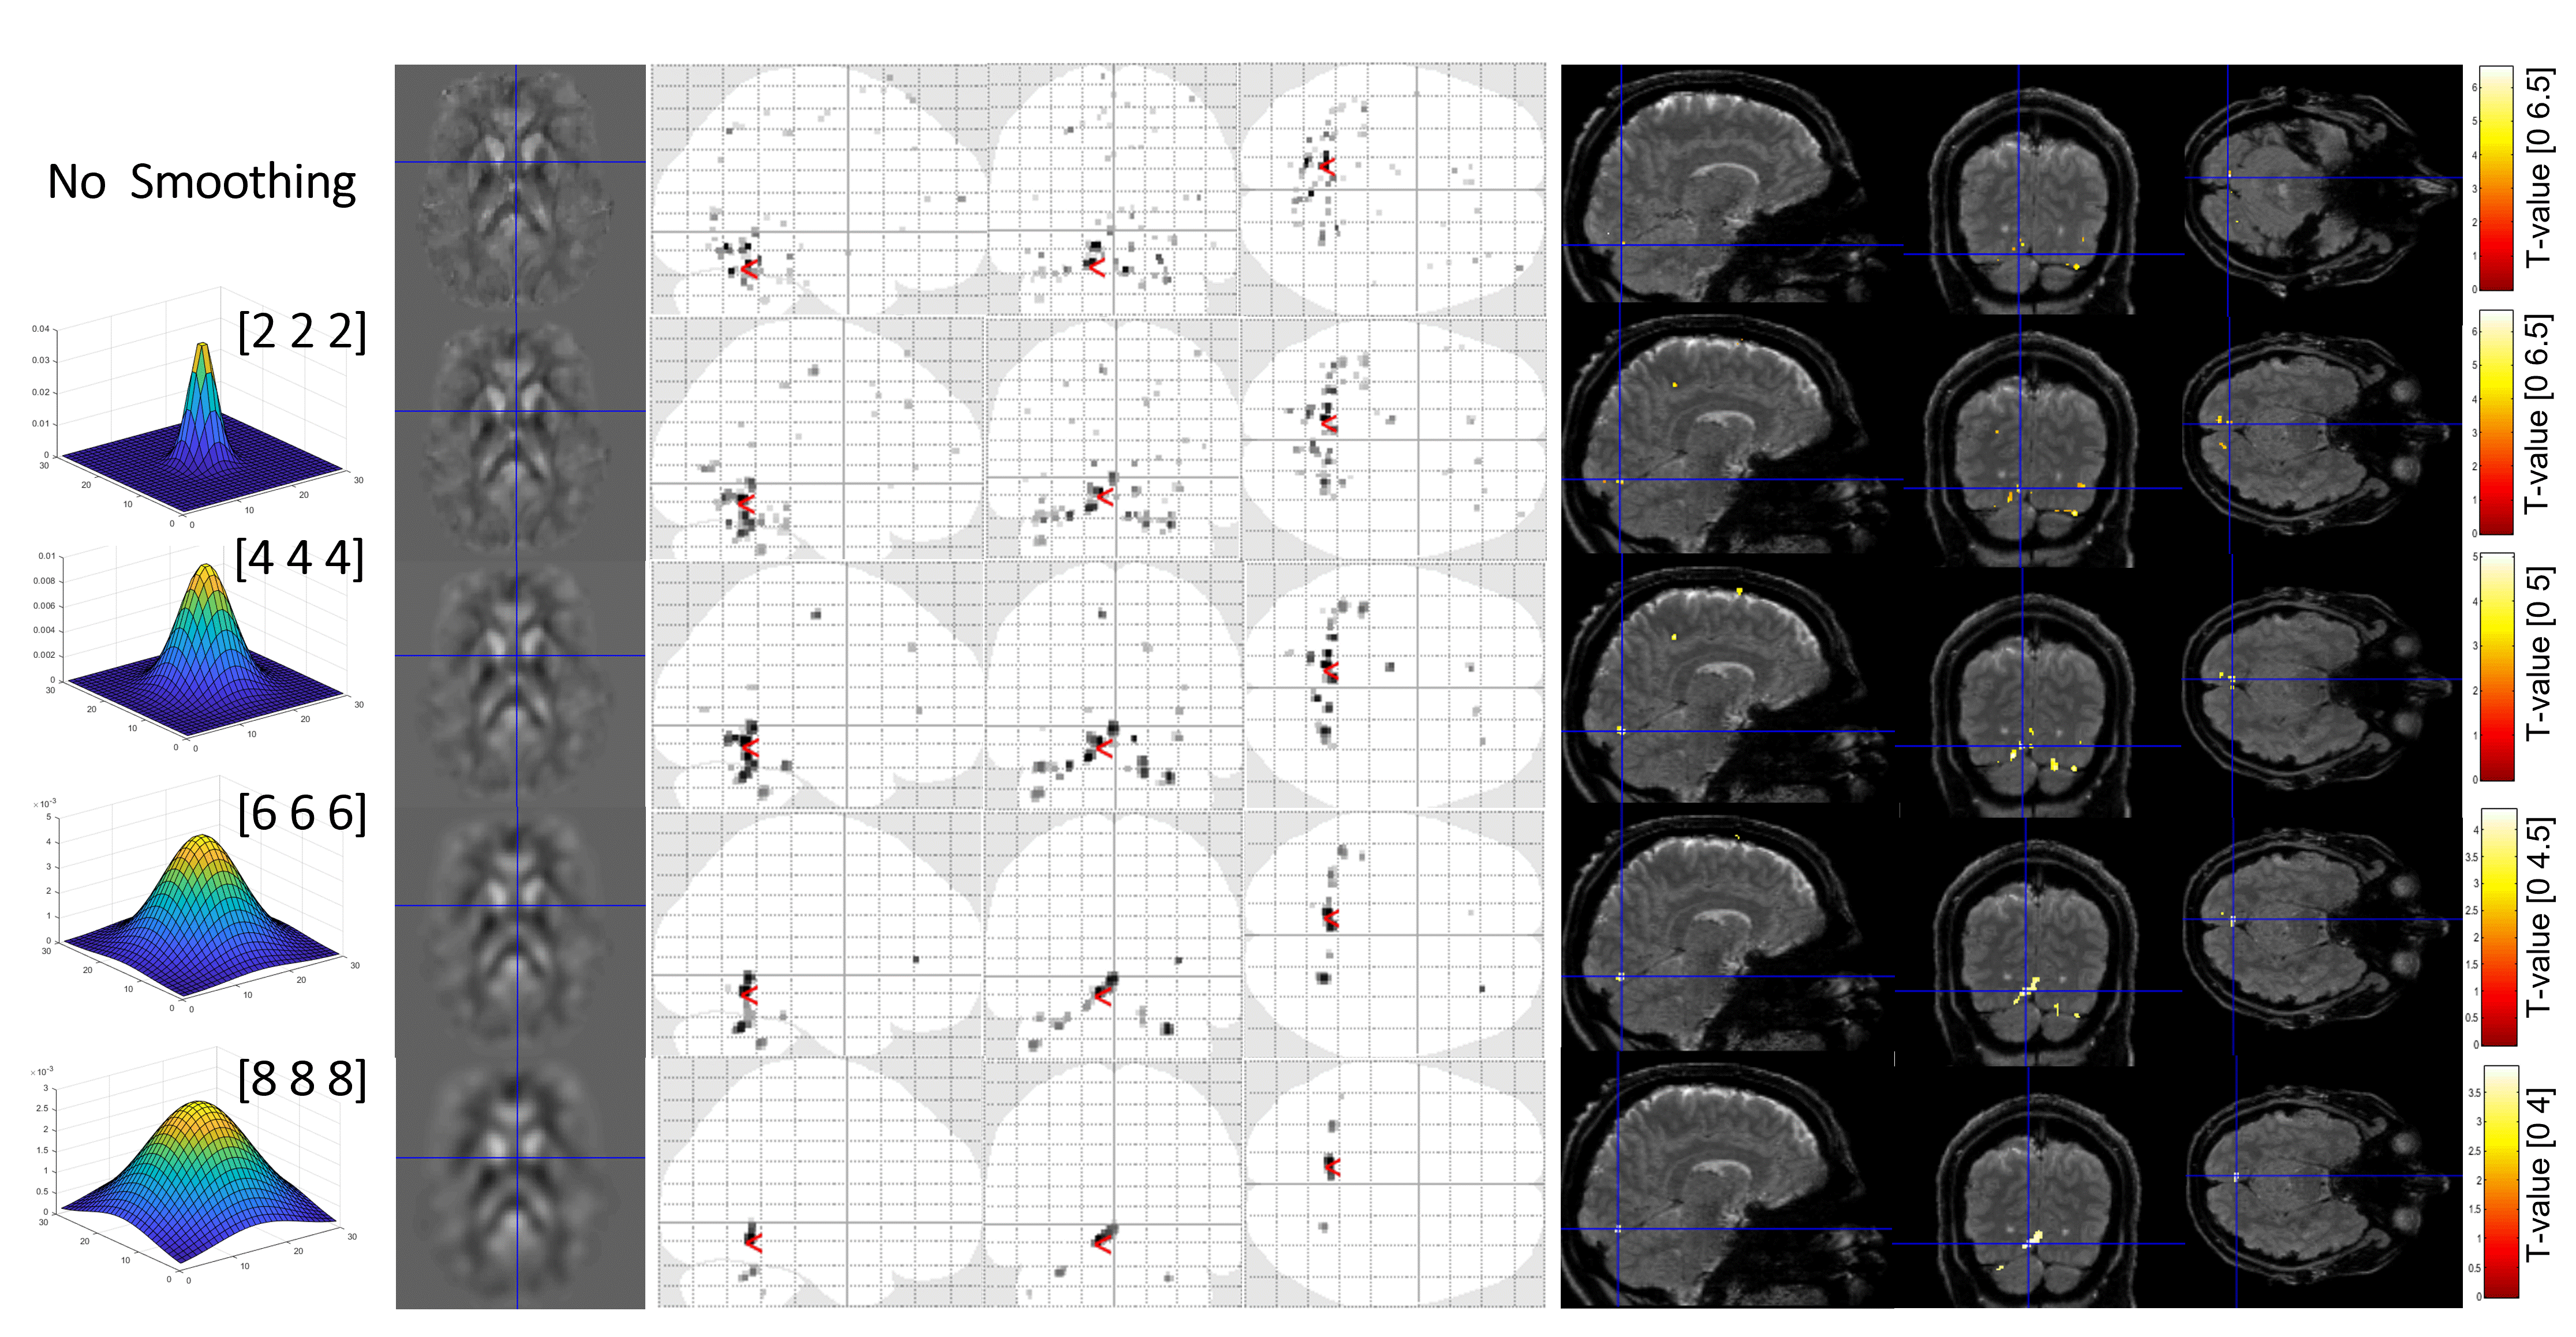
Figure 5. The effect of smoothing kernel
size on fQSM: The Gaussian
smoothing kernels [FHWM] in mm, are shown in the first column. A representative
axial slice of the smoothed susceptibility map used in the GLM is shown in the second column. fQSM
activations are shown on a glass brain in the third column and overlayed on the
combined-echo magnitude images in the fourth column.
DOI: https://doi.org/10.58530/2023/2533