2532
Harmonization of Multi-Site rs-fMRI data using CovBat1Brigham and Women's Hospital, Boston, MA, United States, 2Harvard Medical School, Boston, MA, United States, 3University of Quebec, Montreal, QC, Canada
Synopsis
Keywords: Software Tools, fMRI (resting state)
Multisite studies are an important feature of modern neuroimaging research as they allow the study of larger and more diverse populations, which is essential to obtain clinically relevant insight and sensitivity to subtle effects. However, due to the variability among scanner platforms, even when utilizing the same acquisition protocols, harmonization is needed to remove site-to-site variability in order to improve signal-to-noise ratio and improve statistical power. By implementing CovBat as a BIDS application, we have created a turnkey application that quickly minimizes confounding signals in multisite fMRI studies.Introduction
Multisite studies are an important feature of modern neuroimaging research as they allow the study of larger and more diverse populations, which is essential to obtain clinically relevant insight and sensitivity to subtle effects. However, due to the variability among scanner platforms, even when utilizing the same acquisition protocols, harmonization is needed to remove site-to-site variability in order to improve signal-to-noise ratio and improve statistical power1. Harmonization is performed as a group-level analysis following preprocessing and normalization. To achieve this, we present rs-fMRHarmonizer, which is a BIDS-compliant application for multisite harmonization of fMRI data, including resting state functional magnetic resonance imaging(rs-fMRI). The underlying harmonization scheme is based on the ComBat2 and CovBat3 algorithms. ComBat is a method for removing batch effects from genomics data which has previously been presented for harmonization of diffusion tensor imaging (DTI) images4 and magnetic resonance spectroscopy (MRS)5, showing good preservation of biological data while removing site-to-site differences in mean and variance. CovBat is an enhancement of the ComBat algorithm which further accounts for covariance in the harmonization model. In this abstract we describe the usage and features of rs-fMRIHarmonizer, which utilizes CovBat, and present validation data indicating expected harmonization behavior.Methods
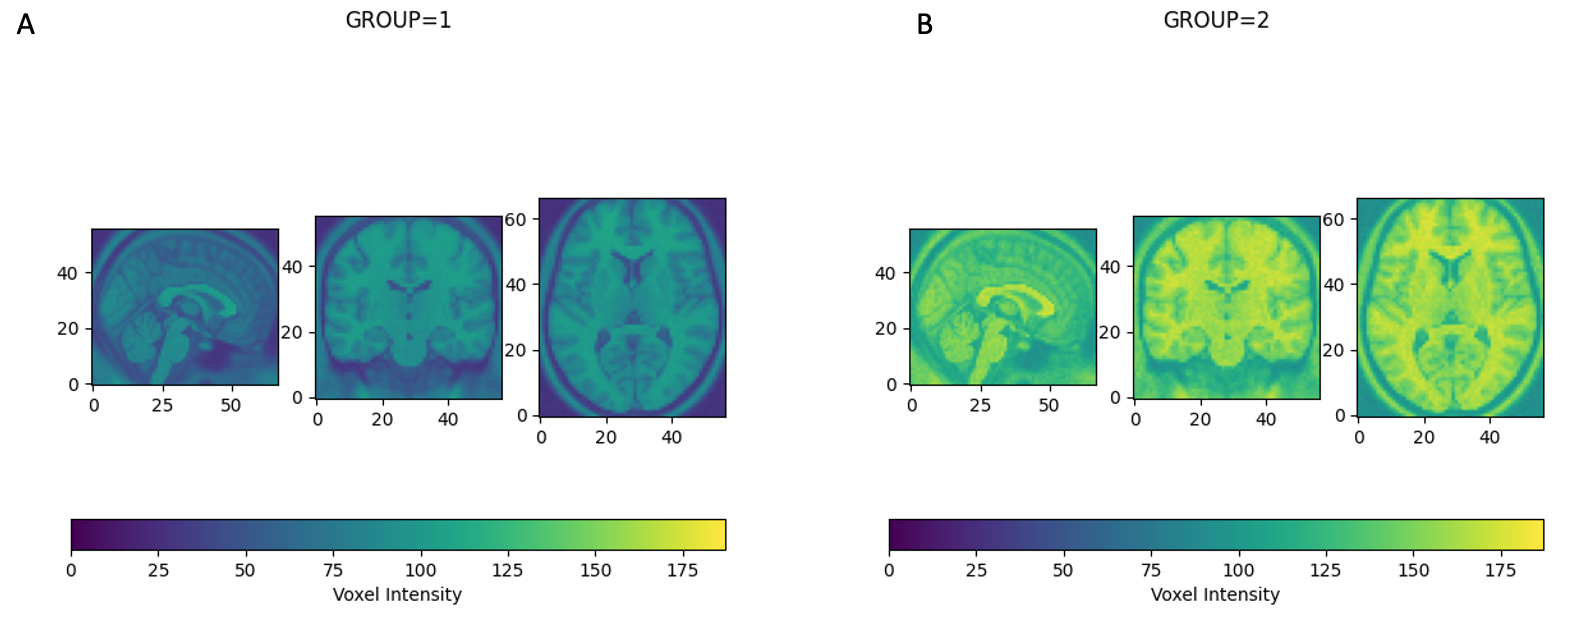
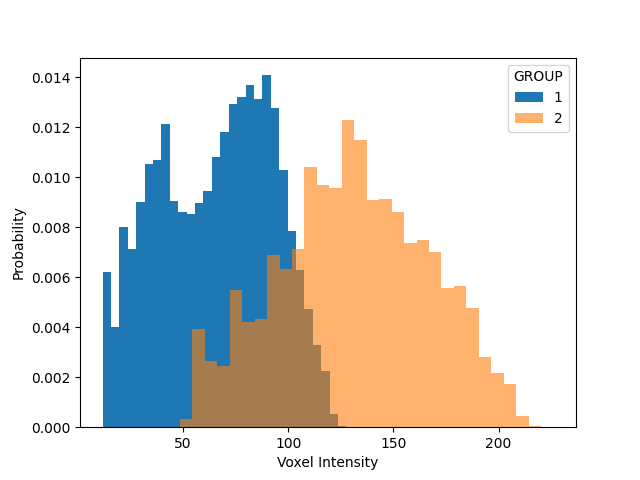
Sample Data Set: Validation data was synthesized using the MNI atlas6. To confirm harmonization, the single T2-weighted analytical image was synthetically transformed into a multisite dataset by replicating it 10 times. The 10 images were split into two group. Each group was given a different mean shift, representing site-to-site bias, and different levels of random noise were applied to each group, representing site-to-site variation in signal-to-noise ratio. After validation, harmonization was performed on multisite rs-fMRI data obtained from 260 subjects from four sites. All data was deidentified prior to analysis. All scans were all performed at 3T (Skyra, Siemens, Erlangen, Germany) using 20-channel head receiver coil at each site. Resting-state fMRI was acquired via multi-slice T2* weighted echo-planar imaging (TE/TR=30.0ms/2500ms, FA=90 degrees, 37 slices acquired interleaved with FOV of 224mm, 3.5mm slice thickness).Data Processing and Quantification: The CovBat algorithm, which works on one-dimensional datasets, is employed by flattening four-dimensional fMRI datasets into vectors, which is the reason for requiring normalization to a common atlas. Following harmonization, data are restored to four-dimensional structure and written back to a BIDS-compliant derivative directory. The overall structure of the image is retained in the two groups (Figure 1), but the voxel levels show distinct distributions (Figure 2). Harmonization was also conducted on the multisite rs-fMRI data, and homogeneity was assessed using the same statistical method.Statistical Methods: Harmonization was assessed through distribution of voxel values between groups.Results and Discussion
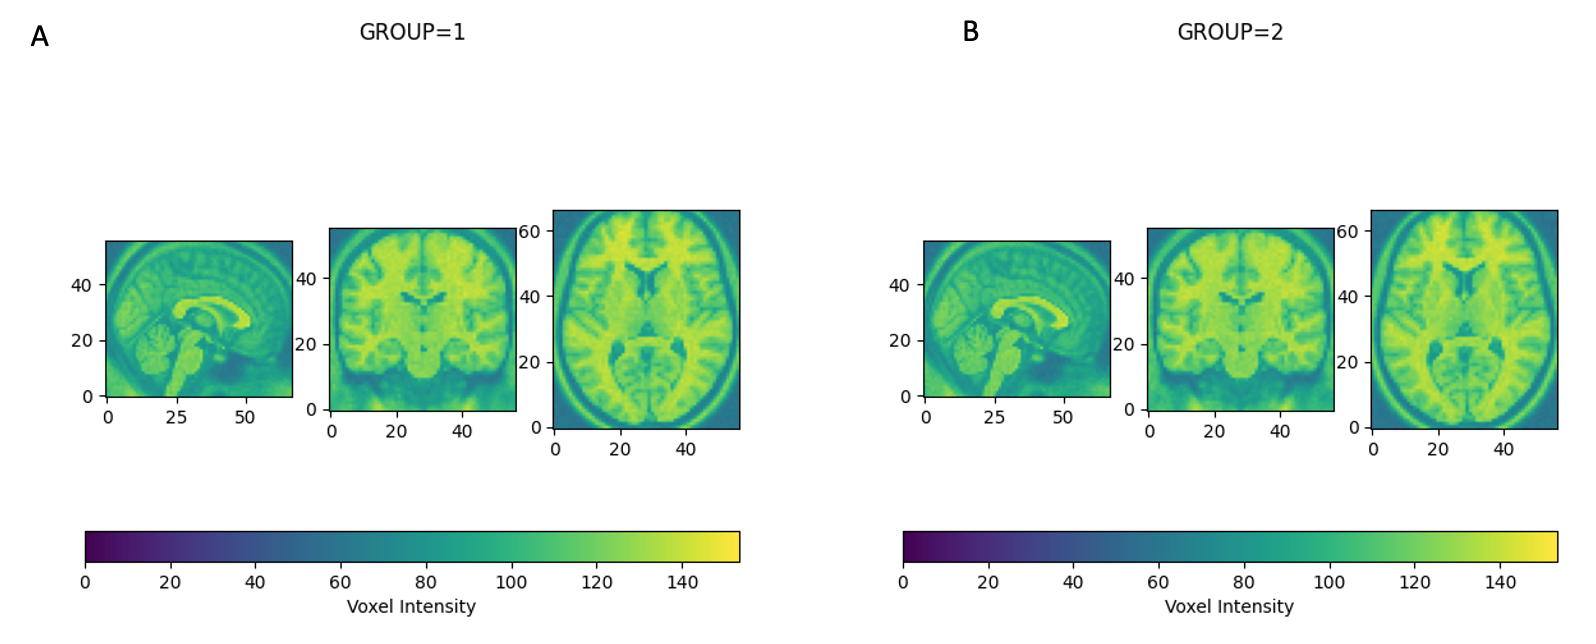
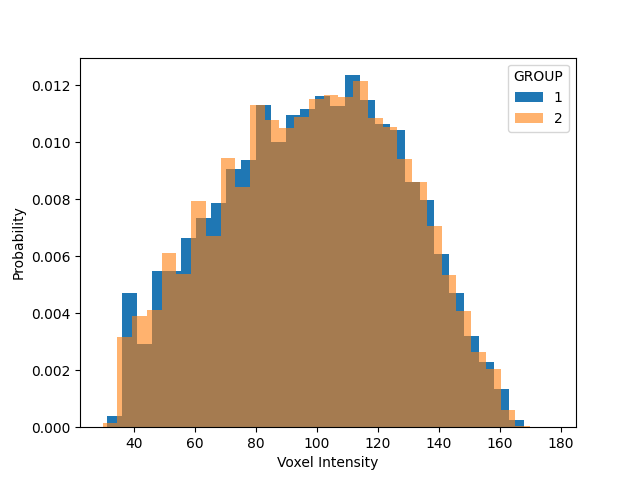
Given the synthetic construction, the mean shift and extra variance of the two groups simulates site to site variation, and a perfect harmonization would lead to two group averages which are essentially identical. Visually, the harmonization resulted in very similar group averages (Figure 3). More precisely, the histogram for both image sets closely coincide following harmonization and the two sets are no longer statistically distinguishable (t=0.357, p=0.72) (Figure 4). After validation, harmonization was found to perform well for the multisite rs-fMRI dataset.Conclusion
In conclusion, by implementing CovBat as a BIDS application, we have created a turnkey application for quickly minimizing confounding signals in multisite fMRI studies. rs-fMRHarmonizer is able to harmonize datasets so that they are no longer statistically distinguishable and will be made available publicly on a GitHub repository.Acknowledgements
No acknowledgement found.References
1. Yamashita, Ayumu, et al. Harmonization of resting-state functional MRI data across multiple imaging sites via the separation of site differences into sampling bias and measurement bias. PLoS biology 2019;17(4): e30000422.
2. Johnson, W. Evan, Cheng Li, and Ariel Rabinovic. Adjusting batch effects in microarray expression data using empirical Bayes methods. Biostatistics 2007;8(1): 118-127.3.
3. Chen, Andrew A., et al. Removal of scanner effects in covariance improves multivariate pattern analysis in neuroimaging data. bioRxiv 2020: 1-33.4.
4. Fortin, Jean-Philippe, et al. "Harmonization of multi-site diffusion tensor imaging data." Neuroimage 161 (2017): 149-170.
5. Bell TK, Godfrey KJ, Ware AL, Yeates KO, Harris AD. Harmonization of multi-site MRS data with ComBat. Neuroimage. 2022: 257.
6. Collins et al. Automatic 3-D model-based neuroanatomical segmentation. Human Brain Mapping 1995;3(3): 190-208.
Figures