2529
Cerebrospinal fluid as a zero reference regularization for functional quantitative susceptibility mapping1Graduate Institute of Biomedical Electronics and Bioinformatics, National Taiwan University, Taipei, Taiwan, 2Research Center for Brain and Consciousness, Taipei Medical University, Taipei, Taiwan, 3Imaging Center for Integrated Body, Mind and Culture Research, National Taiwan University, Taipei, Taiwan, 4Department of Electrical Engineering, National Taiwan University, Taipei, Taiwan
Synopsis
Keywords: Data Analysis, Quantitative Susceptibility mapping
Functional quantitative susceptibility mapping (fQSM) providing complementary quantitative information for fMRI, has been applied to study brain functions. However, the sensitivity of fQSM suffers from the QSM reconstruction, especially solving an ill-posed deconvolution. To improve the sensitivity of fQSM, we first applied MEDI+0 in fQSM study. This method using cerebrospinal fluid as a zero reference regularization has been proven to reduce the variability of the susceptibility maps from rescan. The higher common voxel ratio and cosine similarity scores were obtained by MEDI+0 than by MEDI. Activated voxels were successfully detected by MEDI+0 during high cognition task from standard fMRI acquisition.Introduction
Functional quantitative susceptibility mapping (fQSM1) providing complementary quantitative information for fMRI, has been applied to explore brain functions. However, the sensitivity of fQSM suffers from the QSM processing, especially solving an ill-posed deconvolution. Several methods applied to fQSM analysis, such as MEDI2 or iLSQR3, suppress the artifacts and noise in structural images, but not take temporal variability into account. In contrast, the MEDI+04,5 method using cerebrospinal fluid regularization as a zero reference provides better consistency of rescan that is potential to be used in fQSM study. The purpose of this study was to apply MEDI+0 to fQSM analysis to enhance the sensitivity during a high cognition task from standard fMRI acquisition.Materials & Methods
MRI : 2D Gradient-echo-EPI (TR = 3 s, TE = 35 ms, pixel dimensions = 2.5, 2.5 mm, FOV = 220x220, Slice thickness = 2.5 mm, Scan = 40) images of ten consenting subjects were acquired on a 3T MR system (Prisma, Seimens). T1-weighted anatomical images (3D-MPRAGE, TR= 1900 ms, TE=2.28 ms; FA = 9º,192×192×176 matrix size; 1×1×1 mm3 in-plane resolution) were acquired for each subject. Paradigm : We adopted 2-back working memory task to induce activation. Subjects encoded, temporarily stored, and continuously updated incoming stimuli to keep in the state of higher-order cognition. The 2-back task consisted of four blocks, 30 s onset duration and 36 s offset duration per block. QSM processing : Time-series EPI raw data from individual element of coil array were combined using sum-of-squared for magnitude and complex summation for phase. Brain extraction was performed on the magnitude image via brain extraction tool (BET) in FSL, then produced a brain binary mask applied to the phase images. The CSF segmentation from the T1-weighted anatomical image was performed in SPM, then produced a CSF binary mask coregistrated to the EPI image. Susceptibility map was computed as follows. First, the phase wrap-aliasing was resolved via the 2D path-based approach6. Then, the background field was removed by 2D variable kernel SHARP, followed by 3D vSHARP with different maximum radii between 2.5 and 7.5 mm7,8. Quantitative susceptibility maps were generated by dipolar-inversion using MEDI+0 with CSF as zero reference and MEDI. A constant positive susceptibility offset of 1 ppm was added to the susceptibility maps for compatibility (non-negative values only) with SPM12. Functional processing : Processing of the functional QSM datasets was performed in SPM12. Standard SPM steps (Realignment, Slice timing, Normalize, Smooth, Model specification & Estimation) were applied to generate the activation map. Activation areas were overlaid on MNI template. Evaluation : Common voxel ratio and cosine similarity were used to compare MEDI+0 to MEDI. Cosine similarity was calculated between the positive BOLD activation map and the sign inversion of the negative fQSM activation map.Results
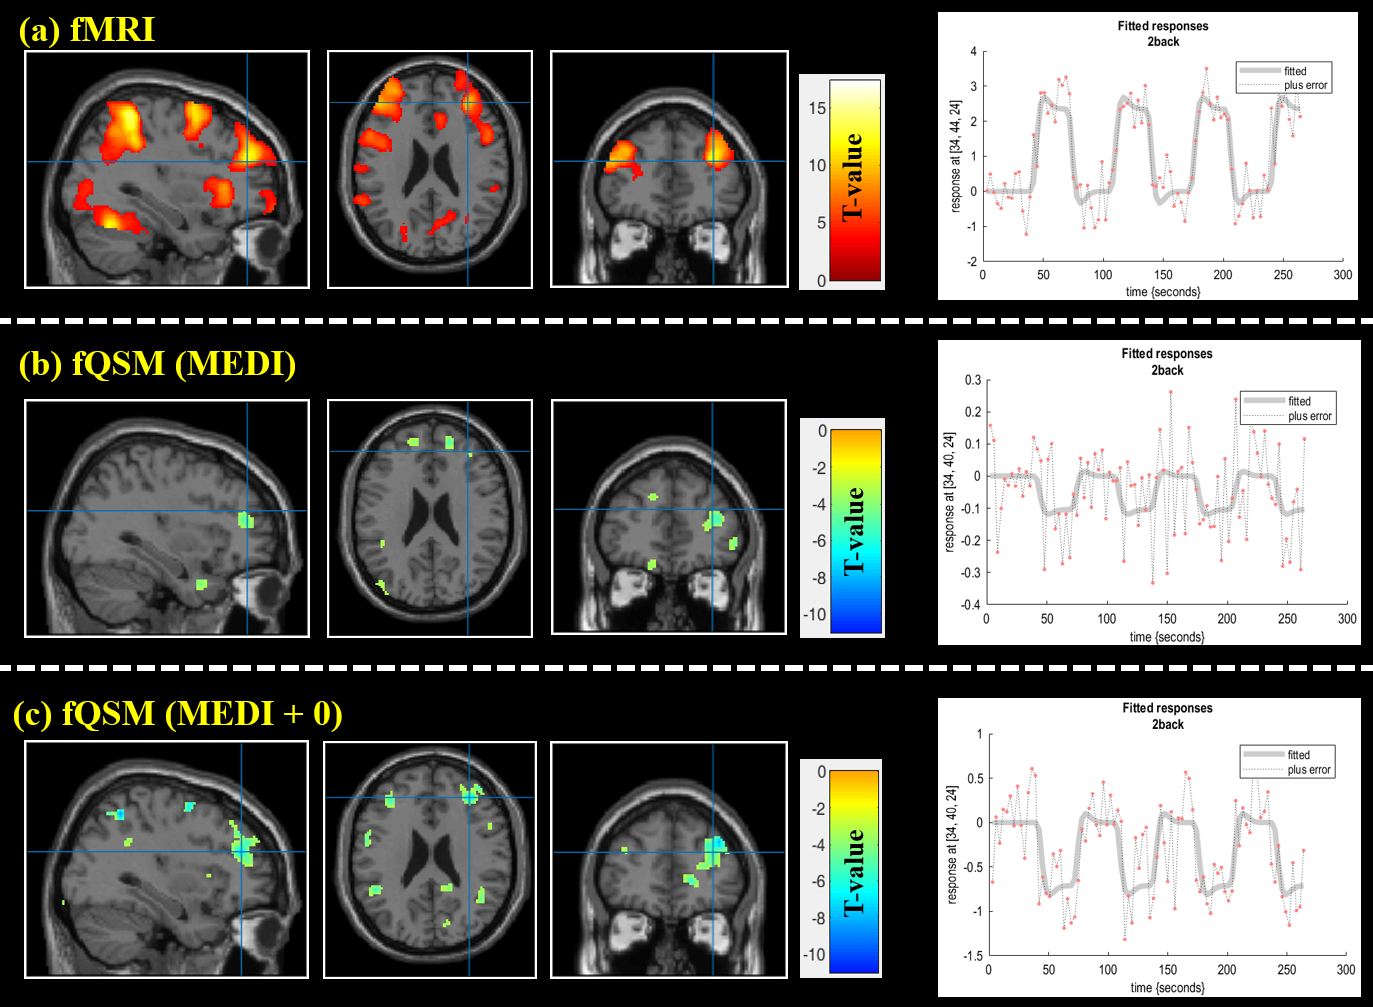
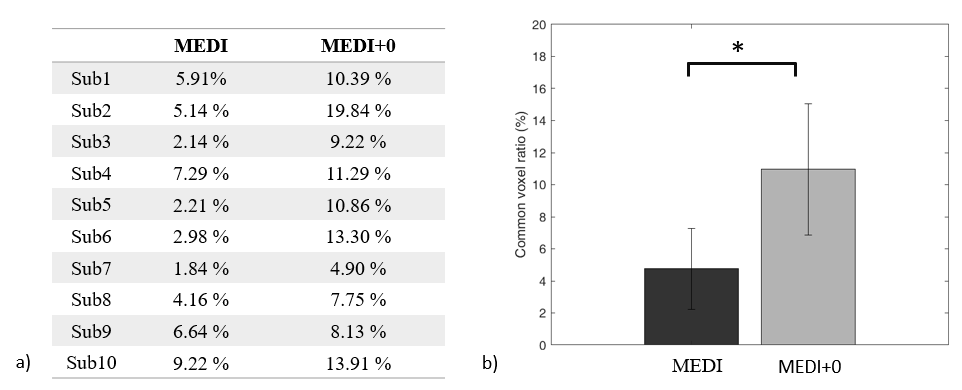
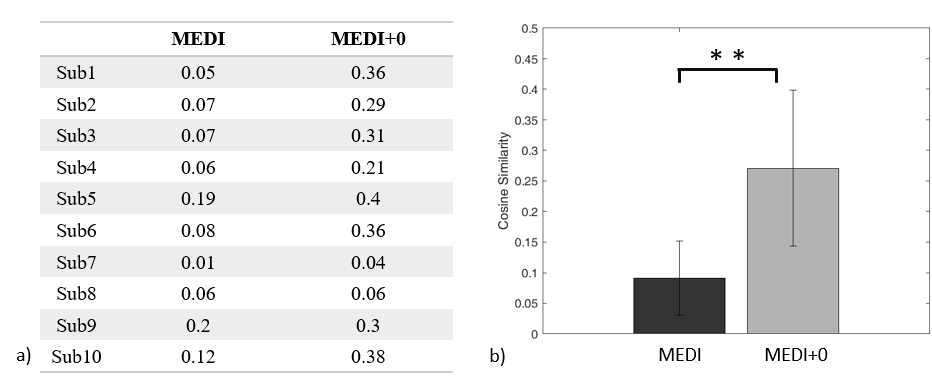
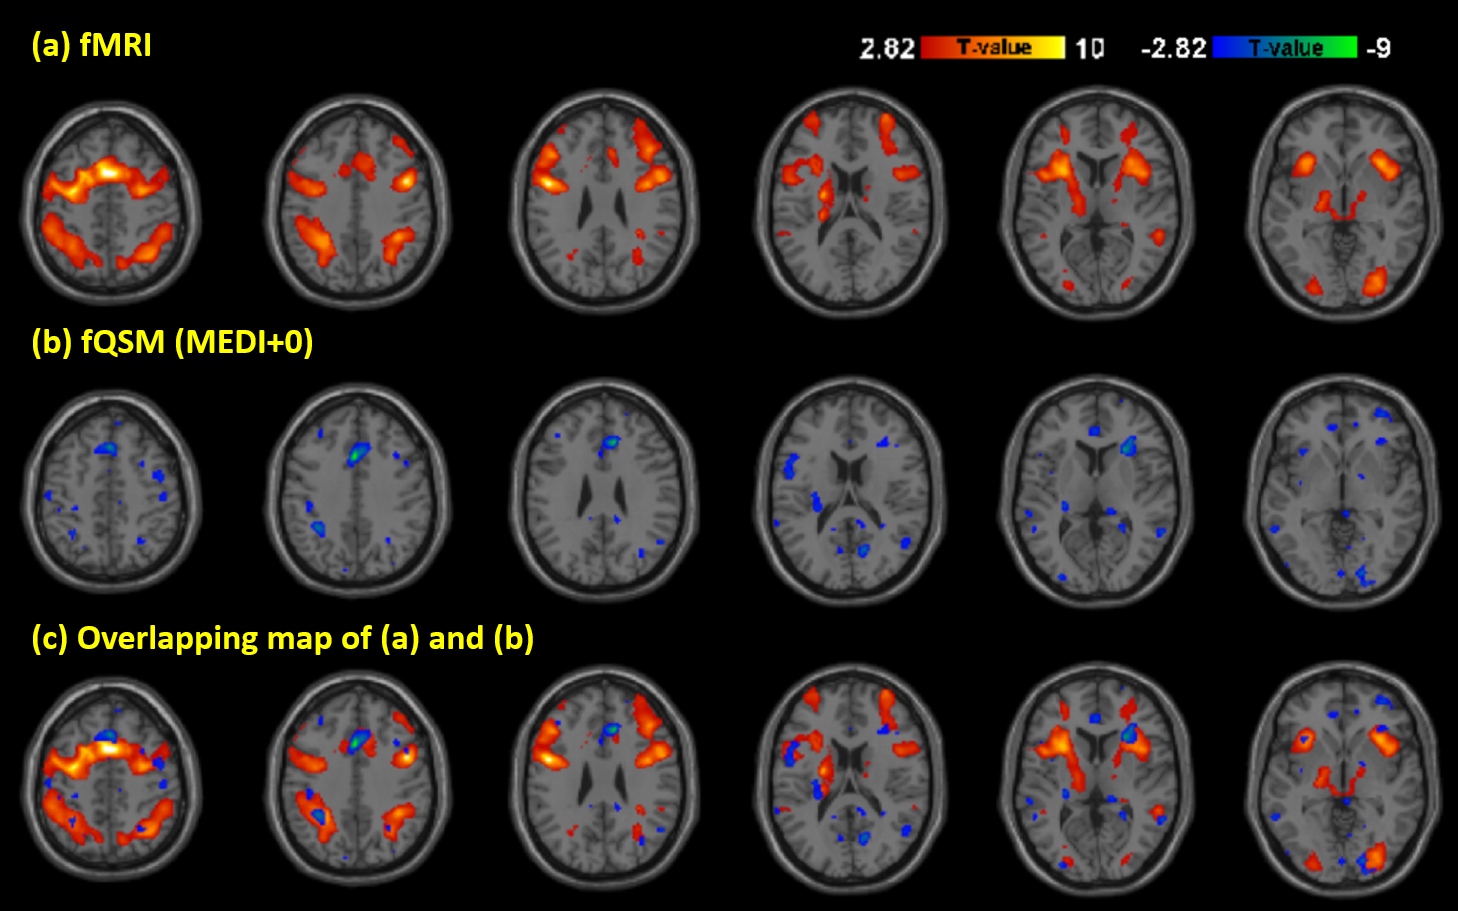
Activation maps of subject 1 during 2 back working memory task are shown in figure 1, showing the working memory responses on the inferior parietal lobule, the middle frontal gyrus and the precentral gyrus in both BOLD-fMRI and fQSM (MEDI+0), but not in fQSM (MEDI). Activation curves in the right middle frontal gyrus for BOLD and fQSM are shown in the right column. Common voxel ratio diagrams of ten subjects are shown in figure 2. fQSM using the MEDI+0 method detected more voxels than using the MEDI method with a common voxel ratio : 10.96 ± 4.1% versus 4.75 ± 2.51% (p<0.05). Cosine similarity diagrams of ten volunteers are shown in figure 3. The activation map of fQSM using MEDI+0 method is more similar to the one of fMRI than using MEDI method with a cosine similarity score : 0.27±0.12 versus 0.09±0.06 (p<0.001). Group activation maps of BOLD & fQSM (MEDI+0) are shown in figure 4 (a)(b). The overlapping map between two maps is shown in (c).Discussion
Functional QSM using the MEDI+0 method improved sensitivity comparing with using the MEDI method. Activated voxels were detected by fQSM successfully in the high-cognition demand task. Another advantage is that the CSF mask was segmented from T1 map which is acquired usually in fMRI study. There is no need to acquire additional T2 images for the original MEDI+0 method, increasing the flexibility of the application. The future direction for this study is to optimize the parameter of MEDI+0 and evaluate the limitations for more extensive application in fQSM study.Conclusion
We applied the MEDI+0 method to functional QSM and improved sensitivity compared with the MEDI method. Activated voxels were detected by fQSM using the MEDI+0 method in high-cognition demand task from standard fMRI acquisition.Acknowledgements
No acknowledgement found.References
1. Balla DZ, Sanchez-Panchuelo RM, Wharton SJ, Hagberg GE, Scheffler K, Francis ST, Bowtell R. Functional quantitative susceptibility mapping (fQSM). NeuroImage 2014;100:112-124.
2. Liu T, Xu W, Spincemaille P, Avestimehr A, Wang Y. Accuracy of the morphology enabled dipole inversion (MEDI) algorithm for quantitative susceptibility mapping in MRI. IEEE Trans Med Imaging 2012;31:816–824.
3. W. Li, N. Wang, F. Yu, H. Han, W. Cao, R. Romero, B. Tantiwongkosi, T.Q. Duong, C. Liu A method for estimating and removing streaking artifacts in quantitative susceptibility mapping. Neuroimage, 108 (2015), pp. 111-122,
4. Liu Z, Spincemaille P, Yao Y, Zhang Y, Wang Y. MEDI+0: morphology enabled dipole inversion with automatic uniform cerebrospinal fluid zero reference for quantitative susceptibility mapping. Magn Reson Med 2018; 79: 2795- 803.
5. Alexey V Dimov . Global cerebrospinal fluid as a zero-reference regularization for brain quantitative susceptibility mapping. J Neuroimaging. 2022 Jan;32(1):141-147. doi: 10.1111
6. Miguel Arevallilo Herráez. Fast two-dimensional phase-unwrapping algorithm based on sorting by reliability following a noncontinuous path. Applied Optics Vol. 41, Issue 35, pp. 7437-7444 (2002)
7. F. Schweser, A. Deistung, B.W. Lehr, J.R. Reichenbach. Quantitative imaging of intrinsic magnetic tissue properties using MRI signal phase: an approach to in vivo brain iron metabolism? Neuroimage, 54 (2011), pp. 2789-2807,
8. Wei H, Zhang Y, Gibbs E, Chen NK, Wang N, Liu C. Joint 2D and 3D phase processing for quantitative susceptibility mapping: application to 2D echo-planar imaging. NMR Biomed 2017;30(4). doi: 10.1002/nbm.3501.
Figures