2522
Multimodal quantitative MRI for the assessment of different disease processes in a childhood hypomyelinating leukodystrophy
Prativa Sahoo1, Caroline Köhler2, Irini Gkalimani1, Paul Kunte2, Peter Dechent3, Gunter Helms4, Sean Deoni5, Hagen H Kitzler2, and Steffi Dreha Kulaczewski1
1Department of Pediatrics and Adolescent Medicine, University Medical Center Göttingen, Göttingen, Germany, 2Department of Diagnostic and Interventional Neuroradiology, University Hospital Carl Gustav Carus Dresden, Dresden, Germany, 3Department of Cognitive Neurology, University Medical Center Göttingen, Göttingen, Germany, 4Lund University, Lund, Sweden, 5Bill and Medlinda Gates Foundation, Seattle, WA, United States
1Department of Pediatrics and Adolescent Medicine, University Medical Center Göttingen, Göttingen, Germany, 2Department of Diagnostic and Interventional Neuroradiology, University Hospital Carl Gustav Carus Dresden, Dresden, Germany, 3Department of Cognitive Neurology, University Medical Center Göttingen, Göttingen, Germany, 4Lund University, Lund, Sweden, 5Bill and Medlinda Gates Foundation, Seattle, WA, United States
Synopsis
Keywords: Neuro, White Matter, DTI , MTI
X-linked Pelizaeus Merzbacher disease is characterized by failure of myelin formation and subsequent axonal damage. Severity of disease courses varies depending on the underlying gene mutation. Eight male patients were recruited for the study. MR-imaging protocol included MTI, MWI for evaluation of myelin related parameters and DTI for assessment of axonal integrity. Decreased values in quantitative MTI and MWI parameter maps and ROI analyses indicated severe myelin deficit in all patients. However, FA reflected various degrees of axonal involvement among patients with deferent genotypes. Multimodal MRI can facilitate assessment of simultaneous disease processes in childhood hypomyelinating leukodystrophies.Introduction
Pelizaeus Merzbacher Disease (PMD) is a X-linked childhood leukodystrophy (LD) characterized by failure of myelin formation. Several mutations in the proteolipid protein (PLP) gene have been identified as underlying causes. They give raise to different disease courses of varying severity, i.e. a duplication lead to classical forms with onset in infancy and symptoms like nystagmus, pronounced muscular hypotonia and developmental delay1. All phenotypes share extensive signal hyperintens white matter (WM) on T2-weighted MRI. Over time, all patients also develop spasticity as the myelin deficit inevitably provokes axonal damage. Following the recommendations for hypomyelinating LD our MRI protocol included diffusion tensor imaging (DTI), magnetization transfer imaging (MTI) and multi-component relaxation derived from mcDESPOT 2. Aims of this longitudinal quantitative MRI study were to investigate, i) if myelin pathology and axonal damage can be distinguished and assessed separately as two distinct pathogenetic processes, ii) if severity of disease courses is reflected in quantitative MRI parametersMethods
A total of 8 male patients (age 2.5 – 37 yrs) with genetically confirmed PMD were included in this study. Disease course and gene mutations are displayed in Table 1. All patients underwent MRI studies using a 3 T scanner (Siemens Healthcare, Magnetom Tim Trio or Prisma Fit). Imaging protocol encompassed conventional T1- and T2-weighted sequences as well as DTI, MTI and multi-component relaxation derived from mcDESPOT with parameter settings as described before3,4.After correction for eddy current effects, fractional anisotropy (FA) maps were obtained from DTI images using the ‘dtifit’ function from FSL. Myelin water fraction (MWF) and MT saturation (MTsat) maps were quantified from mcDESPOT and MT images respectively by using inhouse developed Linux based tools3,4. For each patient FA, MTsat and MWF maps were registered to the respective T1-weighted image. Regions of interest (ROI) were placed manually on the FA maps in the splenium (SPL) and then superimposed to the coregistered MTsat and MWF maps. Mean FA, MTsat and MWF of the ROI were compared with control data.
Control data were selected from our local data base of neurologically asymptomatic children. The control group consisted of 34 subjects for MTI measurements and of 49 subjects for DTI studies with age range 0.2 – 18 years. Control values for MWF were taken from literature published by Deoni et al.5.
| Table 1: Clinical data of the PMD patients | ||||||||
| Pat Nr. | Pat-1 | Pat-2 | Pat-3 | Pat-4 | Pat-5 | Pat-6 | Pat-7 | Pat-8 |
| mutation | dupl. | point mut. | point mut. | point mut. | null mut. | dupl. | dupl. | point mut. |
| disease course | classic | intermediate-classic | intermediate-classic | severe connatal | mild PLP null syndrome | classic | classic | classic |
| no. of sessions | 5 | 1 | 2 | 1 | 1 | 1 | 1 | 1 |
| dupl.: duplication; mut.: mutation; no.: number | ||||||||
Results
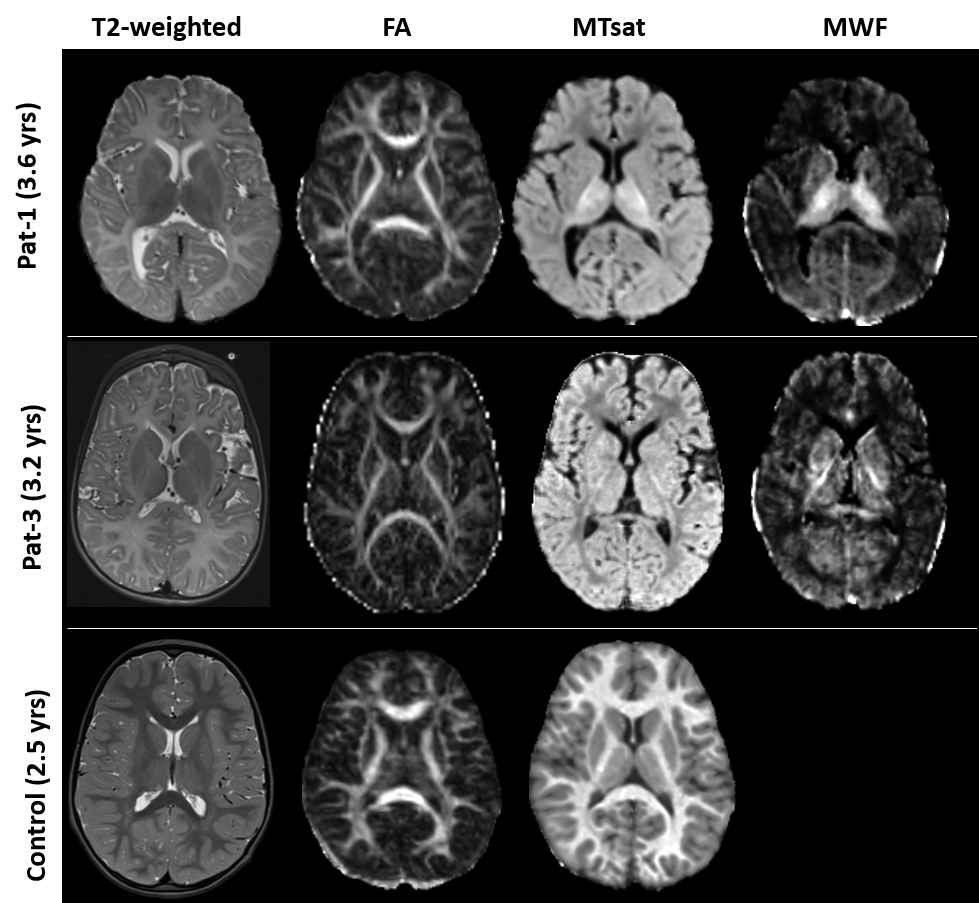
Control data depicted normal myelination processes which slow down and level off at around 2.5 yrs of age as reflected in both myelin related parameters obtained from SPL MTsat and quantitative MWF (Figure 1). MTsat values (obtained in 8) and MWF values (available from 5) patients were significantly decreased. Pat-1 monitored over 8 yrs showed a mild increase of both values over time. FA values of Pat-1, 2, 3, 6 were in lower normal ranges or slightly decreased. Lowest FA in childhood was detected in Pat-4 with the most severe clinical course (connatal, Table 1). Interestingly, Pat-5 with the mildest phenotype (Table 1) also showed a distinctly decreased FA. Figure 2 displays hyperintense WM in the T2-weighted images of representative Pat-1 and 3 and in parallel the global myelin deficit reflected by low values in the MTsat and MWF maps compared to the control (bottom row).Discussion
The uniformly lower value of myelin related parameters MTsat and MWF maps point to global hypomyelination in all patients characteristic for PMD and in line with the literature6. ROIs analyses were carried out in the highly parallel fibers of the SPL. The lowest FA values in the pediatric patients could be found in Pat-2 with the most severe conatal course which might reflect early involvement of axonal structures. Interestingly, also Pat-5 demonstrated particularly low FA although his mild clinical course being at the other end of a possible spectrum. However, in PLP null syndrome axonal damage including loss and degeneration has been described as the predominant pathology7.Conclusion
In conclusion, FA, the DTI parameter analyzed, might reflect the extent of axonal involvement in the different clinical phenotypes facilitating the assessment of parallel disease processes in PMD. These phenotypes may be of utmost importance for potential therapeutic interventions. Subsequently, management of patients may need to be adjusted accordingly. In this ongoing study other DTI parameter will be included as well as brain volume measures and longitudinal data.Acknowledgements
No acknowledgement found.References
- Cailloux F, et al. European Journal of human genetics (2000); 8:837-845.
- Pouwels P, et al. Ann Neurol (2014); 76:5-19.
- Deoni SC, Rutt BK, Arun T, Pierpaoli C, et al., Magn Reson Med. (2008); 6:1372-87
- Helms G, Dathe H, Kallenberg K, Dechent P. Magn Reson Med 2008;60:1396-1407
- Deoni SC, et al. Neuroimage 63 (2012) 1038-1053.
- Sarret C, et al. Developmental Medicine & Child Neurology (2016); 58:706-713.
- Gabern J, et al. Brain (2002); 125:551-561.
Figures
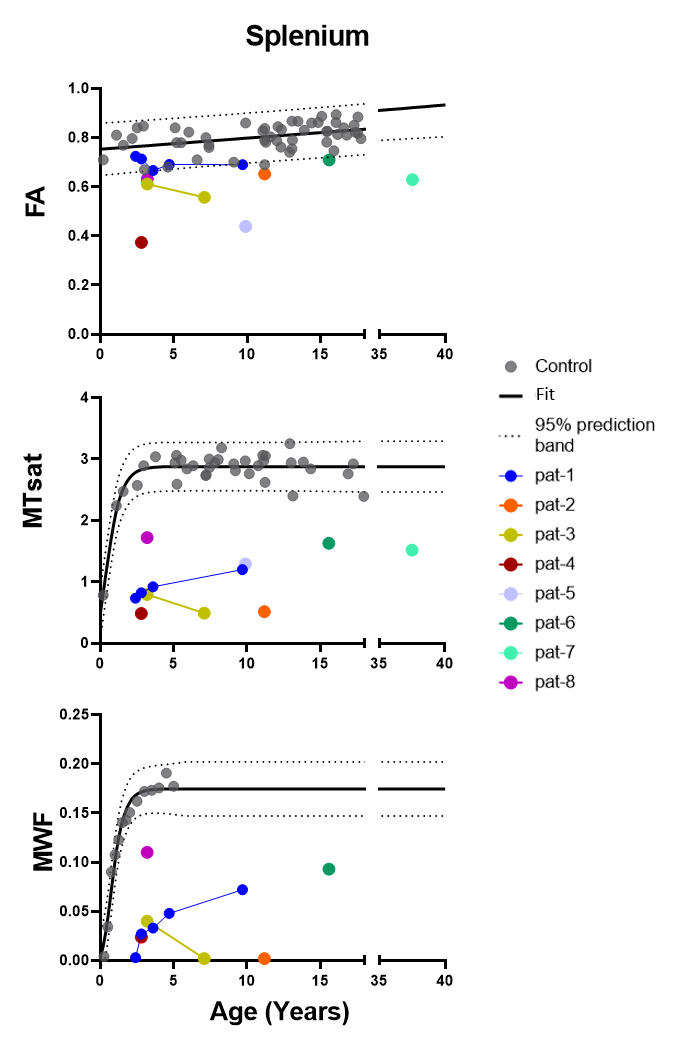
Figure 1: Scatter plots show FA, MTsat and MWF values of the splenium for all patients as well as controls with respect to age. Dotted lines represent the 95% confidence band for control data. Linear regression model was used for FA and Gompartz model for MTsat and MWF to determine the Confidence interval.
Figure
2:
from left: T2-weighted images, FA,
MTsat, MWF maps of Pat-1 (age
3.6 yrs), pat-3 (3.2yrs) and a control subject age 2.5 yrs. Whole WM is
hyperintense on T2-weighted images in both patients. FA maps do not deviate
from the control. MTsat and MWF maps of the patients show significantly lower
values compared to the control. MWF map were not available for any control data.
DOI: https://doi.org/10.58530/2023/2522