2514
Vascular territorial analysis of cerebral blood flow in pediatric Moyamoya to exclude arterial transit time bias
Rahel Heule1,2, Raimund Kottke3, and Ruth Tuura1,2
1Center for MR Research, University Children's Hospital, Zurich, Switzerland, 2Children's Research Center, University Children's Hospital, University of Zurich, Zurich, Switzerland, 3Department of Diagnostic Imaging, University Children’s Hospital, Zurich, Switzerland
1Center for MR Research, University Children's Hospital, Zurich, Switzerland, 2Children's Research Center, University Children's Hospital, University of Zurich, Zurich, Switzerland, 3Department of Diagnostic Imaging, University Children’s Hospital, Zurich, Switzerland
Synopsis
Keywords: Neuro, Arterial spin labelling
Delayed perfusion in patients with Moyamoya vasculopathy can lead to a bias in CBF quantification, especially for single-delay ASL acquisitions. In this work, we investigate the clinical utility of arterial transit time corrected CBF derived from a 7-delay prototype ASL sequence for assessment of hemodynamically mediated perfusion failure in pediatric Moyamoya patients. The multi-delay ASL acquisition proved successful in capturing the whole distribution of transit times in the investigated patient cohort and may thus be a valid contrast agent-free alternative to DSC-enhanced perfusion imaging.Introduction
Moyamoya vasculopathy, characterized by progressive stenosis of the internal carotid arteries, most commonly presents with recurrent transient ischemic attacks and stroke in childhood due to hemodynamically mediated perfusion failure. Identification of abnormal tissue perfusion in children with Moyamoya syndrome or disease is essential for early treatment planning including surgical cerebral revascularization to increase the blood supply in hypoperfused vascular territories (1). Arterial spin labeling (ASL) allows for cerebral blood flow (CBF) assessment without the need for contrast agents as opposed to dynamic susceptibility contrast (DSC)-enhanced perfusion imaging, which relies on bolus tracking after intravenous injection of a gadolinium-based contrast agent. However, delayed perfusion due to vessel occlusion in Moyamoya patients can lead to an underestimation of CBF with conventional single-delay ASL, which favors multi-delay acquisitions. Here, we investigate the influence of arterial transit time (ATT) distribution in children with Moyamoya vasculopathy on the clinical utility of single-delay versus multi-delay pseudo-continuous arterial spin labeling (pCASL) using a recently introduced template consisting of five bilateral vascular territories (2).Methods
Patient cohort and MR protocolWe analyzed the cerebral perfusion imaging data of fourteen children and adolescents with Moyamoya syndrome or disease (5 females; median age: 11 years, age range: 3 – 18 years), who underwent MR examinations at either 1.5 T (SIGNA Artist, GE Healthcare; 4 patients) or 3 T (DISCOVERY MR750 or SIGNA Premier, GE Healthcare; 10 patients). The MR protocol relevant for this analysis included:
- a T2-weighted fast recovery fast spin-echo (FRFSE) sequence for anatomical reference and segmentation purposes
- a standard 3D pCASL acquisition with spiral readout using a single post-label delay (PLD) of 1525 ms and a label duration of 1450 ms
- a time-encoded 7-delay 3D pCASL prototype sequence with spiral readout termed enhanced ASL (eASL) using PLDs in the range [1000, 3582] ms / [1000, 3658] ms with corresponding effective label durations in the range [348, 918] ms / [361, 842] ms, calculated by assuming arterial blood T1 values of 1400 ms / 1650 ms, at 1.5 T / 3 T
- DSC perfusion-weighted scans using a gradient-echo echo-planar imaging (EPI) sequence with an intravenous bolus injection of gadolinium contrast agent
We compared the following perfusion data with respect to potential transit time impairments:
- CBFstd: CBF maps of the standard single-delay ASL measurement, which were obtained by assuming that the arterial transit time is less than or equal to the employed PLD of 1525 ms
- CBFav: CBF maps calculated based on the average perfusion-weighted signal from the multi-delay eASL measurement and thus not transit time-corrected
- ATT, CBFcorr: The employed multi-delay eASL acquisition enables to probe for bolus arrival time and to calculate signal-weighted delays, which can be converted into ATT maps (3). These ATT values were then used to obtain transit time-corrected CBF maps.
- rCBF: relative CBF maps obtained by deconvolution of the motion-corrected DSC image series with the arterial input function
Results
As can be seen from Figure 2, the transit corrected CBFcorr is highly correlated with the CBFav derived based on the same acquisition (r >= 0.94) as well as with CBFstd obtained from the standard single-delay acquisition (r >= 0.88). The linear relationship is driven by a transit time bias inherent to CBFav and CBFstd as evidenced in Figure 3 by a high correlation in case of CBFav (r >= 0.98) and a moderate correlation in case of CBFstd (r >= 0.46) between the transit time and the deviation of CBFav and CBFstd, respectively, from CBFcorr. This implies an underestimation of uncorrected CBF for transit times longer than PLD (cf. Fig. 4), which may become relevant for delayed perfusion in children with Moyamoya syndrome or disease. The 7-delay ASL acquisition with a maximal PLD of 3.6 – 3.7 seconds appeared to be able to capture the full distribution of transit times expected in children and adolescents with Moyamoya vasculopathy (cf. Fig. 5) and no apparent transit-time induced mismatch with the rCBF of the DSC acquisition was observed.Discussion and Conclusion
In patients with Moyamoya vasculopathy, delayed perfusion can result in a bias in CBF quantification, especially for single-delay protocols. This renders multi-delay ASL acquisitions beneficial, which allow for the simultaneous quantification of ATT and transit time corrected CBF. The investigated 7-delay ASL prototype proved successful in capturing the whole distribution of transit times in a pediatric cohort of fourteen Moyamoya patients. It thus appears as a valid contrast agent-free alternative to DSC-enhanced perfusion imaging.Acknowledgements
We acknowledge support from GE Healthcare for providing the enhanced arterial spin labeling (eASL) prototype sequence and from David Shin (GE Healthcare) for assisting with the interpretation of the quantitative output maps.References
1. Calamante F, Ganesan V, Kirkham FJ, Jan W, Chong WK, Gadian DG, Connelly A. MR perfusion imaging in Moyamoya Syndrome: potential implications for clinical evaluation of occlusive cerebrovascular disease. Stroke 2001;32(12):2810-2816.
2. Schirmer MD, Giese AK, Fotiadis P, Etherton MR, Cloonan L, Viswanathan A, Greenberg SM, Wu O, Rost NS. Spatial Signature of White Matter Hyperintensities in Stroke Patients. Front Neurol 2019;10:208.
3. Dai W, Robson PM, Shankaranarayanan A, Alsop DC. Reduced resolution transit delay prescan for quantitative continuous arterial spin labeling perfusion imaging. Magn Reson Med 2012;67(5):1252-1265.
Figures
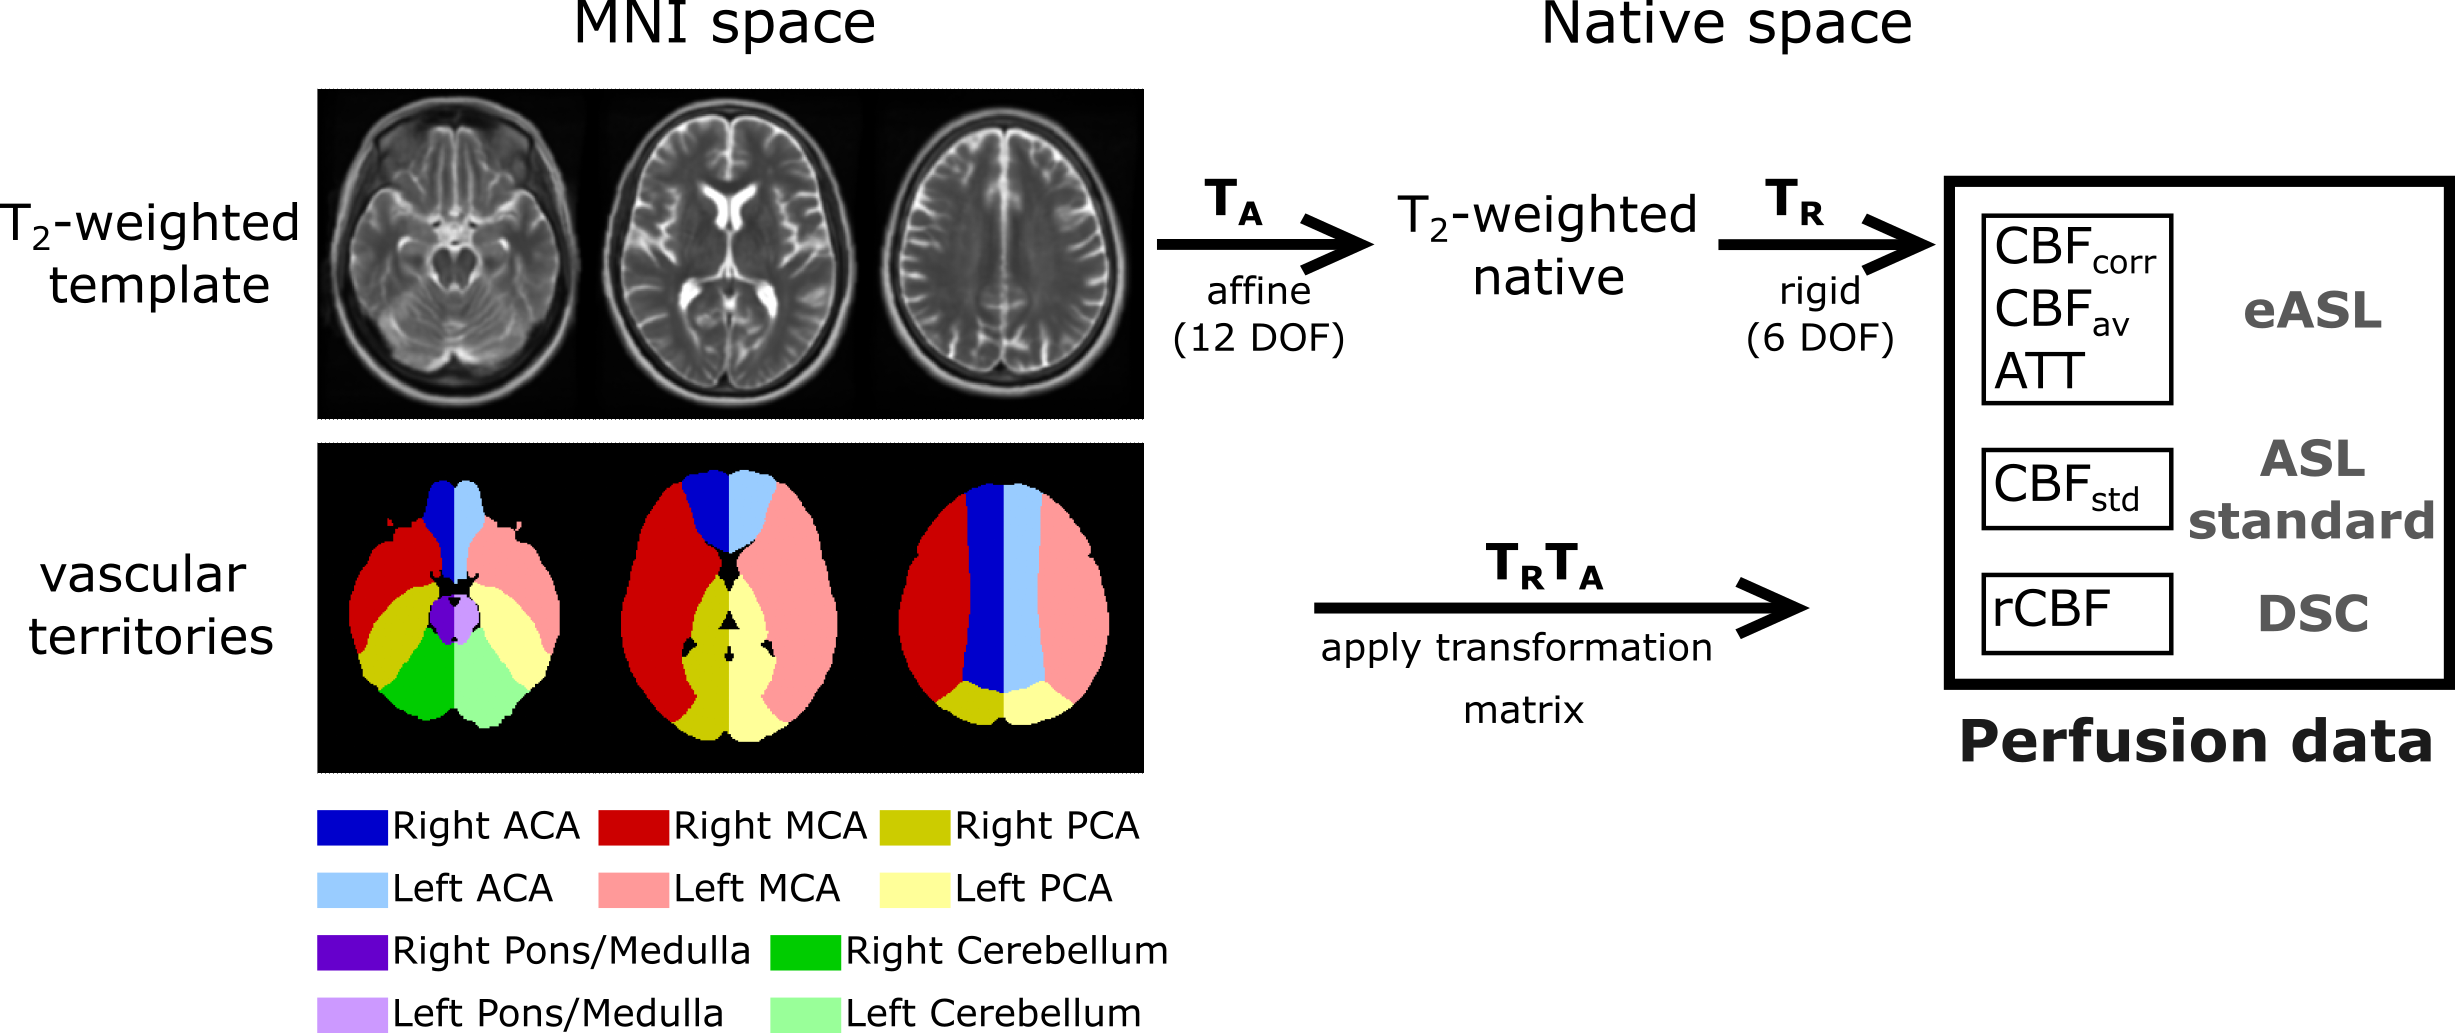
Figure 1. The T2-weighted
template was registered to the acquired native T2-weighted data by
affine (12 DOF) transformations. The native T2-weighted images were
registered by rigid (6 DOF) transformations to the perfusion data. The obtained
transformation matrices were applied to the vascular territory maps, consisting
of five bilateral regions (anterior cerebral artery, ACA, red; middle cerebral
artery, MCA, blue; posterior cerebral artery, PCA, yellow; pons/medulla, violet;
cerebellum, green; dark and light colors referring to right and left hemisphere,
respectively).
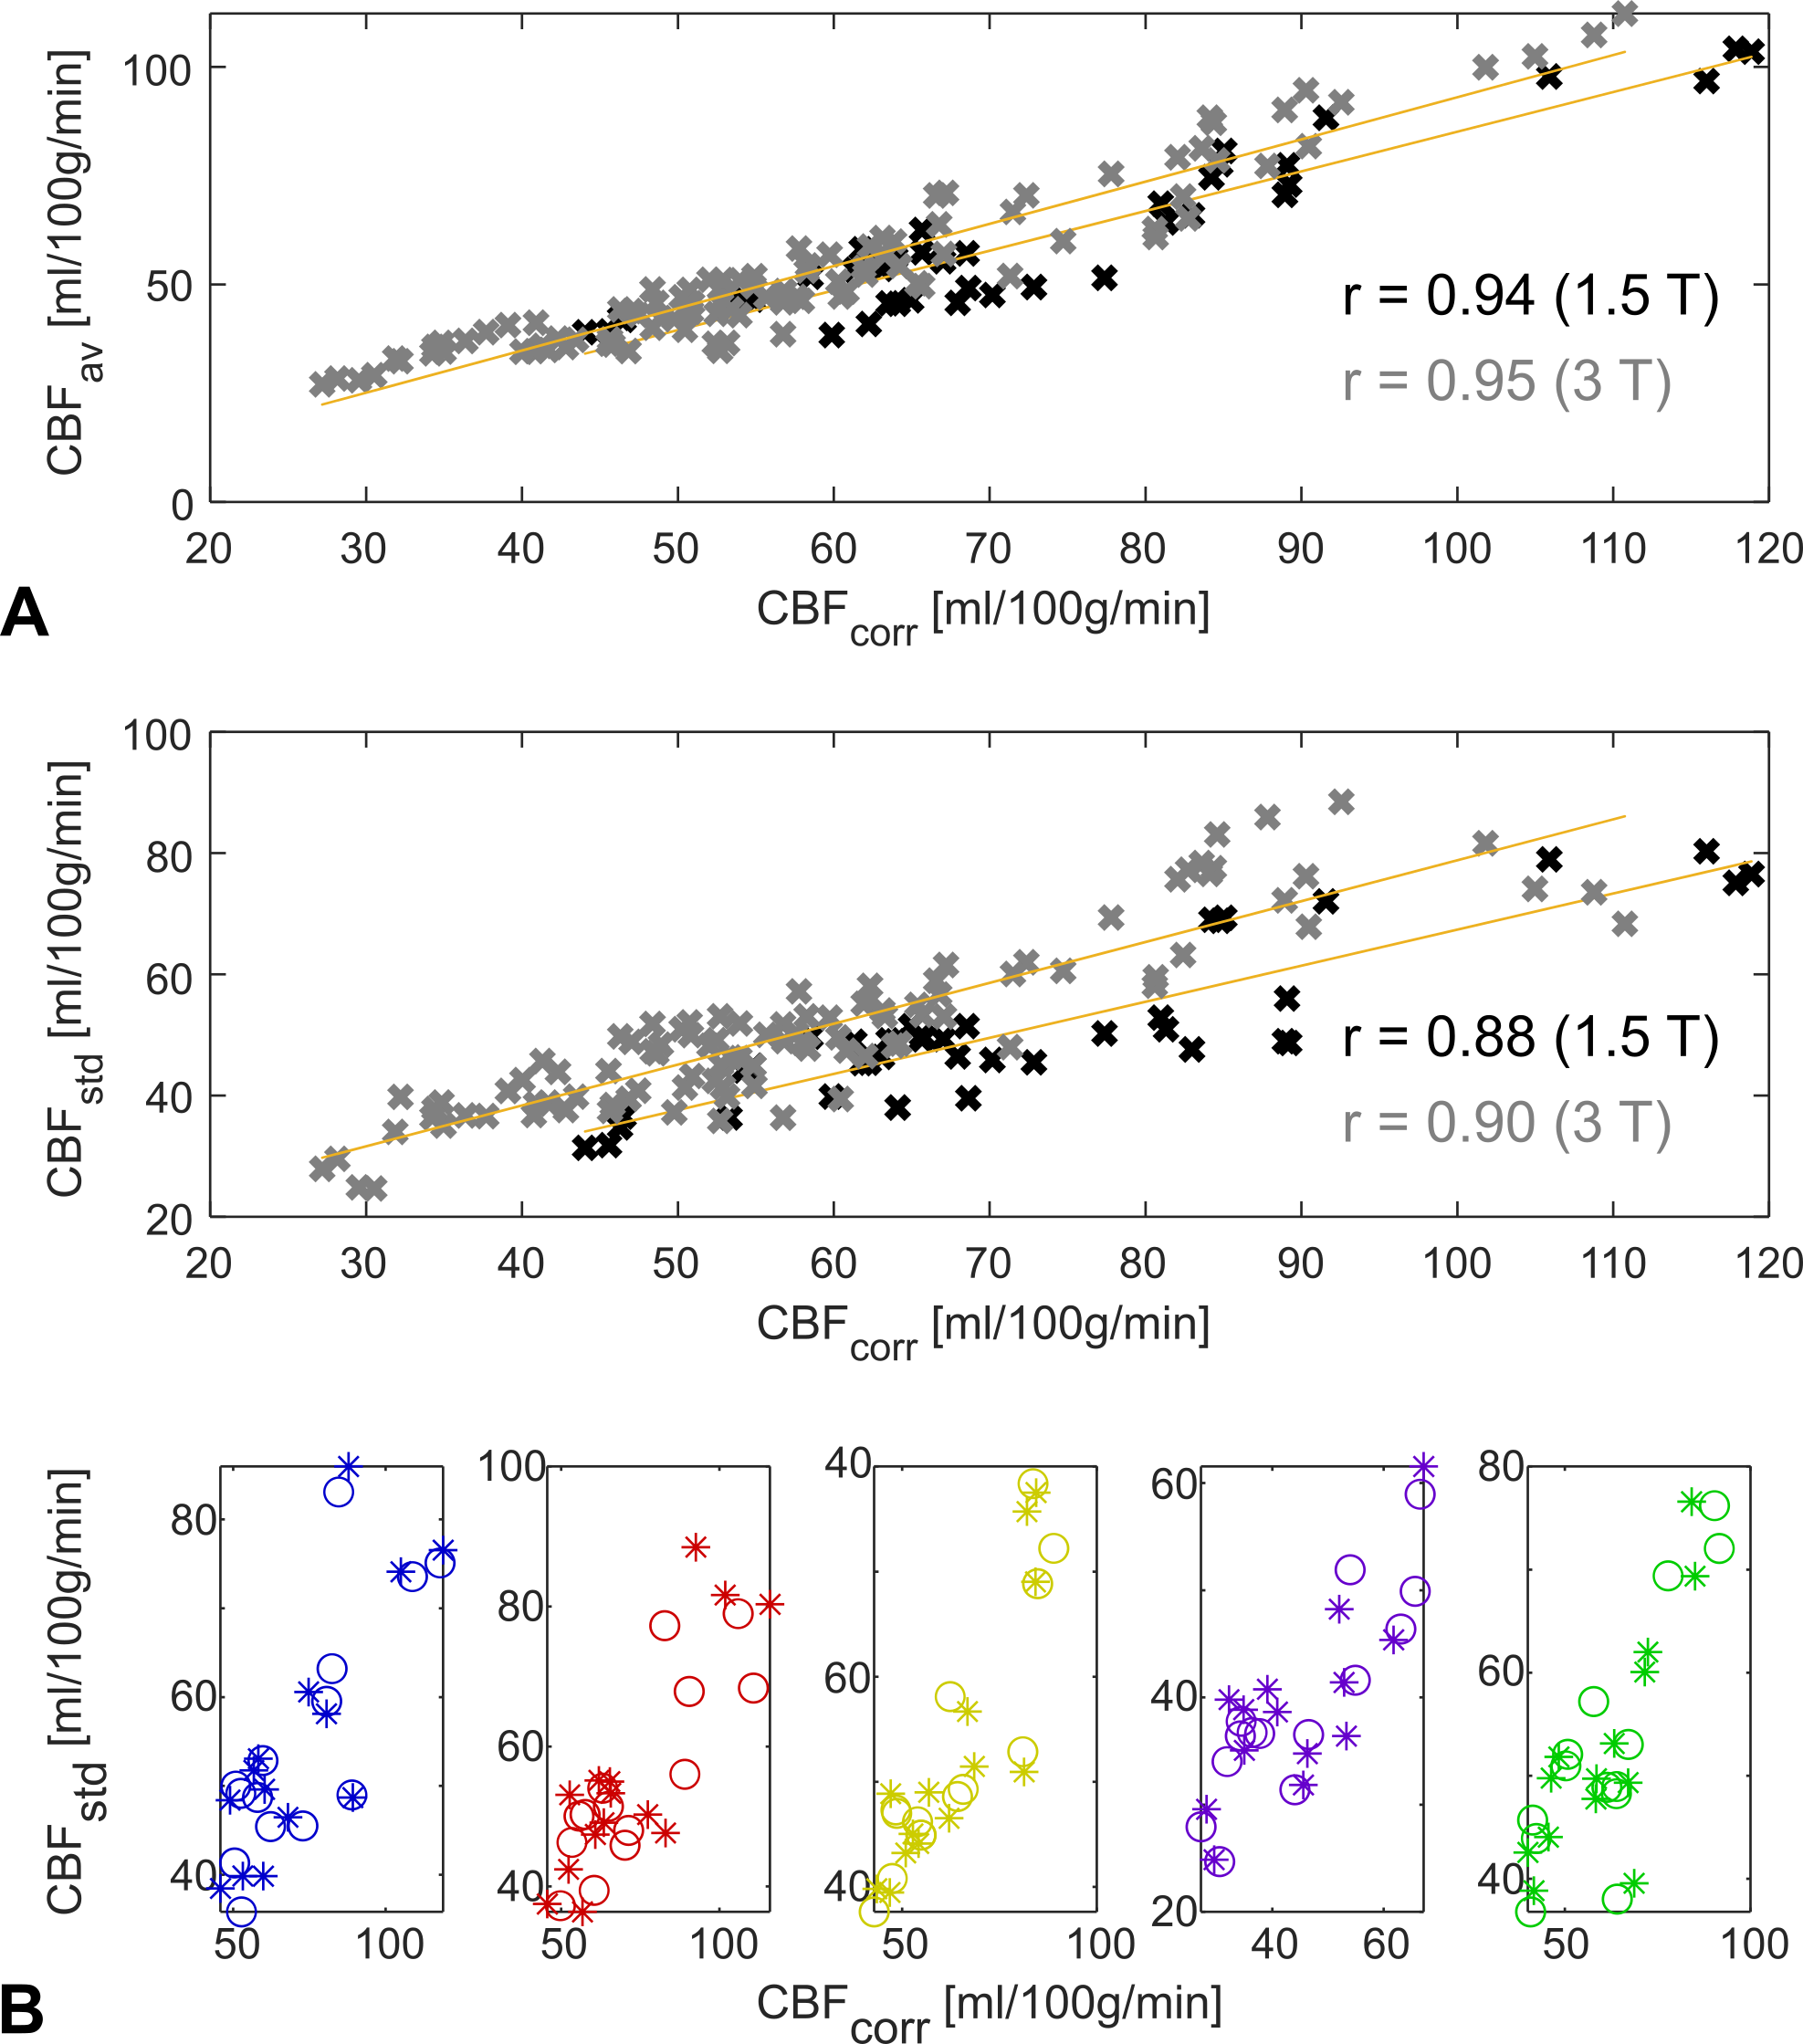
Figure 2. Scatter plots showing the
correlations between different CBF metrics for 1.5 T data (black crosses) and 3
T data (gray crosses) across all included patients and vascular territories. For
each vascular territory, a single data point referring to the mean in the
respective territory is plotted. A: Comparison between CBFcorr
and CBFav. B: Comparison
between CBFcorr and CBFstd. Individual vascular
territories are disentangled in the second row (stars: right hemisphere,
circles: left hemisphere, color coding as introduced in Fig. 1).
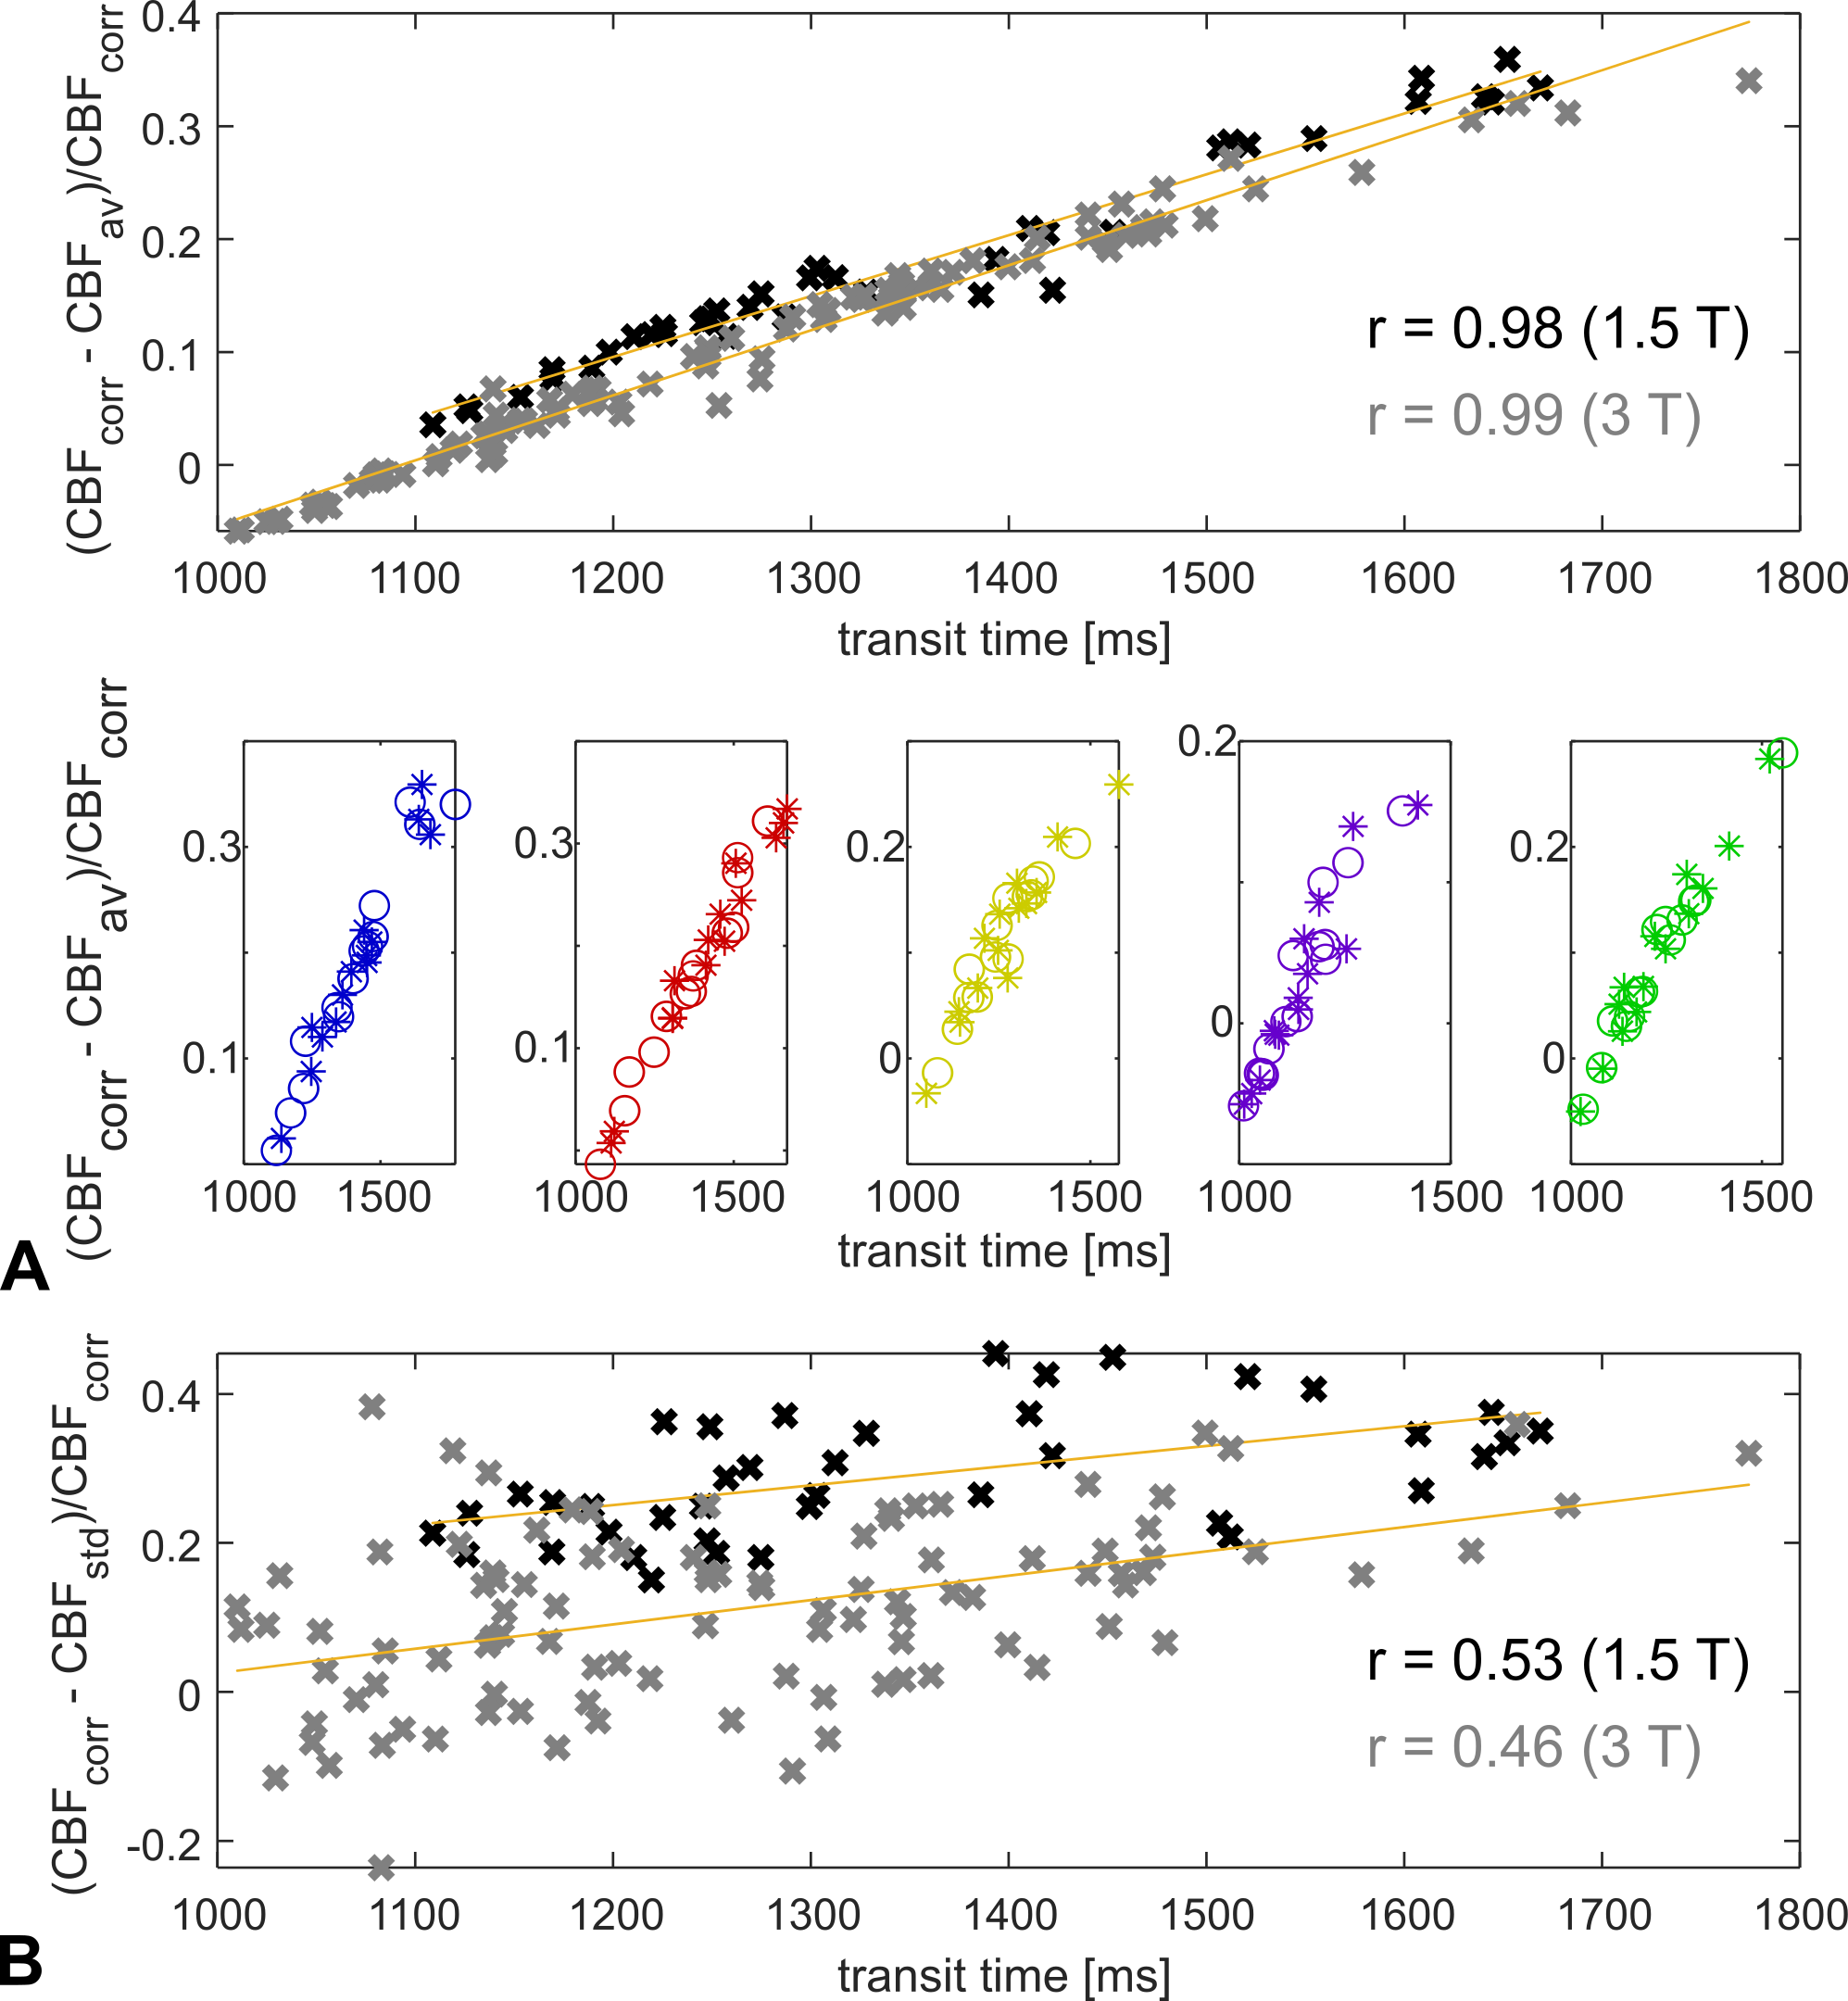
Figure 3. Scatter plots showing the
dependence of the relative differences between the derived CBF metrics on ATT
for 1.5 T data (black crosses) and 3 T data (gray crosses) across all included patients
and vascular territories. Single data points refer to the mean in individual
vascular territories. A: Relative differences between CBFcorr
and CBFav including visualization of the behavior in
individual vascular territories (stars: right hemisphere, circles: left
hemisphere, color coding as introduced in Fig. 1). B: Relative deviation
of CBFstd (PLD = 1525 ms) from CBFcorr.
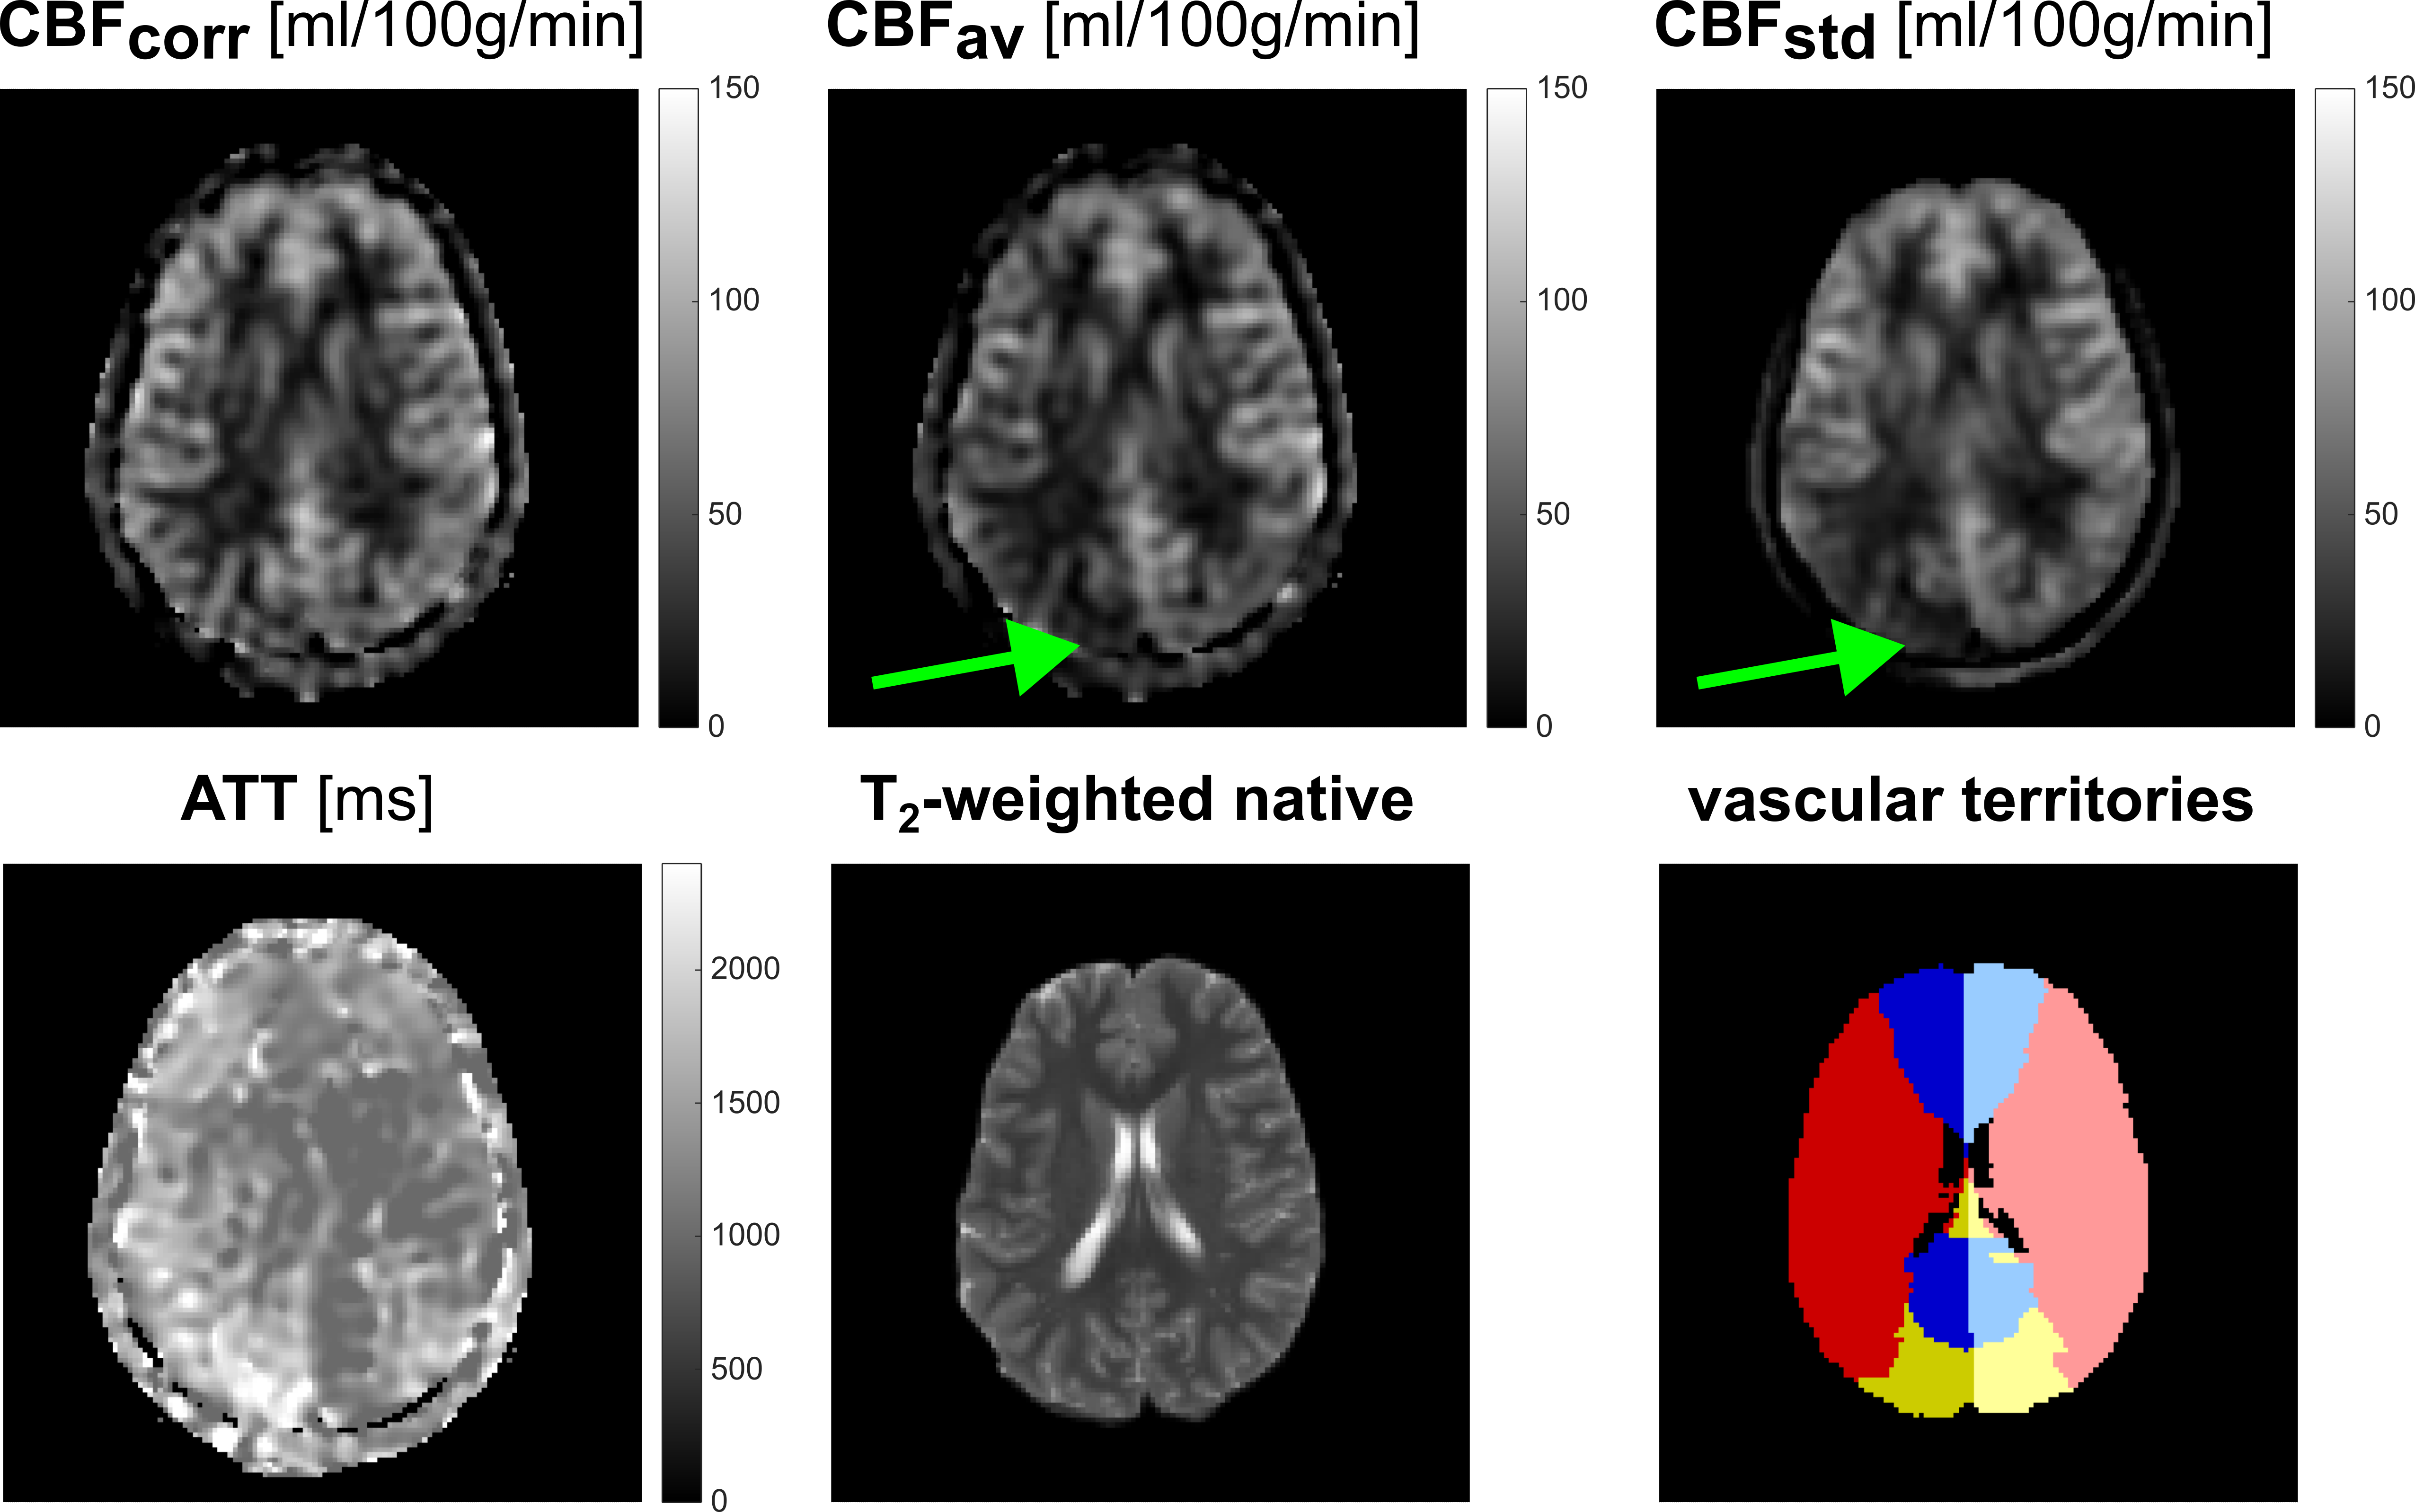
Figure 4. In territories with
prolonged transit times, single-delay CBF (CBFav and CBFstd)
is artificially underestimated for ATT values longer than the respective PLDs.
In the illustrated case, such a bias in CBFav and CBFstd
can be observed in the right PCA as pointed out by the green arrow, whereas the
transit corrected CBF (CBFcorr) shows consistent values in the right
and left PCA.
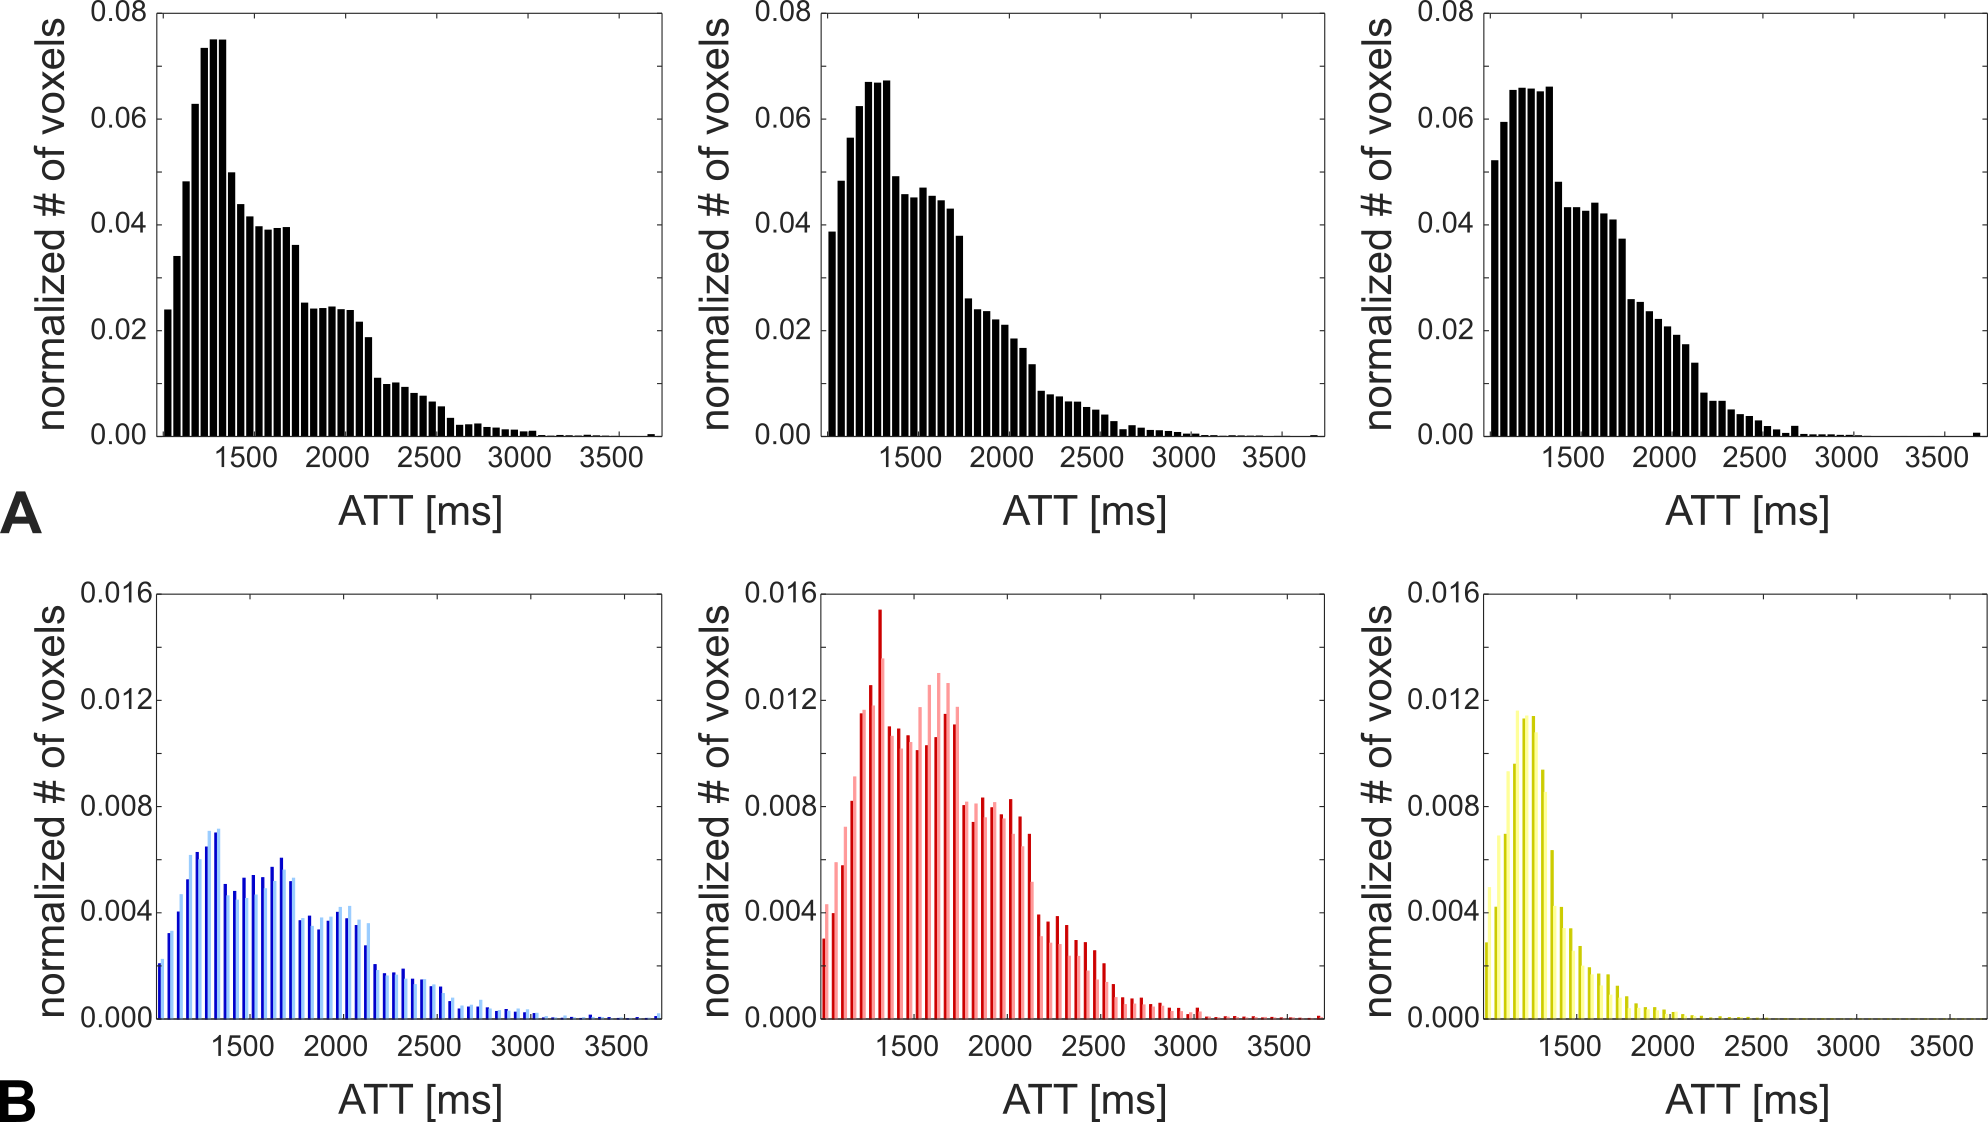
Figure 5. A: Analysis of the
whole-brain transit time distribution in three selected patients with Moyamoya vasculopathy,
who showed maximal delayed perfusion within the investigated cohort. The range
of transit time values is well below the threshold corresponding to the maximal
PLD of the 7-delay ASL acquisition. B: Transit time distribution in
individual vascular territories corresponding to the patient data included on
the left plot in A (blue: ACA, red: MCA, yellow: PCA, dark: right hemisphere,
light: left hemisphere).
DOI: https://doi.org/10.58530/2023/2514