2512
The evaluation of Synthetic MRI and machine learning in differentiating autism and developmental language disorders1Department of Radiology, the Third Affiliated Hospital of Zhengzhou University, Zhengzhou, China, 2MR Research China, GE Healthcare, Beijing 100000, PR China, Beijing, China, 3Department of Medical Imaging of Henan Provincial People’s Hospital, Zhengzhou University People’s Hospital, Zhengzhou, China
Synopsis
Keywords: Neuro, Quantitative Imaging, Autism Spectrum Disorder
Distinguishing early Autism Spectrum Disorder (ASD) from Developmental language disorder (DLD) in clinical practice is challenging as they are usually diagnose by behavioral tests and subjective observation. The emerging technique Synthetic MRI can be used to quantify the changed in biological tissues. Machine learning is also widely used for improvement of diagnostic performance. This study was aimed to identify ASD from DLD by using Synthetic MRI in combination with machine learning methods. Results show that T1 mapping in Synthetic MRI can be used for differentiation of the two diseases and the SVM model with linear kernel have the best performance.Background or Purpose
Autism Spectrum Disorder (ASD) is a highly heritable and heterogeneous neurodevelopmental disorder with a prevalence of approximately 1% of children[1]. It is likely to be misdiagnosed and underdiagnosed since the diagnosis relies mainly on behavioral tests and subjective observation. Individuals with autism often present with social communication deficits, repetitive or stereotypical movements[2]. Developmental language disorder (DLD) is a speech or language disorder caused by developmental delay without significant brain damage [3]. There are some similarities between early ASD and DLD since they both present language developmental delays. Furthermore, children with DLD often have other overlapped symptoms with ASD, such as developmental delays in fine motor and social communication. As the treatments for ASD and DLD are different and early diagnosis and treatment have a significant impact on prognosis, it is crucial to differentiate the two diseases at an early stage.Magnetic resonance imaging (MRI) provides a non-invasive and reproducible means for the diagnosis of ASD and DLD. Regarding neuroimaging of ASD, early intracranial volume enlargement in ASD has been frequently reported in the previous literature[4]. Synthetic MRI is a fast and novel MRI technique that can be used to simultaneously obtain conventional MR images such as T1WI and T2WI and quantitative maps of T1 relaxation time, T2 relaxation time, and proton density (PD), as well as derived parameters like myelin water fraction (MWF), and total intracranial volume (TIV) within minutes. In this study, we aim to evaluate the ability of Synthetic MRI to differentiate children with ASD and DLD and also test its performance in combination with machine learning approaches.
Methods
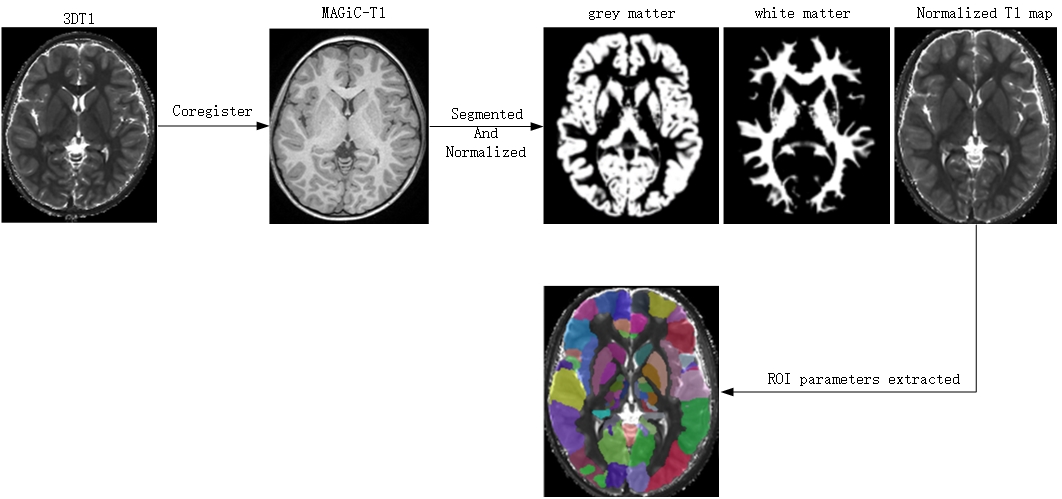
A total of 25 children with ASD and 23 children with DLD at the age of 2-5 years were enrolled. Magnetic resonance data were acquired on a 3.0 T scanner (SIGNA Pioneer, GE Medical Systems, Waukesha, WI, United States). Parameters of Synthetic MRI were as follows: TR = 4230 ms; TE = 20.4 ms; FOV = 24×24 mm2; Slices = 24; scanning time = 4 min 30 s; Parameters of 3D T1-weighted image were as follows: slice thickness = 1 mm; slices = 152; scanning time = 3 min 43 s. T1, T2 mapping and PD images were generated simultaneously on SyMRI 8.0 software (SyntheticMR, Linköping, Sweden). Co-registration and parameters extraction were then performed on SPM software (https://www.fil.ion.ucl.ac.uk/spm/). Cortico-striatal pathway is a common vulnerable brain region in ASD and DLD [5, 6]. The orbitofrontal cortex (OFC) (including medial orbital gyrus, anterior orbital gyrus, posterior orbital gyrus, lateral orbital gyrus), striatum (including the caudate nucleus, putamen, and pallidum), amygdala, and hippocampus are taken as regions of interests (ROIs).All statistical analyses and machine learning were performed in R (https://www.r-project.org/). Mann-Whitney U Test was used for comparison of T1 and T2 relaxation time in independent samples. Random forest, Decision tree, Support Vector machine (SVM) with four kernels including linear kernel, radial kernel, polynomial kernel, sigmoid kernel were used to construct machine learning models. Ten-fold cross-validation was used to assess the performance.
Results
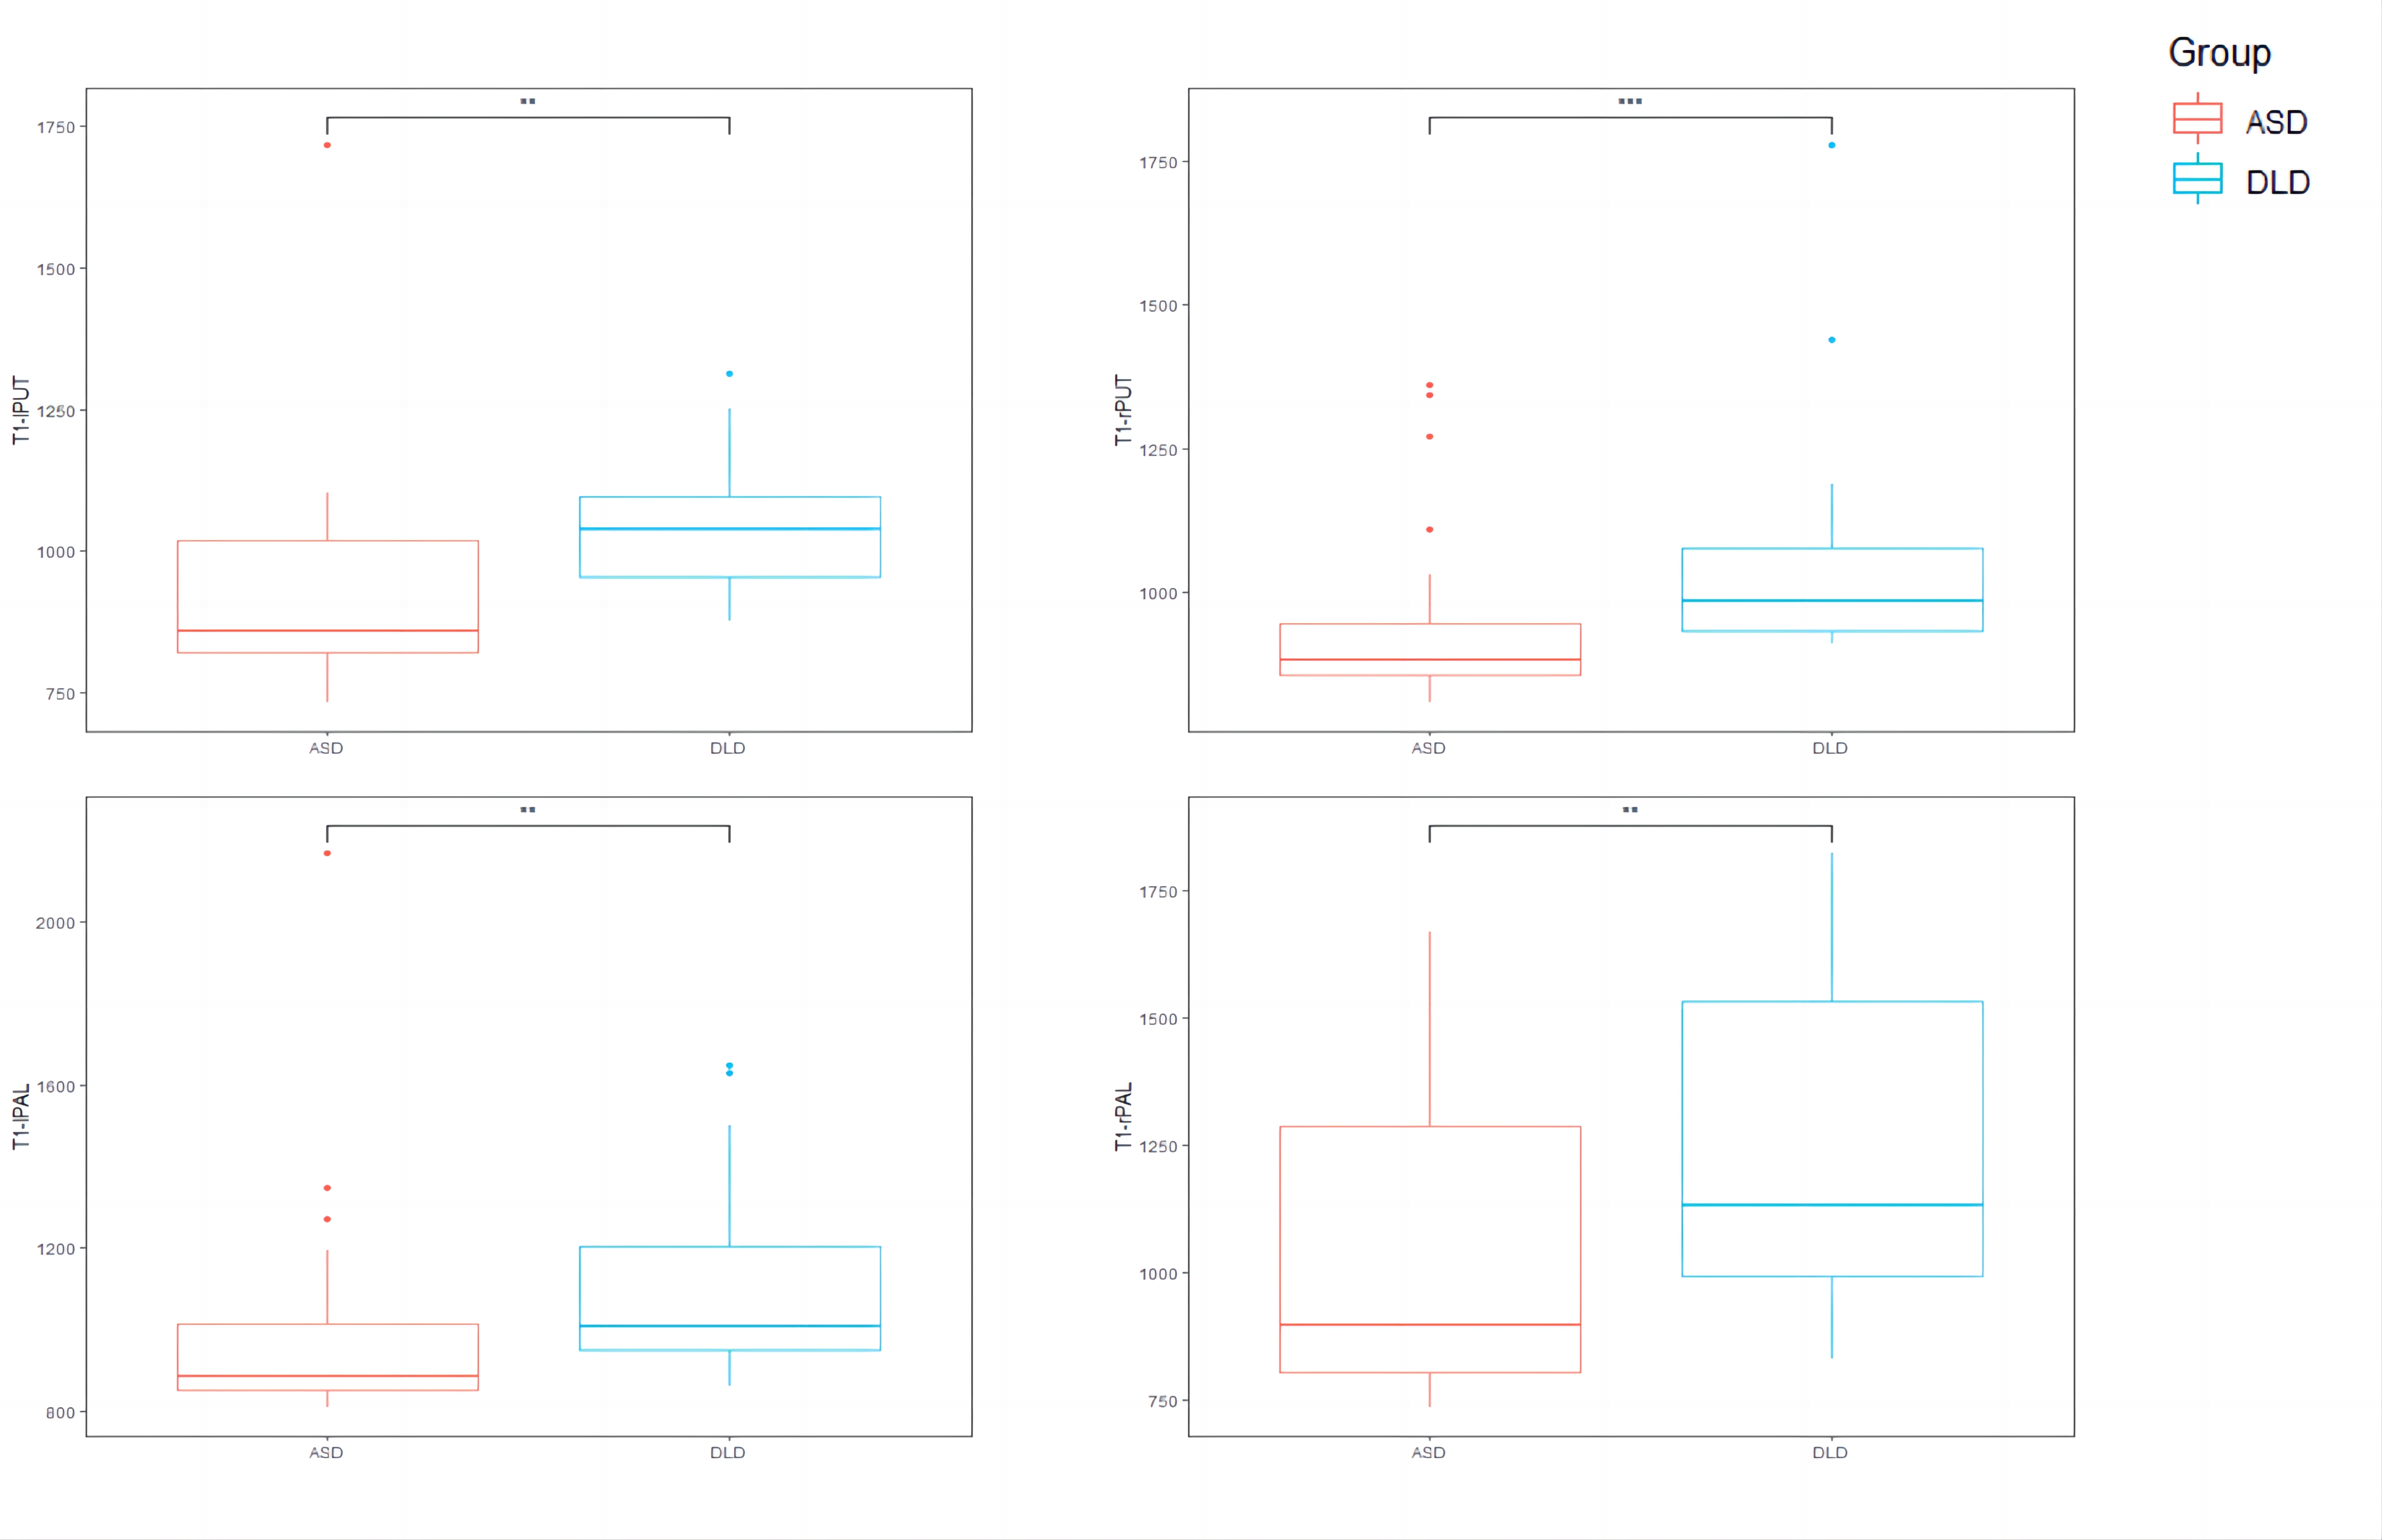
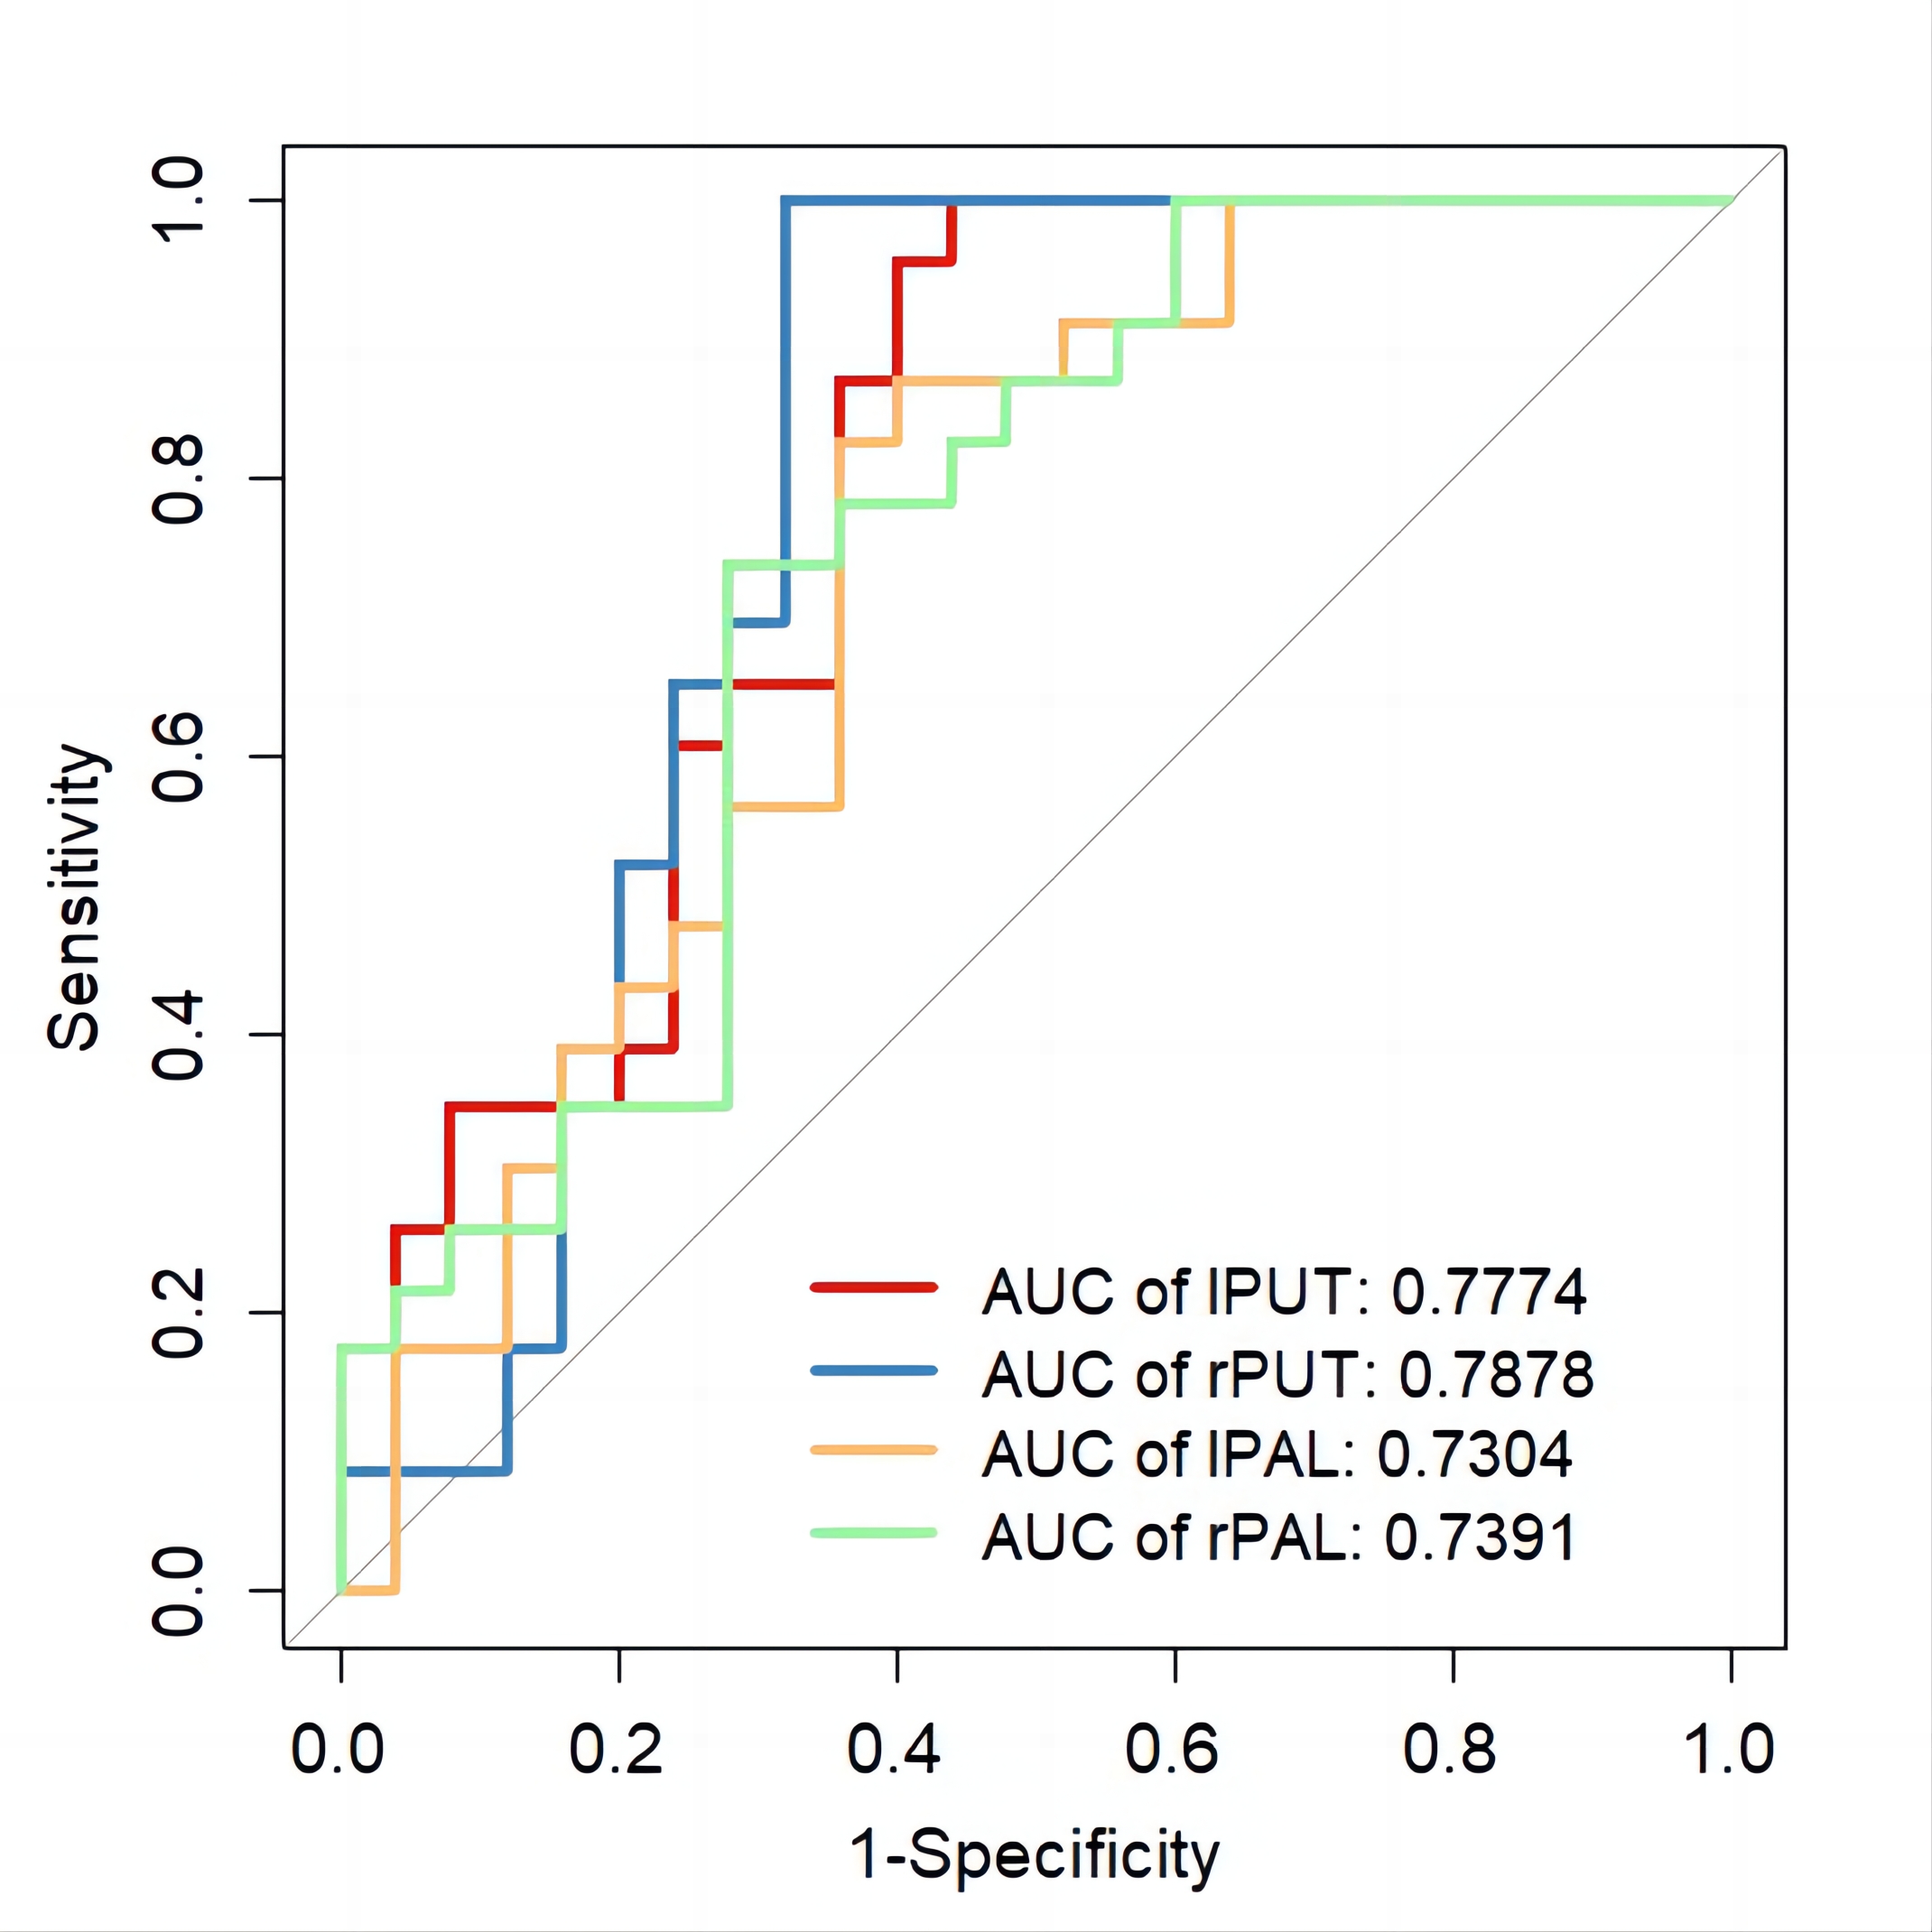
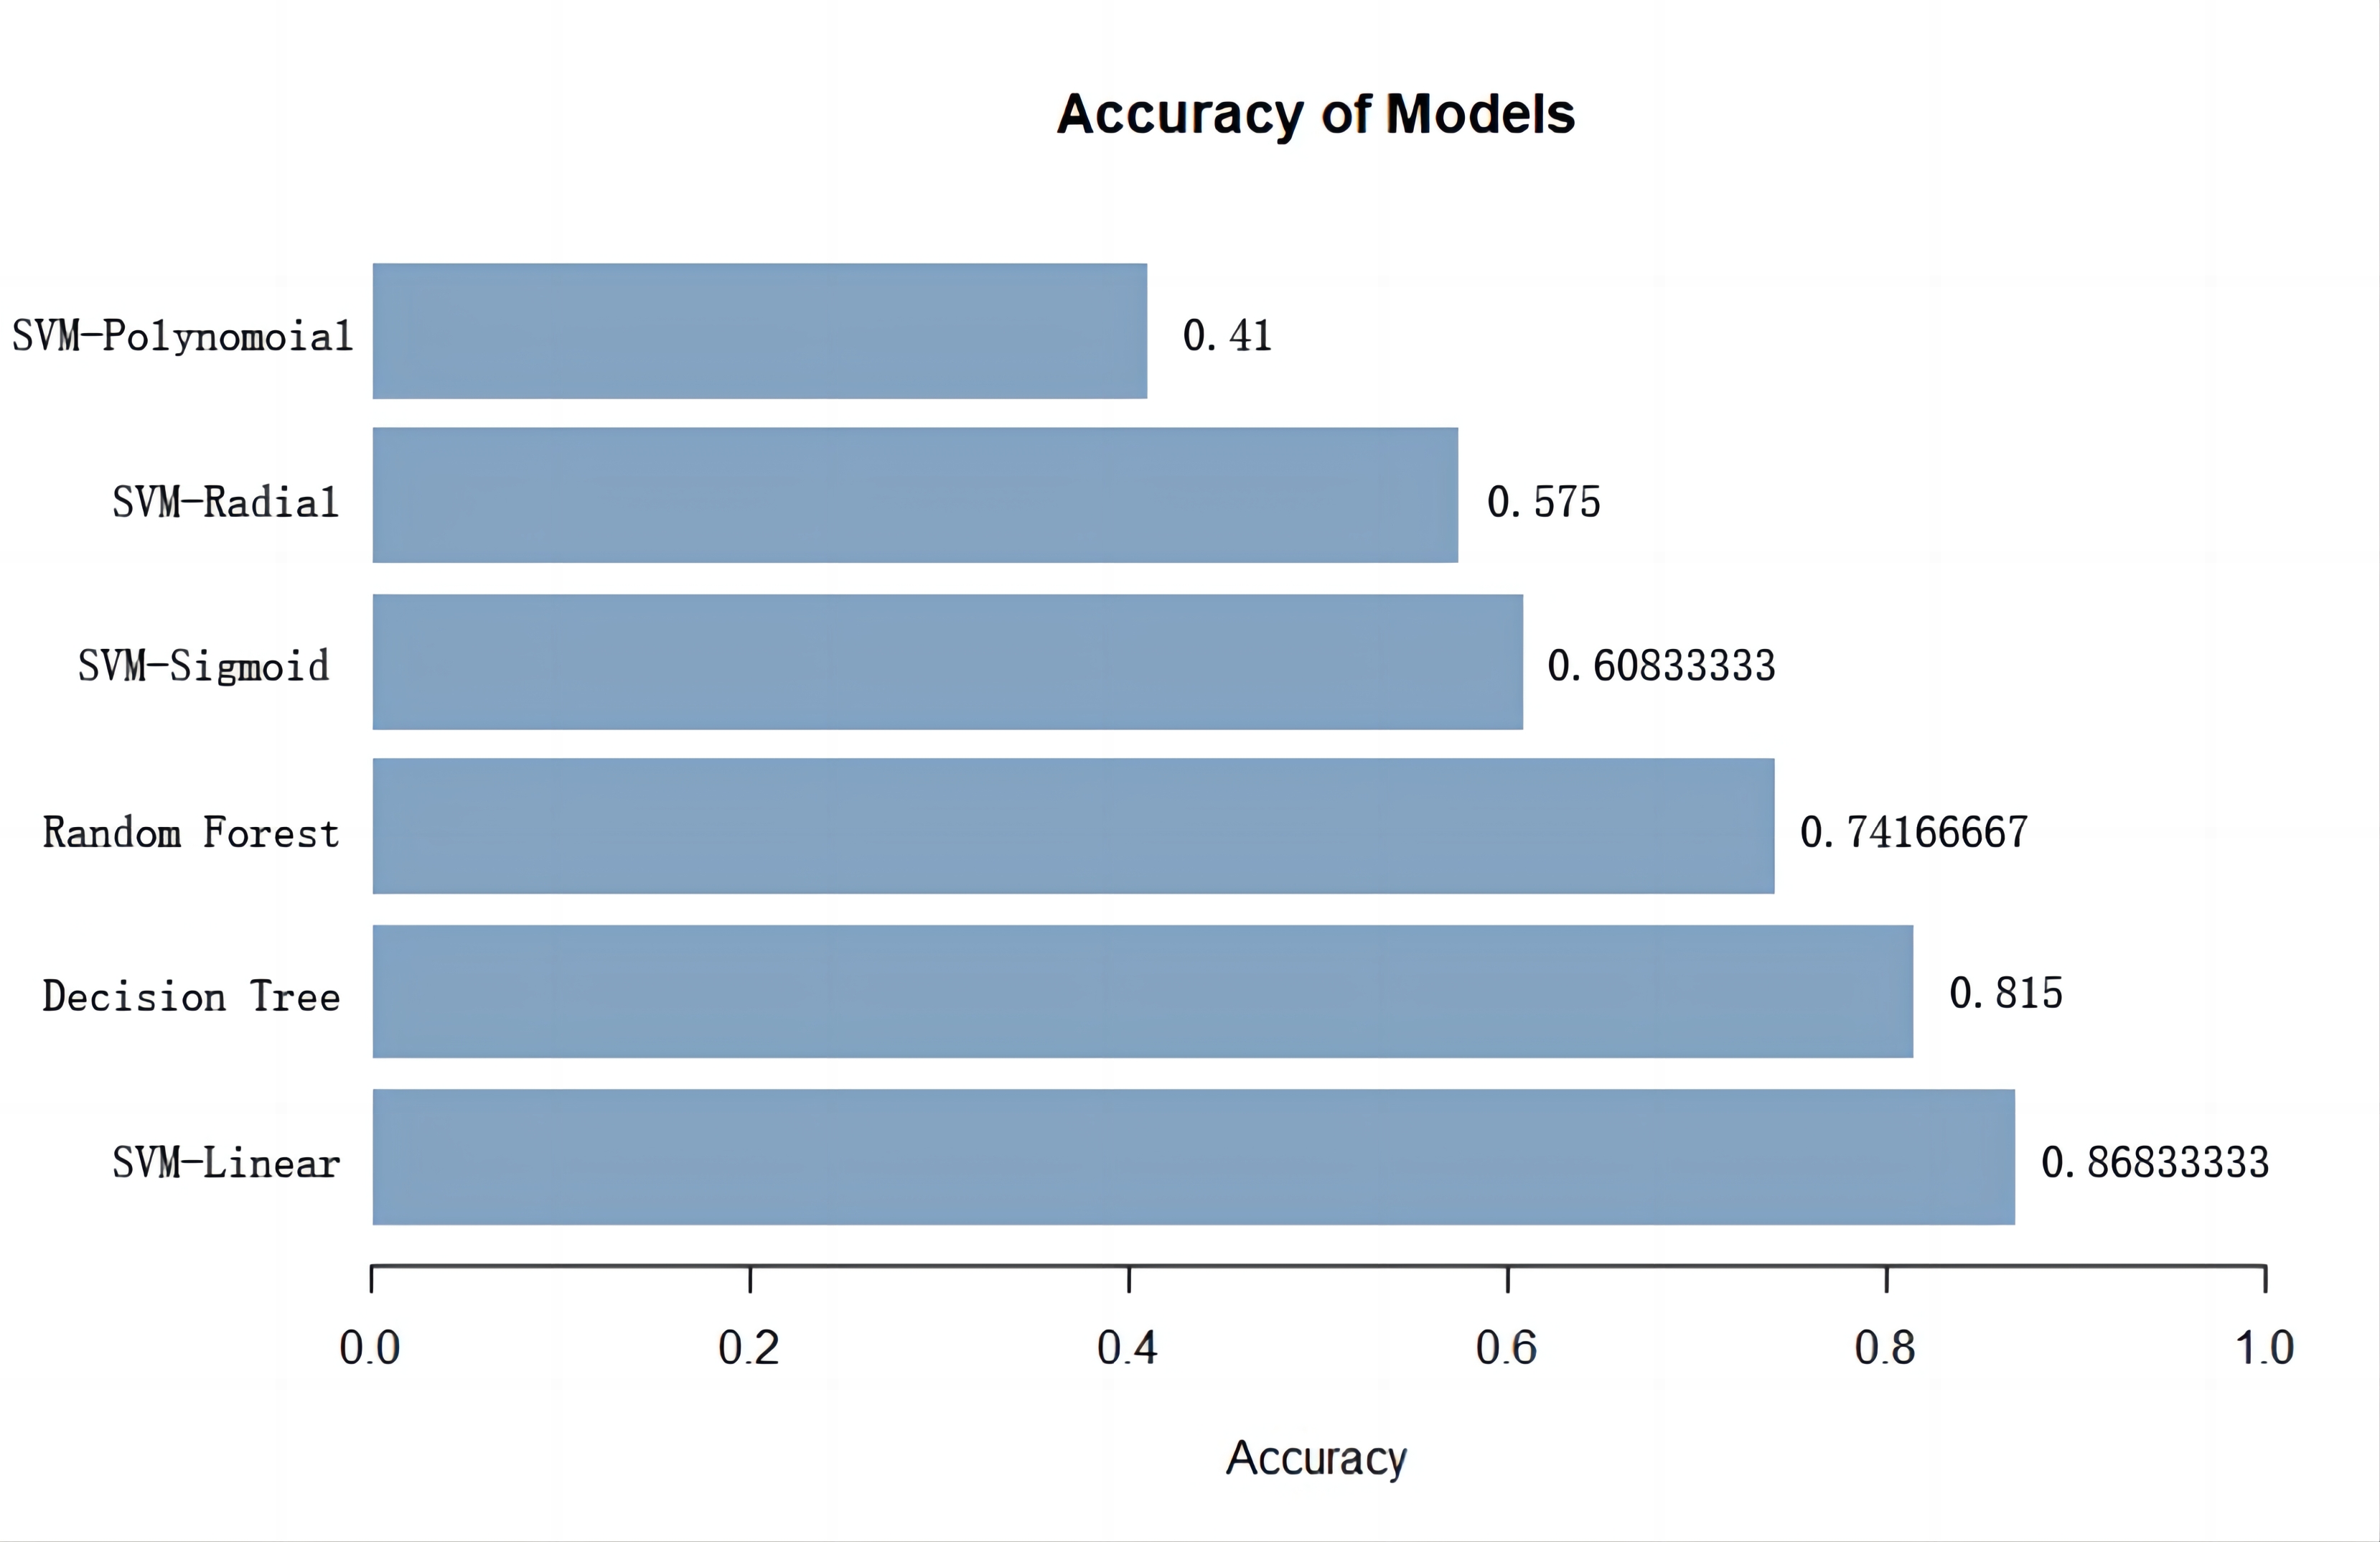
The pipeline of image preprocessing was shown in Figure 1. In group comparisons as shown in Fig. 2, T1 relaxation time of left and right Putamen and the left and right pallidum in the striatum was significantly greater in the DLD group than in the ASD group. For the T2 relaxation time, there were no significant differences between the two groups. In the Receiver operating characteristic (ROC) analyses of the significant indicator in Fig. 3, the largest area under the curve (AUC) is 0.7878 from T1 of right Putamen.In the comparison of the performance of the six machine learning models (Fig. 4), SVM with linear kernel has the highest accuracy of 0.868 in the classification of ASD and DLD groups.
Conclusions
Quantitative parameters in Synthetic MRI, especially T1 relaxation time in the striatum, is significantly increased in DLD, which may indicate impairment in neuronal densification processes. T1 relaxation time is correlated with myelination and lipid concentration and is considered to be one of the markers of brain maturity[7], indicating that DLD has more obvious striatum damage than ASD and maybe related to the decreased language ability.The machine learning model of SVM with linear kernel and Decision tree based on Synthetic MRI has a better performance than simple parameters in Synthetic MRI in the classification of ASD and DLD. The differentiation performance is improved by using machine learning. Future study with machine learning based on multimodal magnetic resonance may be more beneficial for diagnoses.
Acknowledgements
No acknowledgement.References
1. Bjørk, M.H., et al., Association of Prenatal Exposure to Antiseizure Medication With Risk of Autism and Intellectual Disability. JAMA Neurol, 2022. 79(7): p. 672-681.
2. Hedger, N., I. Dubey, and B. Chakrabarti, Social orienting and social seeking behaviors in ASD. A meta analytic investigation. Neurosci Biobehav Rev, 2020. 119: p. 376-395.
3. Norbury, C.F., et al., The impact of nonverbal ability on prevalence and clinical presentation of language disorder: evidence from a population study. J Child Psychol Psychiatry, 2016. 57(11): p. 1247-1257.
4. Courchesne, E., R. Carper, and N. Akshoomoff, Evidence of brain overgrowth in the first year of life in autism. Jama, 2003. 290(3): p. 337-44.
5. Mayes, A.K., S. Reilly, and A.T. Morgan, Neural correlates of childhood language disorder: a systematic review. Dev Med Child Neurol, 2015. 57(8): p. 706-17.
6. Pelphrey, K.A., et al., Research review: Constraining heterogeneity: the social brain and its development in autism spectrum disorder. J Child Psychol Psychiatry, 2011. 52(6): p. 631-44.
7. Schneider, J., et al., Evolution of T1 Relaxation, ADC, and Fractional Anisotropy during Early Brain Maturation: A Serial Imaging Study on Preterm Infants. AJNR Am J Neuroradiol, 2016. 37(1): p. 155-62.
Figures