2509
Brain Network Topology: The Missing Link Between Early Childhood Screen Time Utilization and Executive Function Performance1Diagnostic Imaging, National University Hospital, Singapore, Singapore, 2Diagnostic Imaging, National University of Singapore, Singapore, Singapore, 3Translational Neuroscience, Singapore Institute for Clinical Sciences, Singapore, Singapore, 4Singapore Institute for Clinical Sciences (SICS), Singapore, Singapore, 5Diagnostic Imaging, National University Hospital, SIngapore, Singapore, 6National University of Singapore, Singapore, Singapore, 7National University Hospital, Singapore, Singapore, 8Liggins Institute, Auckland, New Zealand
Synopsis
Keywords: Normal development, Brain Connectivity
Excessive screen time utilization in childhood has been linked to executive dysfunction. Our primary aim was to investigate the potential influence of screen time in early childhood on brain network topology and later executive function (EF). We collected data on screen time (between ages 0-4 years) (n = 950), followed by MRI brain at age 6 (n = 414) and assessment of executive function at age 7 (n = 620). Screen time in early childhood was significantly associated with emotion processing-cognitive control network integration which mediates the effect of screen time on EF performance.Introduction
Excessive screen time utilization in childhood has been linked to executive dysfunction (1–7). The boundary conditions of this association and the pathway through which screen time might influence executive functioning however remains largely unknown. To address these knowledge gaps, we utilized the Differential Susceptibility to Media effects Model (DSMM)(8) as our theoretical framework. The DSMM posits that media effects can be explained by a combination of three response states: cognitive, emotional and excitatory responses (8). In this study we focused on brain networks closely related to these three media response states; the emotion processing network, cognitive control network and reward processing network. Variations in these brain networks can be conceptualized as mediating variables between screen time and executive dysfunction. The DSMM also proposed that the effects of screen time can be moderated by developmental, dispositional, and social factors (8). As such, these factors provide pivotal guidelines defining susceptibility to the effects of screen time. In this study we focused on sex as a potential dispositional susceptibility factor.Objectives
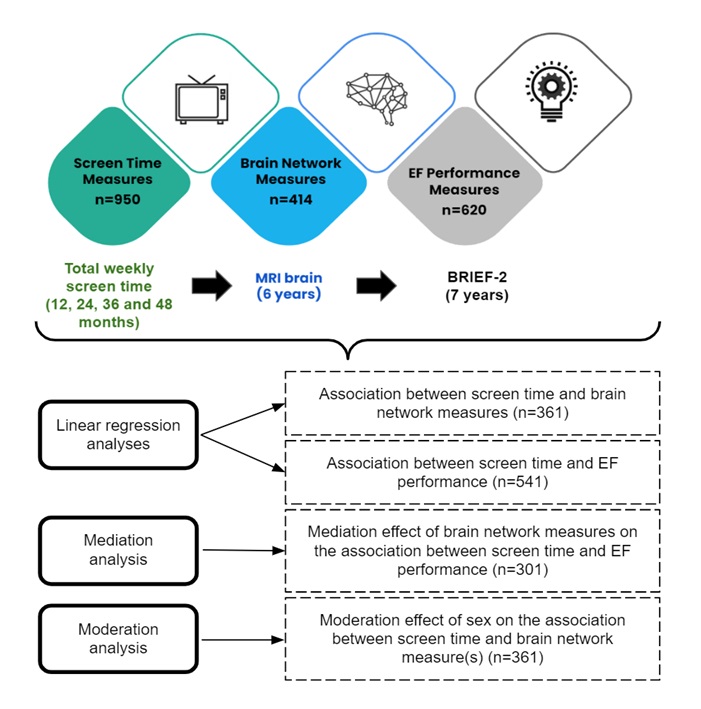
Our primary aim was to investigate the potential influence of screen time in early childhood on brain network topology and later executive function (EF). There is increasing evidence to suggest that brain maturation is characterized by continuous reconfiguration of brain networks(9) and that the trajectory of brain network reconfiguration could be altered by environmental exposures (10–13). Our secondary aim was to investigate whether sex had a moderating effect on the association between screen time and brain network topology. We addressed the following hypotheses in our study: (1) Screen time in early childhood is significantly associated with brain network topology at age 6 years. (2) Screen time in early childhood is significantly associated with later EF performance. (3) The effect of screen time in early childhood on later EF performance is mediated by variations in brain network topology. (4) The effect of screen time in early childhood on brain network topology is significantly moderated by sex. Our study design and analytical approach are illustrated in Figure 1.Methods
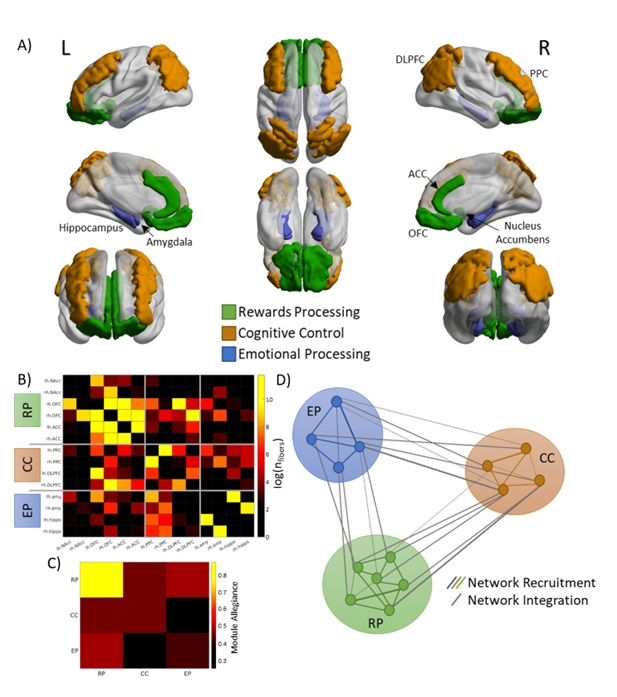
Data from the deeply-phenotyped Growing Up in Singapore Towards healthy Outcomes (GUSTO) birth cohort was used for our analyses. Data on average weekly screen time were collected at ages 12, 24, 36 and 48 months (n = 950). The World Health Organization (WHO) recommends no screen time for infants and toddlers under 2 years and no more than one hour of screen time a day for those aged 2 to 4 years. On this basis, we stratified our screen time measures into ‘screen time =/< 2 years’ and ‘screen time between 3-4 years’ to examine the developmental susceptibility of STU. Diffusion MRI was performed at age 6 years (n = 414) and used to generate a structural connectivity matrix for each participant. Recruitment and integration coefficients (measures of network topology) for the emotion processing, cognitive control and reward processing networks were then computed based on the graph model (Figure 2). The graph model can reliably quantify brain networks with a small number of neurobiologically meaningful measures(14–17) and is used extensively in neuroimaging research as a methodological tool to examine brain network topology(17–19). Executive function performance was assessed at age 7 years using the Behaviour Rating Inventory of Executive Function- 2nd Edition; BRIEF-II (n = 620). We fitted a linear regression model to investigate the association between (i) screen time and brain network measures and (ii) screen time and EF performance in later childhood. Sex and latent environment factor were included as covariates for all models. Brain network measure(s) which were significantly associated with screen time were further examined with a standard three-variable mediation analysis to investigate the extent to which the association between screen time and EF performance in later childhood is mediated by brain network topology. Lastly, we fitted a linear regression model with added interaction terms between screen time and sex to test for moderation.Results
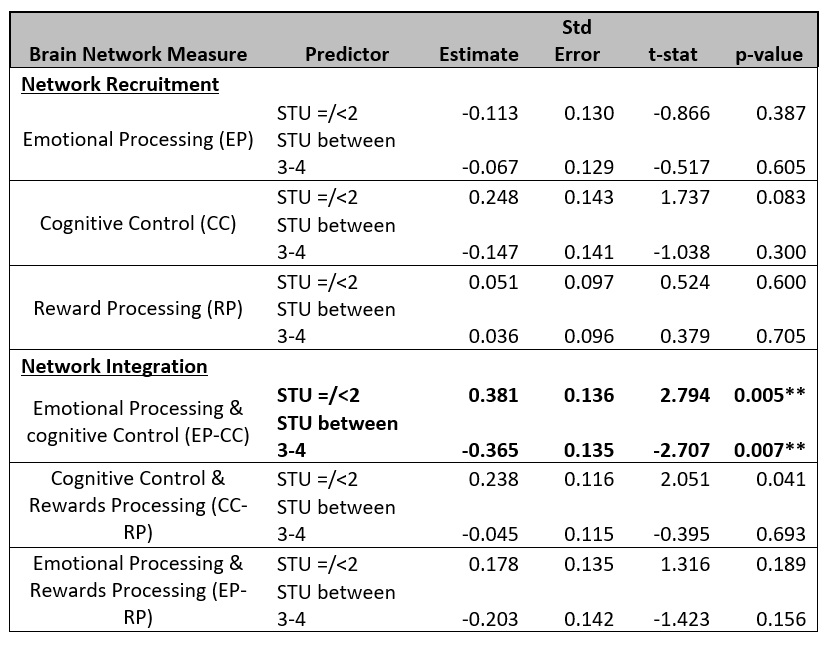
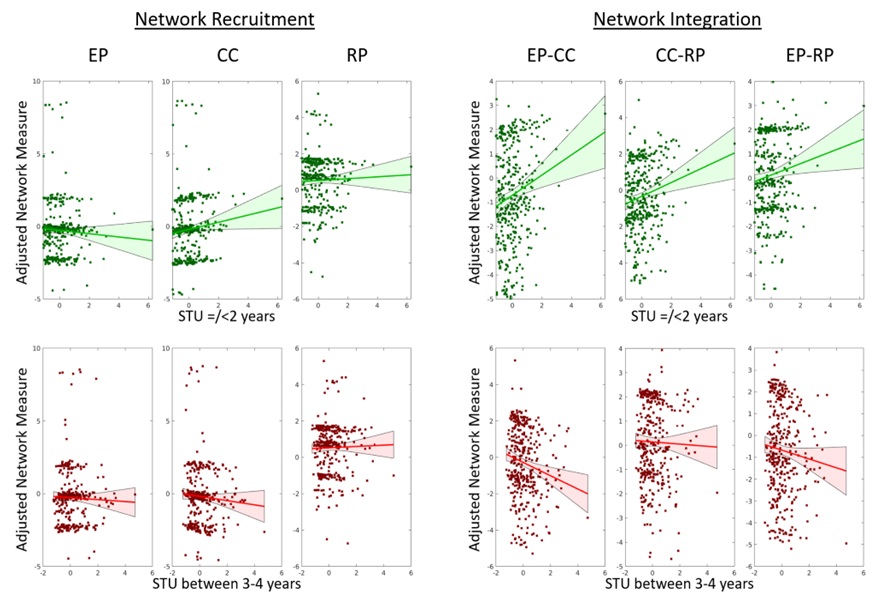
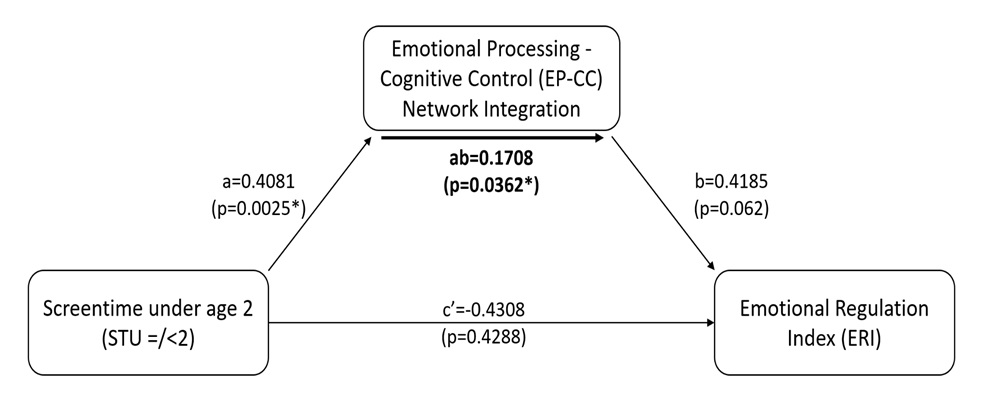
Screen time =/< 2 years (β = 0.381, p = 0.005) and STU between 3-4 years (β = -0.365, p = 0.007) were significantly associated with emotion processing-cognitive control network integration but in opposite directions (Table 1, Figure 3). We observed no direct effect of screen time on BRIEF-2 Emotion Regulation Index (ERI). However, there is a significant indirect effect of screen time =/< 2 years on BRIEF-2 ERI through variations in emotion processing-cognitive control network integration (Figure 4). Sex was not a significant moderator of the screen time-brain network topology association.Conclusions
Our findings provided a plausible biological pathway (variations in emotion processing-cognitive control network integration) that links screen time in early childhood and later executive function performance and suggested that changes in brain network topology in relation to screen time are dependent on the stage of brain development, in keeping with DSSM’s propositions on developmental susceptibility. Our study is the first to link screen time in early childhood, brain network topology and EF performance in a longitudinal manner, extending beyond prior small cross-sectional studies and strengthens a growing body of literature on the impact of screen time in early childhood.Acknowledgements
This research was supported by grants NMRC/TCR/004-NUS/2008 and NMRC/TCR/012-NUHS/2014 from the Singapore National Research Foundation under the Translational and Clinical Research Flagship and grant OFLCG/MOH-000504 from the Open Fund Large Collaborative Grant Programmes and administered by the Singapore Ministry of Health’s National Medical Research Council, Singapore. Additional funding was provided by the Singapore Institute for Clinical Sciences, Agency for Science Technology and Research, Singapore. MJM is supported by funding from the Hope for Depression Research Foundation, USA, and the Jacobs Foundation, Switzerland.References
1. Lissak G. Adverse physiological and psychological effects of screen time on children and adolescents: Literature review and case study. Environ Res. 2018 Jul;164:149–57.
2. Swing EL, Gentile DA, Anderson CA, Walsh DA. Television and video game exposure and the development of attention problems. Pediatrics. 2010 Aug;126(2):214–21.
3. Nikkelen SWC, Valkenburg PM, Huizinga M, Bushman BJ. Media use and ADHD-related behaviors in children and adolescents: A meta-analysis. Dev Psychol. 2014 Sep;50(9):2228–41.
4. Weiss MD, Baer S, Allan BA, Saran K, Schibuk H. The screens culture: impact on ADHD. Atten Defic Hyperact Disord. 2011 Dec;3(4):327–34.
5. Vohr BR, McGowan EC, Bann C, Das A, Higgins R, Hintz S, et al. Association of High Screen-Time Use With School-age Cognitive, Executive Function, and Behavior Outcomes in Extremely Preterm Children. JAMA Pediatr. 2021 Oct 1;175(10):1025–34.
6. Lillard AS, Peterson J. The immediate impact of different types of television on young children’s executive function. Pediatrics. 2011 Oct;128(4):644–9.
7. Nathanson AI, Aladé F, Sharp ML, Rasmussen EE, Christy K. The relation between television exposure and executive function among preschoolers. Dev Psychol. 2014 May;50(5):1497–506.
8. Valkenburg PM, Peter J. The differential susceptibility to media effects model. J Commun. 2013 Apr;63(2):221–43.
9. Gonzalez-Escamilla G, Muthuraman M, Chirumamilla VC, Vogt J, Groppa S. Brain Networks Reorganization During Maturation and Healthy Aging-Emphases for Resilience. Front Psychiatry. 2018 Nov 21;9:601.
10. De Asis-Cruz J, Kapse K, Basu SK, Said M, Scheinost D, Murnick J, et al. Functional brain connectivity in ex utero premature infants compared to in utero fetuses. Neuroimage. 2020 Oct 1;219:117043.
11. Gupta A, Mayer EA, Acosta JR, Hamadani K, Torgerson C, van Horn JD, et al. Early adverse life events are associated with altered brain network architecture in a sex- dependent manner. Neurobiol Stress. 2017 Dec;7:16–26.
12. Elton A, Tripathi SP, Mletzko T, Young J, Cisler JM, James GA, et al. Childhood maltreatment is associated with a sex-dependent functional reorganization of a brain inhibitory control network. Hum Brain Mapp. 2014 Apr;35(4):1654–67.
13. Choi J, Jeong B, Rohan ML, Polcari AM, Teicher MH. Preliminary evidence for white matter tract abnormalities in young adults exposed to parental verbal abuse. Biol Psychiatry. 2009 Feb 1;65(3):227–34.
14. Sporns O, Zwi JD. The small world of the cerebral cortex. Neuroinformatics. 2004;2(2):145–62.
15. Achard S, Salvador R, Whitcher B, Suckling J, Bullmore E. A resilient, low-frequency, small-world human brain functional network with highly connected association cortical hubs. J Neurosci. 2006 Jan 4;26(1):63–72.
16. He Y, Chen ZJ, Evans AC. Small-world anatomical networks in the human brain revealed by cortical thickness from MRI. Cereb Cortex. 2007 Oct;17(10):2407–19.
17. Hagmann P, Cammoun L, Gigandet X, Meuli R, Honey CJ, Wedeen VJ, et al. Mapping the structural core of human cerebral cortex. PLoS Biol. 2008 Jul 1;6(7):e159.
18. Bullmore E, Barnes A, Bassett DS, Fornito A, Kitzbichler M, Meunier D, et al. Generic aspects of complexity in brain imaging data and other biological systems. Neuroimage. 2009 Sep;47(3):1125–34.
19. Sporns O, Chialvo DR, Kaiser M, Hilgetag CC. Organization, development and function of complex brain networks. Trends Cogn Sci (Regul Ed). 2004 Sep;8(9):418–25.
Figures