2508
Clinical significance of leakage corrected hemodynamic parameters computed from DCE-MRI on quantitative glioma grading1Indian Institute of Technology Delhi, New Delhi, India, 2Johns Hopkins University, Baltimore, MD, United States, 3Fortis Memorial Research Institute, Gurugram, India, 4Philips Innovation Campus, Bengaluru, India, 5Cincinnati Children's Hospital Medical Center, Cincinnati, OH, United States, 6All India Institute of Medical Sciences, New Delhi, India
Synopsis
Keywords: Tumors, DSC & DCE Perfusion
Absolute quantification of cerebral-blood-volume (CBV) and cerebral-blood-flow (CBF) from dynamic-susceptibility-contrast (DSC)-MRI has shown wide clinical applications. Recent developments in dynamic-contrast-enhanced (DCE)-MRI have shown computation of CBV and CBF along with permeability information with and without model dependent analyses. The model free approach computed CBV and CBF with inherent leakage information and it is still unclear about the clinical significance of leakage correction. So this study is designed to evaluate the impact of leakage correction of CBV and CBF into glioma grading. Results of the study shows that leakage correction underperformed in terms of noise sensitivity and quantitatively differentiating glioma.Introduction
The initial step towards computing cerebral-blood-volume(CBV) using MRI was applying the central volume theorem to dynamic-susceptibility-contrast(DSC)-MRI data. Later on, attempts have been made to quantify cerebral-blood-flow(CBF) from DSC-MRI data using multiple approaches1–3. Different leakage correction methods were also implemented for absolute quantification of these parameters, which later exhibited numerous clinical applications towards brain tumor characterization and prediction. But, there is a lack of reliable methods to mitigate the errors due to loss in susceptibility contrasts from DSC-MRI data. In general, dynamic-contrast-enhanced-(DCE)-MRI has been used for the quantification of permeability information. Recent advancements in DCE-MRI have made attempts to quantify CBV and CBF along with permeability information from the DCE-MRI data using a model free as well as compartmental model analyses4,5. Model free analysis computes CBV and CBF with inherent leakage profile. On the other hand, compartmental-tissue-uptake-model(CTUM) computes absolute CBF by fitting a 2-compartmental model to DCE-MRI data. However, it is still unclear about the clinical significance of leakage corrected CBV and CBF computed from DCE-MRI data for brain tumor(glioma) characterization. So this study is designed to implement a leakage correction method to the model-free approach from DCE-MRI data for the absolute quantification of CBV and CBF and compare it with the CTUM derived parameters to evaluate the impact of leakage correction in differentiating low-grade-glioma(LGG) and high-grade-glioma(HGG).Methods
In the current study, we have utilized Patlak-model(PM) for deriving leakage profile of CBV and CBF from the first-pass(FP) data and this profile was used to negate the leakage contribution as a 3-step process as shown in figure-1.i. Fit PM to FP C(t):
According to PM, tissue concentration curve(CPM(t)) is given as:
$$C_{PM}(t) = v_p C_p + v_p C_p + \lambda ^{trans}\int_{t1}^{tFP}C_{p}(\tau )d\tau $$ (1) Where, vp is the plasma volume fraction, λtrans is volume transfer constant between plasma and leakage space, t1 is the bolus arrival time (BAT), TFP is the final time point of the FP curve, and Cp is the arterial-input-function(AIF). Here, FP is the time taken by the CA to complete one cycle. In the current study, FP constituted of ~8 time points(less than 30 seconds)) to derive vp and λtrans..
ii. Leakage profile computation:
Compute the leakage profile (CLS) by substituting λtrans. computed from step-i as given below (from Eq. (1)):
$$ C_{LS}(t) = \lambda ^{trans} \int_{t1}^{tFP}C_{p}(\tau )d\tau $$ (2)
Subtract CLS(t) from the PM fitted C(t) (step-i) to compute intravascular contrast concentration (CIPS(t))
C(t) = CPM(t) - CLS(t) (3)
iii. Computation of leakage corrected CBV and CBF:
According to FP theory, CBV and CBF can be computed from Eq. (4) and Eq. (5)
$$ CBV = \frac{h.\int_{t1}^{tFP}C(t)}{\rho C{p}(t)} $$ (4)
$$C(t) = \frac{\rho }{h}. CBF. (C{p}(t)\circledast R(t))$$ (5)
Compute leakage corrected CBV and CBF (CBV_Corr, CBF_Corr) by substituting CIPS(t) for C(t) in the above equations.
To compare the efficacy of leakage corrected CBV and CBF(CBV_Corr, CBF_Corr), CBV_Corr was compared with PM derived vp and CBF_Corr was compared with CTUM derived blood flow (Fp)(Eq. (2).
This retrospective study comprised DCE-MRI data of 83(45 HGG and 38 LGG) treatment naïve histologically confirmed glioma subjects. The detailed image acquisition protocol is mentioned elsewhere6. All parameters were normalized with respect to healthy white matter (WM) regions to compute relative parameters. Monte-Carlo simulations, t-test and ROC analysis were used for noise sensitivity, parameter comparison and glioma grading respectively.
Results and Discussion
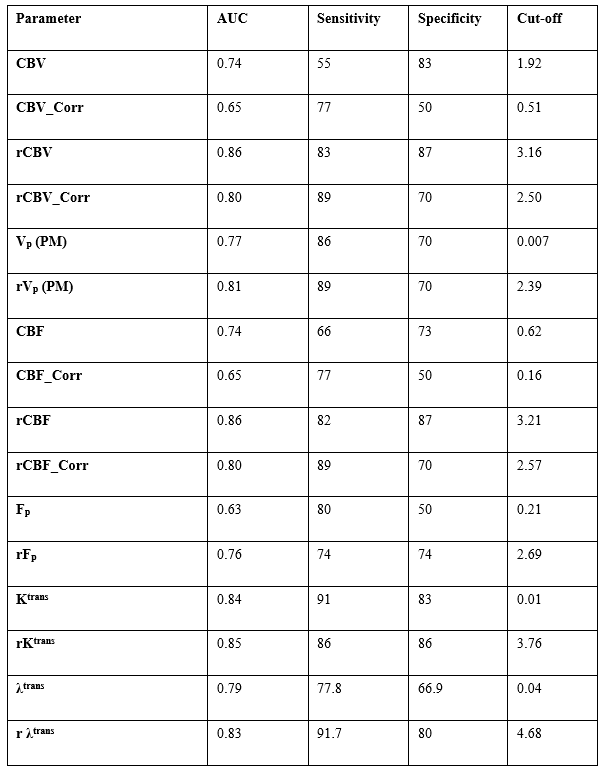
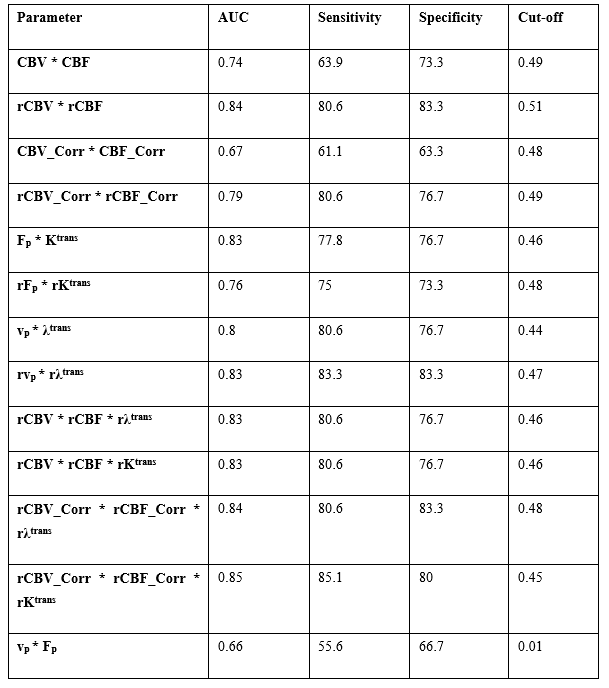
Figure-2 shows the hemodynamic parameters with and without leakage correction. CBV and CBF were found to be more stable to noise conditions than leakage corrected parameters(CBV_Corr and CBF_Corr) as shown in figure-3. While grading, relative (normalized) parameters have performed better than absolute parameters(table-1). Relative CBV(rCBV) and rCBV_Corr has produced AUC 0.85 and 0.8 with sensitivity 83% and 89% and specificity 87 and 70% respectively. Similarly , rCBF and rCBF_Corr has produced 82% and 89% sensitivity, and 87% and 70% specificity respectively for with AUC 0.85 and 0.8. rCBV and rCBF has also outperformed the combination of absolute flow and permeability(table-2) computed from FP analysis as well as CTUM.Results from the current study show that statistically significant and reliable leakage correction was possible from all tissue regions for CBV and CBF measurements. However, the leakage correction has reduced the grading accuracy. Assuming a two-compartmental model for FP analysis, CBV is a combination of vp and ve, and CBF is a combination of Fp and PS(Ktrans/λtrans). However, leakage correction is expected to compute separate vp and Fp from ve and PS respectively. However, this complicated post-processing is in turn downgrading the performance of glioma grading. Also, the FP CBV and CBF have shown improved accuracy when compared to the combination of separated components(Fp and Ktrans, and vp and ve) using a machine learning approach(logistic regression based). However, since CBV and CBF can be estimated from the data length less than 1 minute, it is computationally effective and causes less data acquisition time.
Conclusion
CBV and CBF computed using model-free FP analysis consisted of statistically significant amount of leakage contribution in all tissue regions. However, the absolute parameters have underperformed when compared to CBV and CBF(with leakage information) while differentiating LGG and HGG. In conclusion, leakage correction of hemodynamic parameters computed from DCE-MRI data doesn’t aid in glioma grading.Acknowledgements
Science and Engineering Research Board, Department of Science and Technology projects: YSS/2014/000092 and CRG/2019/005032
References
1. Boxerman JL, Schmainda KM, Weisskoff RM. Relative Cerebral Blood Volume Maps Corrected for Contrast Agent Extravasation Significantly Correlate with Glioma Tumor Grade, Whereas Uncorrected Maps Do Not. Accessed August 21, 2021. www.ajnr.org
2. Boxerman JL, Prah DE, Paulson ES, Machan JT, Bedekar D, Schmainda KM. The Role of Preload and Leakage Correction in Gadolinium-Based Cerebral Blood Volume Estimation Determined by Comparison with MION as a Criterion Standard. doi:10.3174/ajnr.A2934
3. Toh CH, Wei KC, Chang CN, Ng SH, Wong HF. Differentiation of Primary Central Nervous System Lymphomas and Glioblastomas: Comparisons of Diagnostic Performance of Dynamic Susceptibility Contrast-Enhanced Perfusion MR Imaging without and with Contrast-Leakage Correction. American Journal of Neuroradiology. 2013;34(6):1145-1149. doi:10.3174/AJNR.A3383
4. Singh A, Haris M, Rathore D, et al. Quantification of Physiological and Hemodynamic Indices Using T 1 Dynamic Contrast-Enhanced MRI in Intracranial Mass Lesions. 2007;880:871-880. doi:10.1002/jmri.21080
5. Sourbron S, Ingrisch M, Siefert A, Reiser M, Herrmann K. Quantification of cerebral blood flow, cerebral blood volume, and blood-brain-barrier leakage with DCE-MRI. Magn Reson Med. 2009;62(1):205-217. doi:10.1002/mrm.22005
6. Sasi S D, Gupta RK, Patir R, Ahlawat S, Vaishya S, Singh A. A comprehensive evaluation and impact of normalization of generalized tracer kinetic model parameters to characterize blood-brain-barrier permeability in normal-appearing and tumor tissue regions of patients with glioma. Magn Reson Imaging. 2021;83(July):77-88. doi:10.1016/j.mri.2021.07.005
Figures
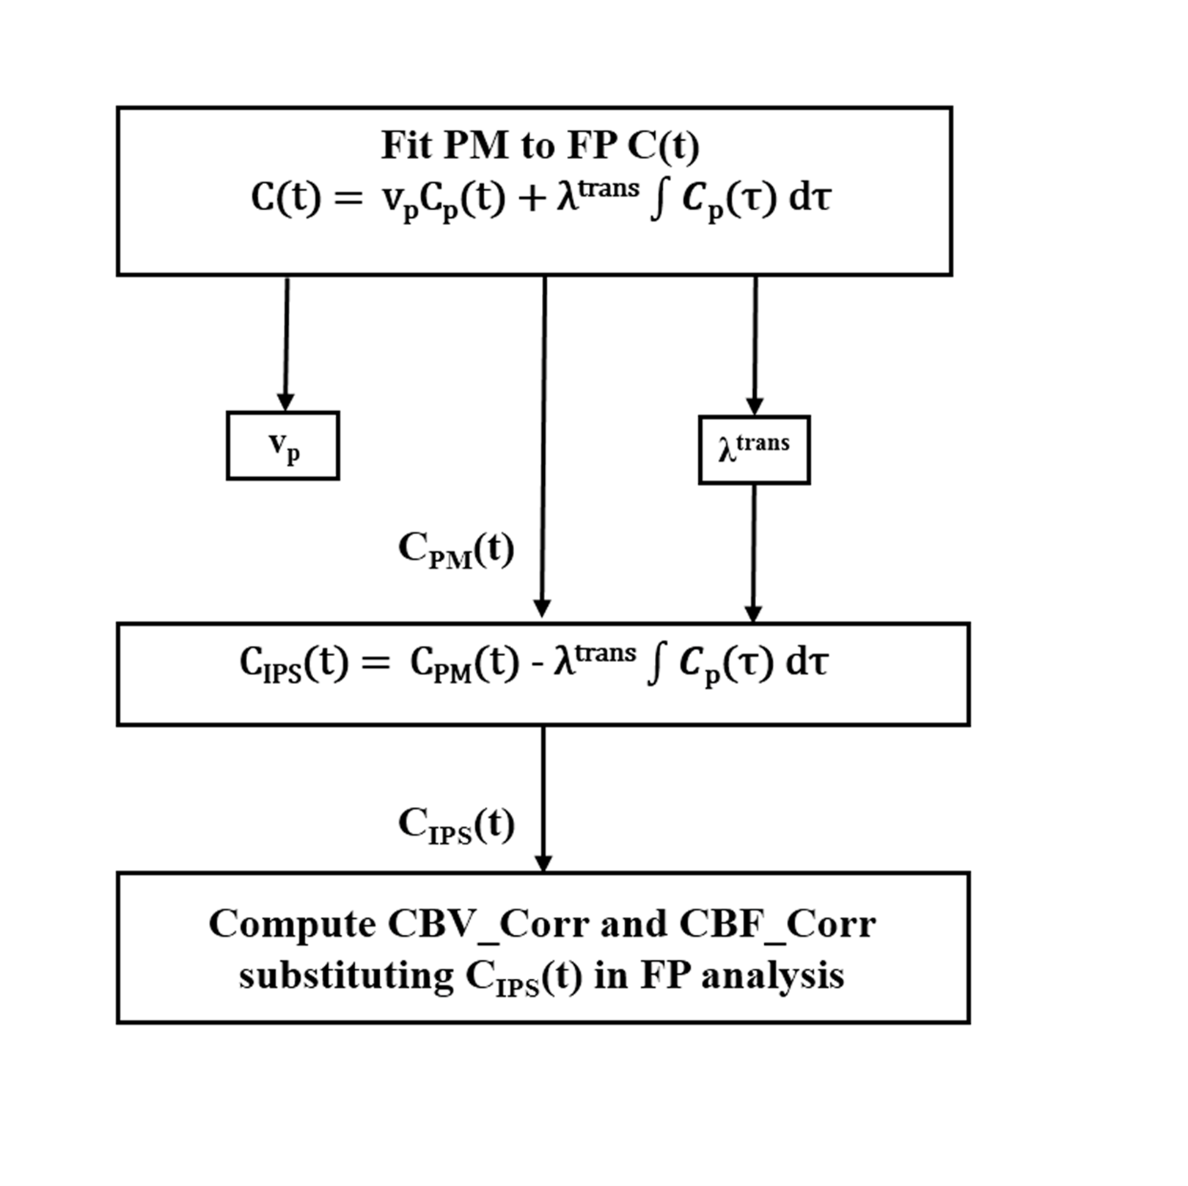
Figure-1: Flow chart representing the leakage correction of CBV and CBF derived from FP analysis. CIPS(t) represents C(t) corresponding to plasma compartment, and CPM(t) represents the PM fit to the FP C(t) of the tissue.
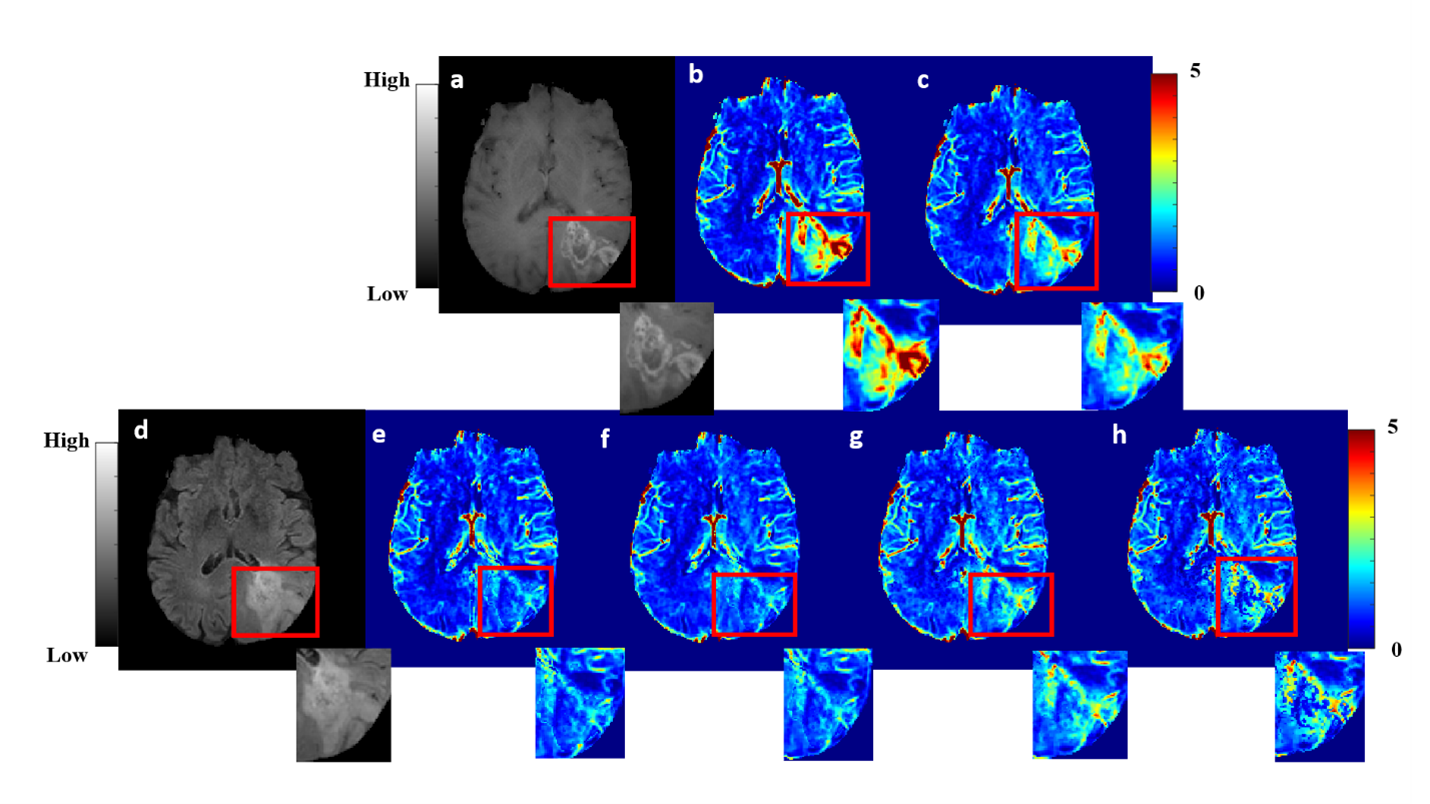
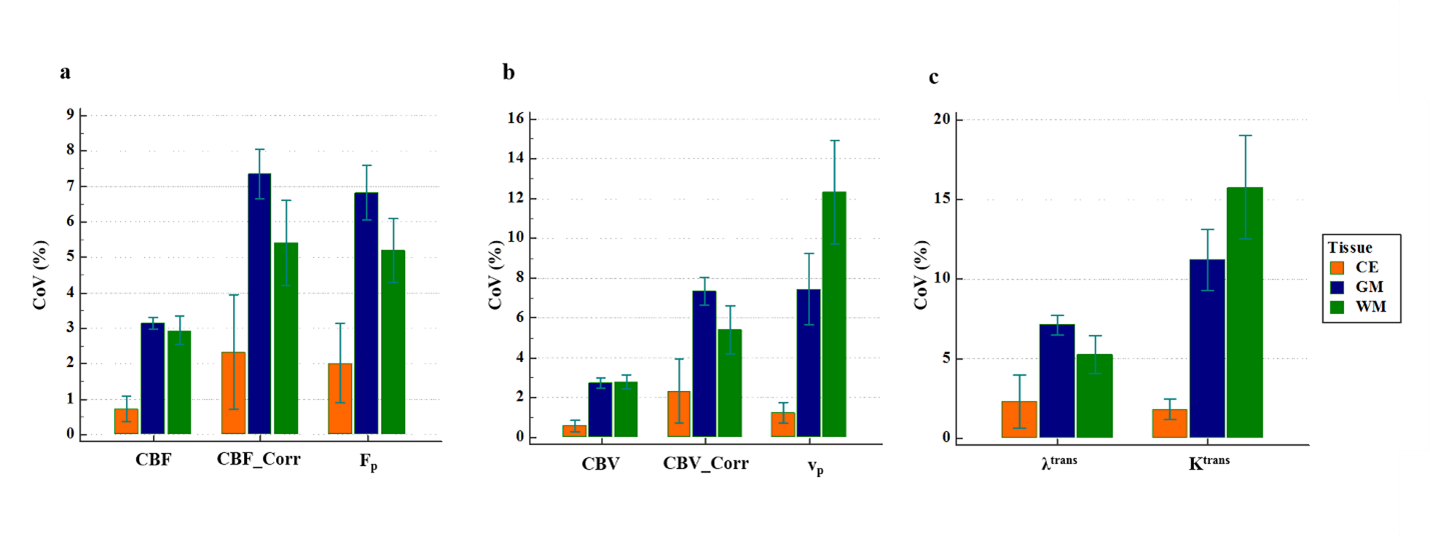
Figure-3: Results of Monte-Carlo simulations at 5% noise level. Plot represents co-efficient of variation (CoV) of (a) CBF, CBF_Corr, Fp, (b) CBV, CBV_Corr, vp,(c) λtrans and Ktrans in contrast enhanced (CE), gray matter (GM) and white matter (WM) regions under the noise conditions for multiple iterations (500)