2507
Combing APT-CEST imaging and NODDI for an early distinction between pure edema and infiltrative tumor in glioma at 7T
Yifan Yuan1, Yang Yu2, Jun Chang1, Ying-Hua Chu3, Yi-Cheng Hsu3, He Wang4, Patrick Alexander Liebig5, Qi Yue1, Liang Chen1, and Ying Mao1
1Department of neurosurgery, Huashan Hospital Fudan University, Shanghai, China, 2Department of radiology, Huashan Hospital Fudan University, Shanghai, China, 3MR Collaboration, Siemens Healthineers Ltd, Shanghai, China, 4Key Laboratory of Computational Neuroscience and Brain-Inspired Intelligence, Fudan University, Shanghai, China, 5MR Collaboration, Siemens Healthineers Ltd, Erlangen, Germany
1Department of neurosurgery, Huashan Hospital Fudan University, Shanghai, China, 2Department of radiology, Huashan Hospital Fudan University, Shanghai, China, 3MR Collaboration, Siemens Healthineers Ltd, Shanghai, China, 4Key Laboratory of Computational Neuroscience and Brain-Inspired Intelligence, Fudan University, Shanghai, China, 5MR Collaboration, Siemens Healthineers Ltd, Erlangen, Germany
Synopsis
Keywords: Tumors, CEST & MT, NODDI
Glioma grows infiltratively along fiber tracts, making it difficult to determine the tumor boundary. Extended resection may impair eloquent brain areas and cause functional disorders, while conservative resection often leaves tumor residues at the cutting edge, leading to early recurrence. This study uses APT-CEST imaging and NODDI to explore glioma's microstructural and metabolic characteristics. We trained a model from 100 biopsies to predict tumor presence in non-enhancing areas. This model shows potential for guiding precise glioma resection and radiotherapy.Introduction
Precise recognition of glioma boundary is the core issue of current treatment, which determines the extent of tumor resection and the delineation of a radiotherapy target volume. In current clinical practice, glioma boundary in non-enhancing areas is mainly judged according to T2-weighted imaging or amino acid PET. However, the T2 hyperintense signal induced by glioma is often too diffuse to distinguish tumor infiltration from associated edema; amino acid PET suffers from insufficient spatial resolution and may not show abnormal signals in some patients. Although the presence of contrast enhancement is a good predictor for tumors, diffuse astrocytomas were often non-enhancing, and glioblastomas still infiltrated beyond the enhanced foci. Therefore, the investigation of glioma boundaries in non-enhancing areas is essential. In this study, we combined the data of APT-CEST imaging and neurite orientation dispersion and density imaging (NODDI[1]) at 7T to predict tumor region and validate imaging predictions with multi-region specimens as the gold standard.Material and Methods
Twenty-nine patients with preoperatively imaging-suspected, histologically-proven gliomas underwent MRI scanning on a 7T system (MAGNETOM Terra; Siemens Healthineers, Erlangen, Germany) and surgical resection or biopsy between December 2020 and March 2022.Patients and imaging protocols
There were 15 glioblastomas (WHO grade 4, IDH-), 6 WHO grade 3 astrocytomas (IDH+), 5 WHO grade 2 astrocytoma (IDH+), and 3 WHO grade 2 oligoastrocytomas (IDH+). A pulsed-gradient spin-echo diffusion-weighted imaging (DWI) data were obtained with TR = 4500 ms, TE = 56.8 ms, 1.5 mm isotropic resolution, two-shell of b-values (b = 1000 and 2000 s/mm2) and 64 directions each b-value. All DWI data were corrected using denoising, topup, and Eddy correction (MrTrix3, https://www.mrtrix.org/). AMICO[2] method was used to estimate the NODDI model with three parameters: intra-axonal, extra-axonal, and isotropic contributions. APT-CEST imaging (TR=3.4ms, TE=1.59ms, FA=6°, resolution=1.6mm x 1.6mm x 5mm, 56 RF offsets, and B1=0.6, 0.75, 0.9mT) were acquired, and data was quantified using the Lorentzian fit method with B1 correction[3].
Surgery and multi-region biopsies
All imaging sequences were imported into the neuro-navigation system (Medtronic S7, USA) and co-registered with contrast-enhanced T1 and T2 (T2 Flair) images. At least three targets from the tumor core, peri-tumor region, and tumor margins were randomly chosen, and the corresponding coordinates were retrieved for further analysis. One hundred samples were collected in this study. Model and statistics We used logistic regression to estimate the tumor probability map based on second-order polynomial features derived from APT-CEST data and NODDI for each voxel. The Receiver Operating Characteristics (ROC) curve was plotted by connecting points with a coordinate of the false positive rate (1 − specificity) and the true positive rate (sensitivity) for the classifiers using various thresholds. We plotted ROC curves to evaluate the diagnostic accuracies of APT-CEST, ICVF, ISOVF, and OD by using biopsy samples as the gold standard of tumor presence.
Results
The AUC of CEST, ICVF, ISOVF, and OD was 0.818, 0.666, 0.531, and 0.550, respectively (Figure 1). Combing APT-CEST and NODDI into a prediction model, the AUC was increased (Figure 2). The T1, T2, CEST, ICVF, and OD maps are shown in Figure 3A. The tumor probability map estimated by APT-CEST and NODDI is shown in Figure 3B. The lesion was located in the right frontal lobe with a high signal in T2, infiltrating through the corpus callosum to the lateral side. A multi-modality-guided neurosurgery was conducted, and several biopsies were taken to validate the model. For APT-CEST and ICVF combined model, in the first biopsy position (Figure 3B), the possibility of tumor presence reached 93.94%, where H&E staining of the biopsy tissue confirmed atypical nuclear accumulation, indicating that the tumor had high proliferative activity. Meanwhile, the second target located in the corpus callosum (Figure 3B), hyperintense in T2, has a medium possibility of 46.14%. H&E staining of the sample indicated slight glial hyperplasia, and no exact tumor cell was observed, which was caused by pure edema.Conclusion
Combining APT-CEST and NODDI can serve as a promising method to distinguish between pure edema and infiltrative tumor in glioma and may further guide treatment strategy for tumor resection and adjacent radiotherapy.Acknowledgements
No acknowledgement found.References
1. Zhang, Hui, et al. "NODDI: practical in vivo neurite orientation dispersion and density imaging of the human brain." Neuroimage 61.4 (2012): 1000-1016.
2. Daducci, A. et al. Accelerated Microstructure Imaging via Convex Optimization (AMICO) from diffusion MRI data. NeuroImage 105, 32–44 (2015).
3. Schuenke P, Windschuh J, Roeloffs V, Ladd ME, Bachert P, Zaiss M. Simultaneous mapping of water shift and B1 (WASABI)—application to field-inhomogeneity correction of CEST MRI data. Magn Reson Med. 2017; 77(2): 571- 580.
Figures
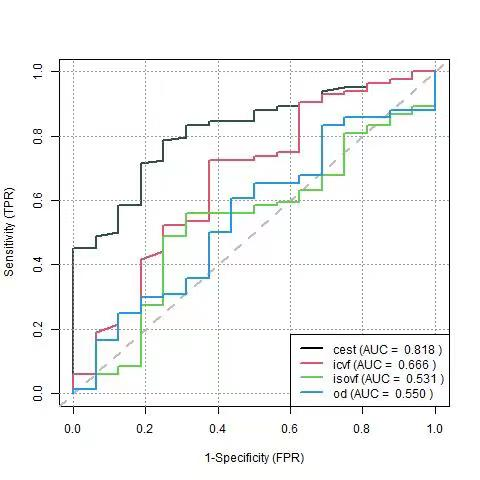
Figure 1. ROC of
single modality in predicting the tumor presence of non-enhancing area
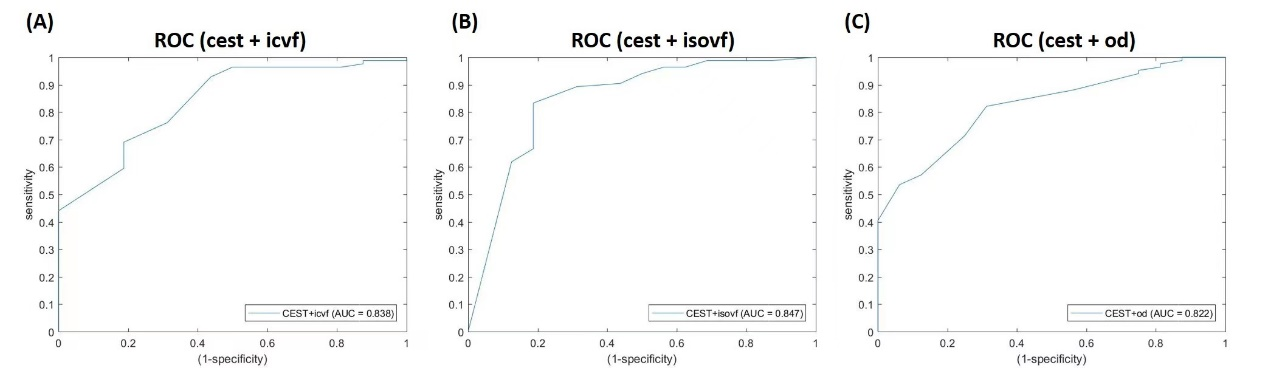
Figure
2. ROC of double modalities in predicting the
tumor presence of non-enhancing area
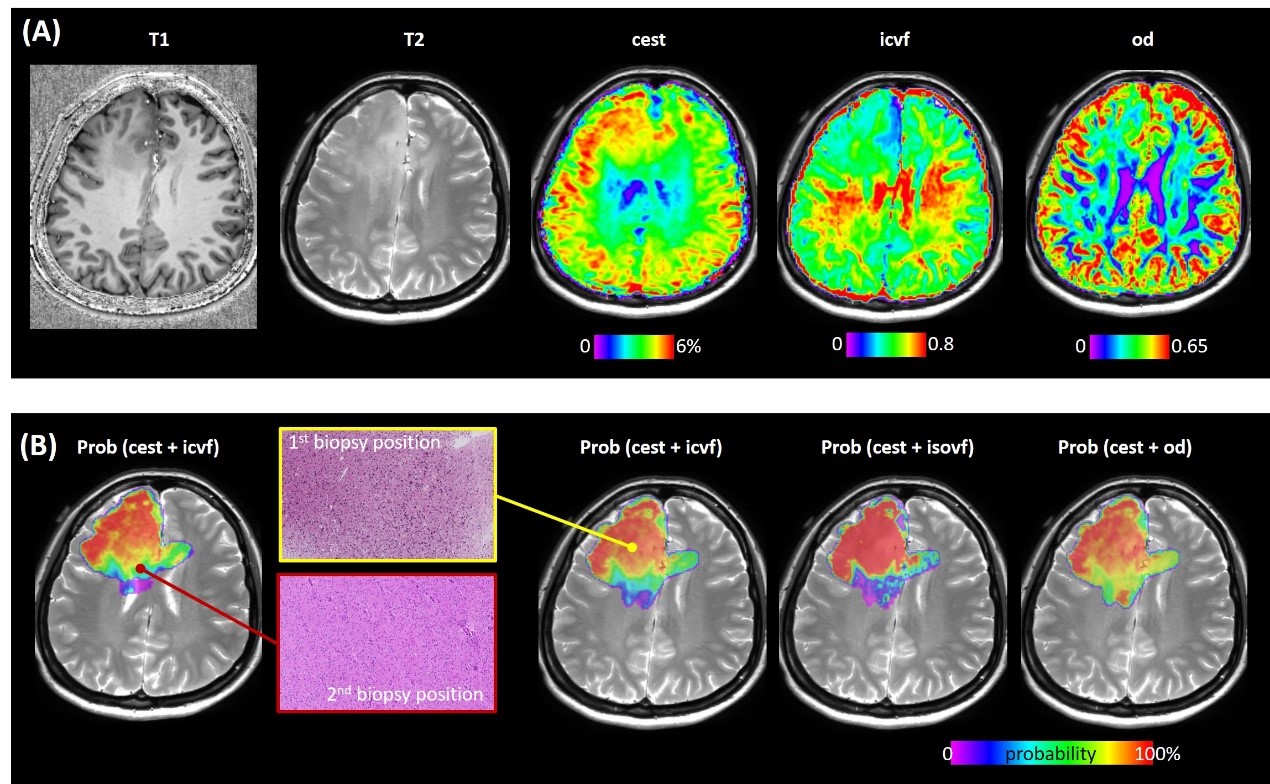
Figure 3. (A) The
T1, T2, CEST, ICVF, and OD maps. (B) The tumor probability map estimated by
APT-CEST and NODDI is shown. The H&E staining of the two biopsies is
located at different slices.
DOI: https://doi.org/10.58530/2023/2507