2505
Initial sensitivity evaluation of a new 19F nanoformulation at 3 Tesla using a novel human head coil1Imaging Physics, The University of Texas MD Anderson Cancer Center, Houston, TX, United States, 2Chemistry, The University of Texas at Austin, Austin, TX, United States
Synopsis
Keywords: Tumors, Cell Tracking & Reporter Genes, immune therapy
In order to track immune cells loaded with 19F compound, a nanoformulation based on iron-doped perfluoro-15-crown-5-ether, called Fe-PFCE was developed for Fluorine-19 MRI. It’s relaxation time was characterized with a custom designed 8 channel Fluorine transmit/receive head coil on clinical 3Tesla MR scanner. Its relaxation time (T1/T2) was 39ms/7ms as comparing to 894ms/196ms nanoformulation based on original (undoped) perfluoro-15-crown-5-ether, called “PFCE”. The SNR/19F-concentration ratio of 1ml Fe-PFCE nanoformulation measured by bSSFP was found to be 53% stronger than that of PFCE. A good signal profile was yielded within the coil receiving field.Introduction
Fluorine-19 MRI (19F-MRI) is a developing imaging modality for cell tracking , which promises good sensitivity and background-free images.1-3 The limit of cell detection/tracking in 19F-MRI is linearly proportional to 19F SNR or the number of fluorine atoms, the imaging sequences, and the coil performance. Because perfluorocarbon (PFC) molecules are F-dense, chemically inert and biocompatible they show promise as nanosized contrast probes for cell labeling, tracking, and non-invasive clinical imaging.4-6 However, most fluorinated compounds hold relatively long 19F T1 relaxation times (>500ms)7, which limits SNR efficiency (SNR/sqrt(t)). To improve SNRe, our team developed a micelle formulation of nanodroplets based on iron-doped perfluoro-15-crown-5-ether coated with the lipids, named Fe-PFCE . We characterized its T1 and T2 relaxation time on clinical 3 Tesla clinical scanner and compared its sensitivity with nanodroplets based on original (undoped) perfluoro-15-crown-5-ether (PFCE), a perfluorocarbon with 20 magnetically equivalent 19F atoms and a single spectroscopic peak.Methods
All MR images were acquired with a custom designed 8-channels 19F head coil on GE 3T MR750 clinical MRI scanner.Phantoms Construction:
(1) Seven NMR tubes were filled with 1ml of aqueous solution of nanodroplets diluted to various concentrations of 19F atoms (1000mM, 500mM, 200mM, 100mM, 50mM, 20mM, 5mM) for both nanoformulations. A 3d printed spherical phantom filled with a lossy solution equal to the electrical conductivity of human tissue was used to mimic patient loading. NMR tubes was placed at the center of the spherical phantom. Power calibration was made with the NMR tubes with 1000mM.
(2) A 3.7L cylindrical phantom containing of 18.75mM trifluoroacetic acid (TFA, Sigma-Aldrich, St. Louis, MO, USA) doped with 1mM MnCl2 (Sigma-Aldrich, St. Louis, MO, USA) was used to quantify coil receiving performance.
All phantoms were equalized to 20°C in the scan room before measurement.
T1/T2 Mapping:
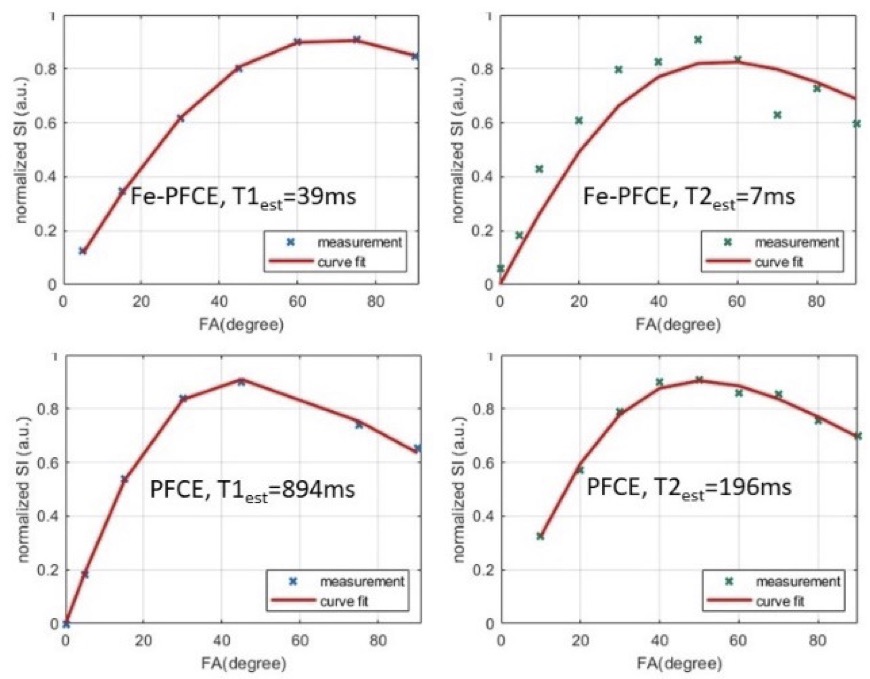
Power calibration was performed with a Bloch-Siegert off-resonance CSI sequence8 with reference phantoms at TR=200ms for the Fe-PFCE and TR=3s for PFCE. T1 mapping was performed using reference phantoms with 1D CSI with variable flip angles (FA = 5, 15, 30, 45, 60, 75, 90 degree) and fit to the T1 signal evolution following a saturation recovery9 , other important acquisition parameters include: Fe-PFCE : TR = 40ms, TE = 0ms, BW = 4kHz, number of points = 128, NEX=30; PFCE: TR = 300ms, TE = 0ms, BW = 4kHz, number of points = 1024, NEX=30. Excitation was carried out using 500ms hard pulse with RF spoiling. Signal was quantified by measuring area under the spectrum within their FWHM. T2 mapping was performed using 1000mM phantoms with a 2D balanced-Steady-State-Free-Procession (bSSFP) at variable FA (=10, 20, … ,90 degrees)10, with TR=21.8ms, TE=1.8ms, FOV=270×270mm2, matrix size = 64×64, slice thickness = 80mm, and NEX = 30 (Fe-PFCE ). Then images and variable FA was fit to bSSFP signal with previously mapped T1 value to derive T2.Determination of SNR/19F-Concentration Ratio:
2D bSSFP with the identical acquisition parameters as described above was used with 500mM and 1000mM for both agents. The flip angle was selected with the one yielded largest SNR during T2 mapping, which was approximately optimized for each agent: FA Fe-PFCE = 50 degree, FAPFCE = 60 degree. The SNR vs 19F concentration was measured with total scan time of 42s each.
19F Coil Sensitivity Profile:
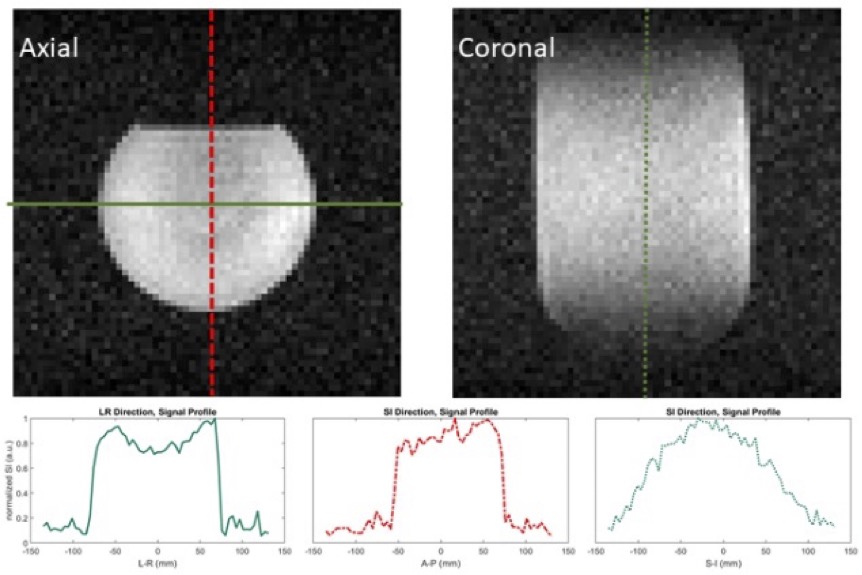
2D bSSFP with the identical acquisition parameters as described above was used with TFA phantom at optimal FA = 60 degree.
Result & Discussion:
Compared to the relaxation time of PFCE, T1 of Fe-PFCE was from894ms to 39ms, and T2 was reduced from 196ms to 7ms, as figure 1 presents. This enables larger SNR/t by performing more relaxed repetitions.Both Fe-PFCE and PFCE nanoformulations contain perfluoro-15-crown-5-ether (iron-doped and undoped, respectively), therefore they were diluted to identical concentrations of 19F atoms. Using the bSSFP sequence, which is known for high SNR efficiency and less sensitive to off resonance11, Fe-PFCE yielded larger SNR than PFCE. The SNR/19F concentration ratio was 53% stronger in Fe-PFCE with respect to that of PFCE, as Figure 2 presents..
The axial and coronal images of TFA phantom demonstrated good signal profile within the coil, as the qualitatively homogeneous images show in Figure 2.
Conclusion
We presented a new strategy for Fluorine-19 MRI including a new PFC formulation of short relaxation time, a SNR efficient imaging sequence with sub-minute scan time, and a one-of-the-kind 8 channels 19F head coil. It is conceivable that the current measurement accuracy and detection limit will be further improved with flip angle optimization and with clinically feasible scan time.Acknowledgements
This work was supported by funding from the Cancer Prevention and Research Institute of Texas (RP200223). The content is solely the responsibility of the authors and does not necessarily represent the official views of the sponsor. We also thank Ralph Hashoian for coil development.References
Immunol. Oct 2013;13(10):755-63. doi: 10.1038/nri3531.
2. Somanchi SS, Kennis BA, Gopalakrishnan V, Lee DA, Bankson JA. In Vivo (19)F-Magnetic Resonance Imaging of Adoptively Transferred NK Cells. Methods Mol Biol. 2016;1441:317-32. doi: 10.1007/978-1-4939-3684-7_27.
3. Jacoby C, Temme S, Mayenfels F, et al. Probing different perfluorocarbons for in vivo inflammation imaging by 19F MRI: image reconstruction, biological half-lives and sensitivity. NMR Biomed. Mar 2014;27(3):261-71. doi: 10.1002/nbm.3059.
4. Ruiz-Cabello J, Barnett BP, Bottomley PA, Bulte JW. Fluorine (19F) MRS and MRI in biomedicine. NMR Biomed. Feb 2011;24(2):114-29. doi: 10.1002/nbm.1570.
5. Chapelin F, Capitini CM, Ahrens ET. Fluorine-19 MRI for detection and quantification of immune cell therapy for cancer. J Immunother Cancer. Oct 11 2018;6(1):105. doi: 10.1186/s40425-018-0416-9.
6. Amiri H, Srinivas M, Veltien A, van Uden MJ, de Vries IJ, Heerschap A. Cell tracking using (19)F magnetic resonance imaging: technical aspects and challenges towards clinical applications. Eur Radiol. Mar 2015;25(3):726-35. doi: 10.1007/s00330-014-3474-5.
7. Fox MS, Gaudet JM, Foster PJ. Fluorine-19 MRI Contrast Agents for Cell Tracking and Lung Imaging. Magn Reson Insights. 2015;8(Suppl 1):53-67. doi: 10.4137/MRI.S23559.
8. Schulte RF, Sacolick L, Deppe MH, et al. Transmit gain calibration for nonproton MR using the Bloch-Siegert shift. NMR Biomed. Nov 2011;24(9):1068-72. doi: 10.1002/nbm.1657.
9. Bluml S, Schad LR, Stepanow B, Lorenz WJ. Spin-lattice relaxation time measurement by means of a TurboFLASH technique. Magn Reson Med. Sep 1993;30(3):289-95. doi: 10.1002/mrm.1910300304.
10. Deoni SC, Rutt BK, Peters TM. Rapid combined T1 and T2 mapping using gradient recalled acquisition in the steady state. Magn Reson Med. Mar 2003;49(3):515-26. doi: 10.1002/mrm.10407.
11. Scheffler K, Lehnhardt S. Principles and applications of balanced SSFP techniques. Eur Radiol. Nov 2003;13(11):2409-18. doi: 10.1007/s00330-003-1957-x.
12. Watts R, Wang Y. k-space interpretation of the Rose Model: noise limitation on the detectable resolution in MRI. Magn Reson Med. Sep 2002;48(3):550-4. doi: 10.1002/mrm.10220.
Figures