2503
Mapping MRI and MR Spectroscopy to Quantify Tumor and Edema Metabolism in Glioma Patients1Center for Clinical Spectroscopy, Department of Radiology, Brigham and Women's Hospital / Harvard Medical School, Boston, MA, United States
Synopsis
Keywords: Tumors, Spectroscopy, chemical shift imaging, glioma
This work examines the differences in metabolite concentrations in brain cancer lesions between the glioma and edema hyperintensities. Metabolites that showed statistically significant differences in this work are 2HG, total choline, glutamate plus glutamine, myoinositol, and lactate. Correlations between the metabolites and the partial volume fractions of hyperintense regions from MRIs revealed that the metabolite concentrations are higher in glioma than in edema. These results provide a simple method for fusing metabolic data with imaging findings which can provide added value for clinicians.Introduction
Magnetic Resonance Spectroscopy (MRS) can non-invasively obtain the neurochemical profile of brain tissue to provide diagnosis and monitoring of brain tumors. In conjunction with Magnetic Resonance Imaging (MRI), brain tumors can be diagnosed and monitored for their growth or change in metabolite concentrations, including increased choline (Cho), decreased N-acetylaspartate (NAA), increased lactate (Lac), as well as increases in myoinositol (mI) and glutamate/glutamine (Glx). Another oncometabolite detected through MRS is 2-hydroxyglutarate2 which indicates the presence of the isocitrate dehydrogenase mutation. Chemical shift imaging (CSI) is advantageous over single-voxel MRS because it provides high spatial resolution and reduces partial volume effects. Conventional MRI includes T2/FLAIR imaging and contrast-enhanced T1 imaging. The T2/FLAIR hyperintensity represents both the tumor and edema, whereas the T1 hyperintensity represents only the tumor. This method provides the grounds for a rapid approach to separate the tissue types and characterize the differences in neurochemical profiles between glioma, or brain tumor, and edema, the fluid surrounding the tumor. The additional biochemical information coupled with the morphometric imaging can provide added value to neurosurgery and neuro-oncologists for surgical and radiation planning, respectively.Methods
The MRS scans were acquired on a 3T scanner with a 32-channel head coil, along with T1 and T2 weighted MRI. CSI was acquired using a semi-localized adiabatic selective refocusing spectroscopic imaging sequence with TE/TR=97/1700 ms, a 2D 16x16 voxel acquisition matrix with an 8x8 voxel region of interest, and a voxel volume of 10x10x15 mm3 (1.5 mL)3. For each voxel of the MRSI grid, LCModel4 was used to determine the concentrations of total N-acetyl aspartate (tNAA), myoInositol (mI), total creatine (tCr), total choline (tCho), glutamate and glutamine (Glx), and 2-hydroxyglutarate (2HG). Manual segmentation of the glioma and edema in each brain volume were done using the Segment Editor feature in 3D Slicer5. CSI was performed in 30 patients and quality control measures were applied to clean the data, involving the removal of voxels with Cramer-Rao Lower Bound (CRLB) 50% or higher in the metabolites of interest. The CSI and T1 and T2/FLAIR images for each patient were segmented and co-registered using the VDI software6 in MATLAB. The partial volume fractions of the T1 contrast-enhanced images, which included only the glioma, were subtracted from those of the T2 images, which included both the glioma and edema. This resulted in partial volume fractions for only the edema in each MRSI voxel. These were correlated with the metabolite-to-creatine ratios using linear regression, as done previously in a study that focused only on FLAIR MRI in a smaller subset of patients7. Intercepts from linear regression at which voxels contained purely T1 hyperintensity were compared with those of the edema (Fig 2). Lastly, t-tests were conducted to determine the statistical significance of the trends observed between glioma and edema.Results and Discussion
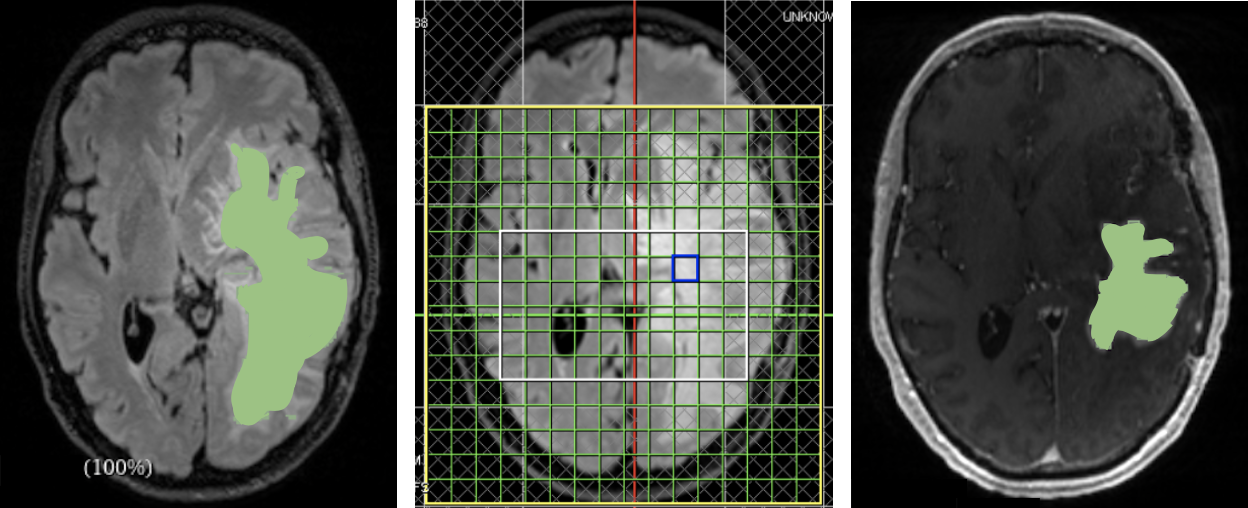
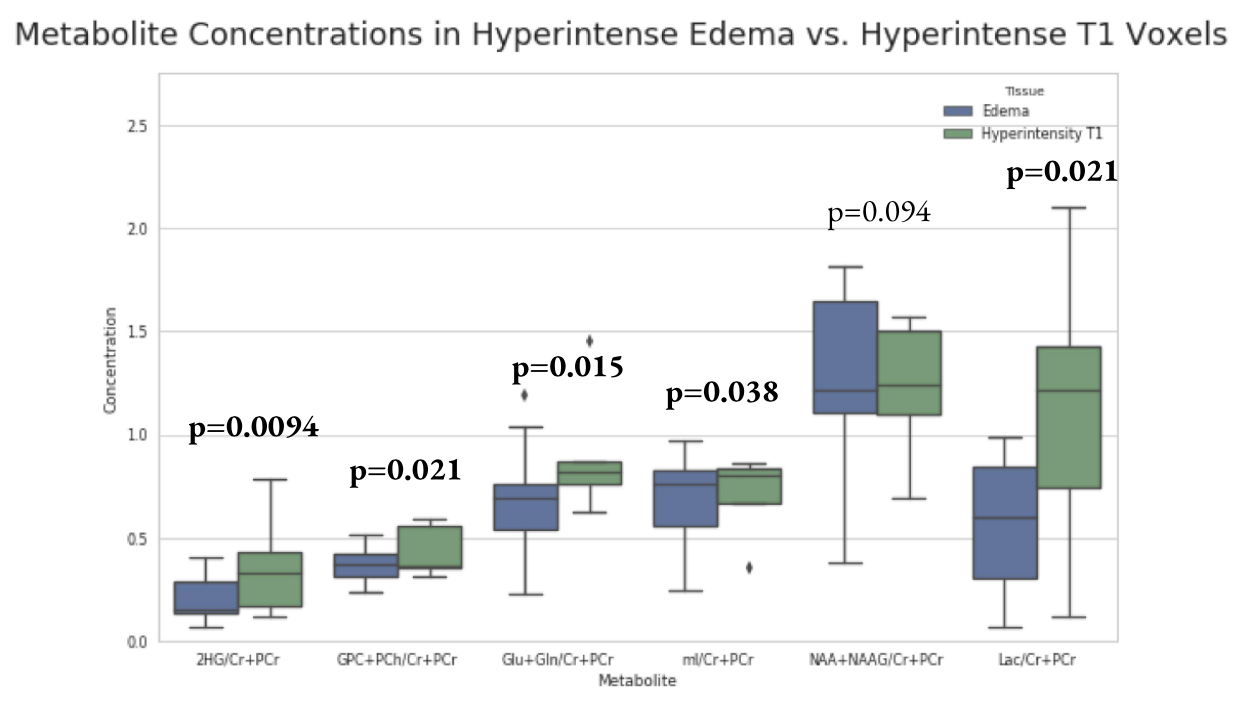
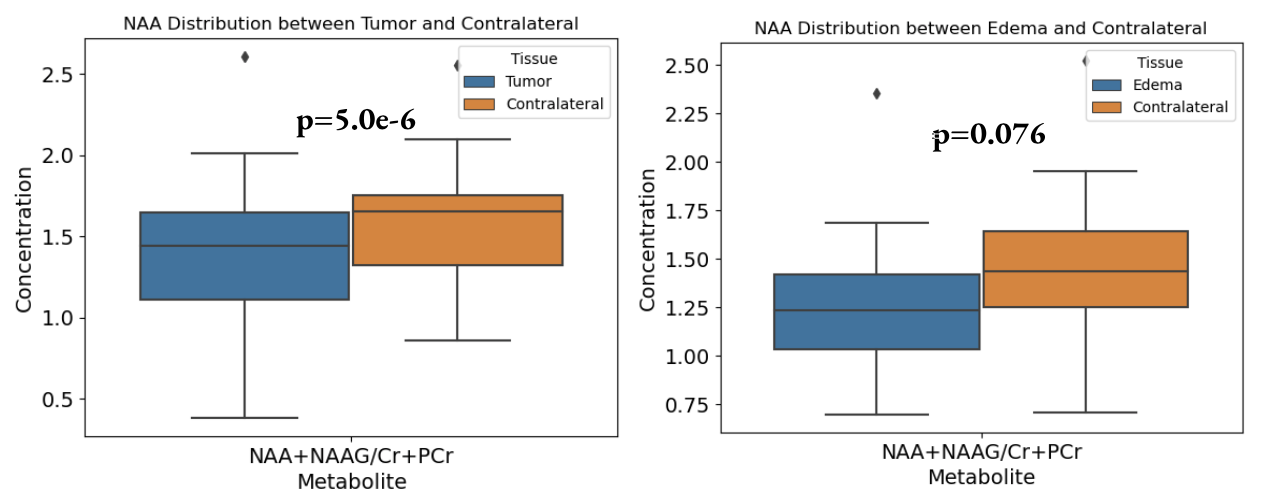
The segmentation mask generated manually through 3D Slicer overlaid with the 2D MRSI volumes and combined with CSI provided spatial distribution of metabolites (Fig 1). When comparing the metabolite concentrations between the glioma and edema hyperintensities, the concentrations of 2HG (p=0.0094), Cho (p=0.021), Glx (p=0.0153), mI (p=0.038), and Lactate (p=0.0061) were increased in the contrast enhanced signal reflective of the tumor itself (Fig 2). As expected, the glioma showed higher concentrations of the metabolites because this is where the majority of cancer cells are located. A slightly lower concentration of NAA was detected in the glioma, but was not statistically significant (p=0.094). This may be due to the strong negative correlation between NAA concentrations in both hyperintensities and the contralateral. When the glioma and edema are compared with the contralateral, both show decreases in NAA, with p-values of 5.0e-6 and 0.076 respectively (Fig 3). The lower correlation of NAA levels between glioma and edema may be due to similar neuronal loss in both tissue types, as evident in the comparison to contralateral healthy tissue. As anticipated, the metabolite concentrations of tumor biomarkers detected in the glioma are more evident than those detected in edema but the presence of 2HG and choline within the edema demonstrates that there is infiltrating tumor within the edema would be of great value to neurosurgeons when planning the resection area as it may provide for a more complete resection of tumor tissue. Similarly, the additional metabolic information can be of value to neuro-oncologists for radiation planning. Most importantly, this method provides radiologists with a simple metabolite value for tumor and edema tissue for more rapid analysis of the CSI data.Conclusion
This work assesses metabolic differences between two hyperintensities: glioma and edema in order to inform the use of T1 and T2/FLAIR imaging for the segmentation and analysis of the two tissue types.Acknowledgements
No acknowledgement found.References
[1] Horská, A., & Barker, P. B. (2010). Imaging of brain tumors: MR spectroscopy and metabolic imaging. Neuroimaging clinics of North America, 20(3), 293–310. https://doi.org/10.1016/j.nic.2010.04.003
[2] Zhou, M., Zhou, Y., Liao, H., Rowland, B. C., Kong, X., Arvold, N. D., Reardon, D. A., Wen, P. Y., Lin, A. P., & Huang, R. Y. (2018). Diagnostic accuracy of 2-hydroxyglutarate magnetic resonance spectroscopy in newly diagnosed brain mass and suspected recurrent gliomas. Neuro-oncology, 20(9), 1262–1271. https://doi.org/10.1093/neuonc/noy022
[3] Zhao W, Coello E, Louis M, Breedlove K, Tal A, Lin A. Compression of Multivoxel Spectroscopic Data via Visualization of Grey and White Matter Contributions to Metabolite Concentrations. Proc. Intl. Soc. Mag. Reson. Med. 29:2238 (2021)
[4] Provencher SW. Automatic quantitation of localized in vivo 1H spectra with LCModel. NMR Biomed. 2001 Jun;14(4):260-4. doi: 10.1002/nbm.698. PMID: 11410943.
[5] Fedorov A., Beichel R., Kalpathy-Cramer J., Finet J., Fillion-Robin J-C., Pujol S., Bauer C., Jennings D., Fennessy F., Sonka M., Buatti J., Aylward S.R., Miller J.V., Pieper S., Kikinis R. 3D Slicer as an Image Computing Platform for the Quantitative Imaging Network. Magnetic Resonance Imaging. 2012 Nov;30(9):1323-41. PMID: 22770690
[6] Tal, A (2020). Visual Display Interface (VDI) [Computer Software]. Retrieved from http://www.vdisoftware.net[7] Zhou W, Coello E, Liao V, Tal A, Lin A. Fusion of T2/FLAIR Hyperintensities with Chemical Shift Imaging in Glioma Patients. Proc. Intl. Soc. Mag. Reson. Med. 30:286 (2022)
[7] Zhou W, Coello E, Liao V, Tal A, Lin A. Fusion of T2/FLAIR Hyperintensities with Chemical Shift Imaging in Glioma Patients. Proc. Intl. Soc. Mag. Reson. Med. 30:286 (2022)
Figures