2502
Indirect detection of deuterated glucose brain metabolism at 3 Tesla: preliminary findings in volunteers and patients with gliomas1Department of Radiology and Biomedical Imaging, University of California San Francisco, San Francisco, CA, United States, 2Department of Neurological Surgery, University of California San Francisco, San Francisco, CA, United States, 3Department of Radiology and Biomedical Imaging, Magnetic Resonance Research Center, Yale University, New Haven, CT, United States
Synopsis
Keywords: Tumors, Brain, deuterated glucose
This study aimed to perform indirect detection of deuterated glucose metabolism at 3 Tesla in healthy subjects and patients with brain tumors using time-series data acquired from atlas-based single-voxel spectroscopy and whole-brain 3D magnetic resonance spectroscopic imaging (MRSI). Following 2H-glucose consumption, subjects generally displayed reduced levels of glutamate in the anterior cingulate cortex (ACC) and midline gray matter, while patient T2 lesions did not appear to show the same trend. These preliminary data demonstrate the ability to detect deuterated glucose metabolism at 3 Tesla.Introduction
Deuterium metabolic imaging (DMI) is a novel MRI-based technique that has demonstrated Warburg-related metabolic dysregulation in brain tumors using orally-administered 2H-labeled glucose as a tracer1. Given the limited accessibility of 2H-tuned hardware in clinical practice, 1H MR spectroscopy has been employed to indirectly detect 2H-glucose metabolism through the label exchange between 1H and 2H in downstream metabolites2. This pilot study sought to indirectly evaluate 2H-glucose brain metabolism at 3 Tesla in time-series spectra acquired from healthy volunteers and patients with gliomas via automatically prescribed atlas-based 1H spectroscopy.Methods
Indirect 2H-glucose detection. Each of the 4 non-diabetic subjects (2 healthy volunteers; 2 patients with low-grade IDH-mutated gliomas) recruited to the study received a 0.75g/kg oral dose (maximum 60g) of [6,6′-2H2]glucose dissolved in 150-250 mL water. All subjects were asked to fast 9 hours before the start of the study appointment. To account for potential variations in the data, subject glucose levels were measured using capillary blood from a fingertip pre-administration of the heavy sugar and post imaging. Immediately following tracer administration, imaging was started and performed on a 3 Tesla MR750 scanner (GE Healthcare, Waukesha, WI) equipped with a 32-channel headcoil (Nova Medical, Wilmington, MA). 1H spectral data were repeatedly acquired in a time series spanning 60-120 min using single-voxel semi-laser spectroscopy (SVS; TR/TE=1300/35ms; voxel size = 2×2×2 cm3; 4096 spectral points; sweepwidth = 5000 Hz; 64 averages; Tacq=~2.5 minutes; automatic linear shimming) and 3D whole-brain MR spectroscopic imaging (MRSI; TR/TE=1300/35 ms, matrix size=18×22×16, nominal voxel size=1×1×1 cm3, flyback echo-planar readout3; Tacq=~7 minutes; high-order shimming). Atlas-based techniques utilizing T1-weighted imaging had enabled the automatic prescription of SVS and MRSI along 3 oblique planes from pre-defined coverage templates in MNI152 space4. While SVS prescriptions were targeted to the anterior cingulate cortex (ACC) based on its importance in other spectroscopic studies, MRSI coverage encompassed the whole brain and required outer volume suppression (OVS) bands to minimize lipid signal contamination5.Post-processing and Analysis. In-house processing routines were used to reconstruct, channel-combine and phase both the SVS and MRSI data (4-6 SVS/MRSI acquisitions per exam). Time-series SVS data from the ACC were quantified for glutamate using LCModel6 and preliminary qualitative assessment was made from MRSI data that were normalized by N-acetylaspartate/N-acetylaspartylglutamate (NAA+NAAG) signal and averaged within midline gray matter (GM) or T2 lesions (T2L).
Results
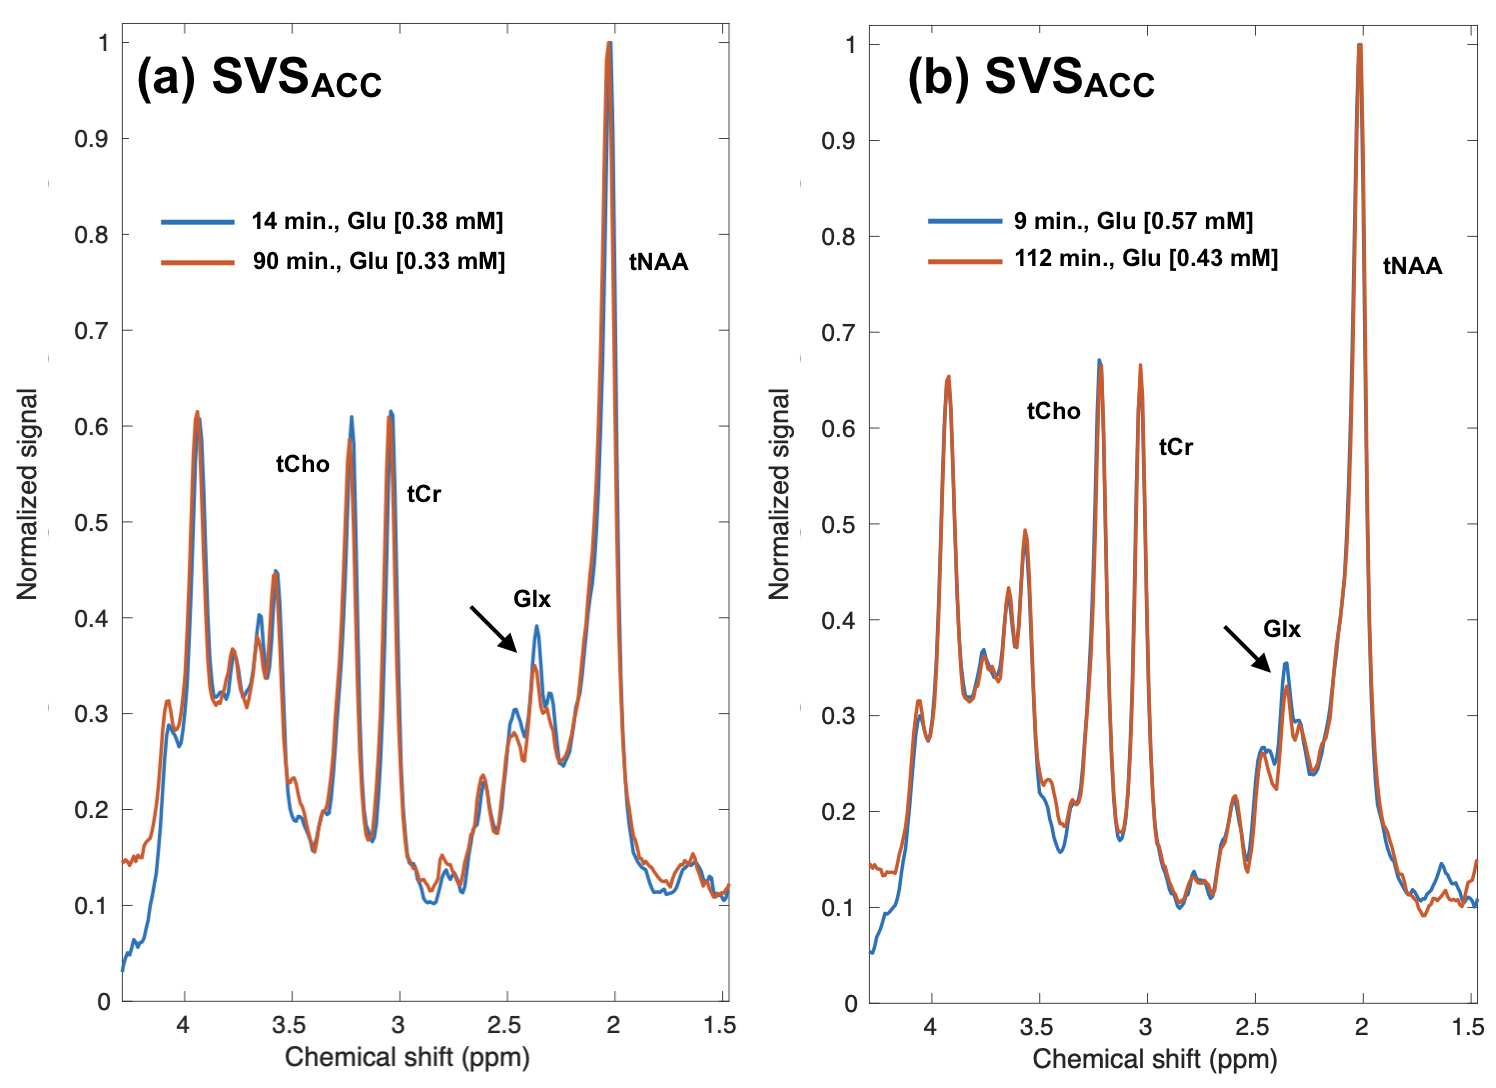
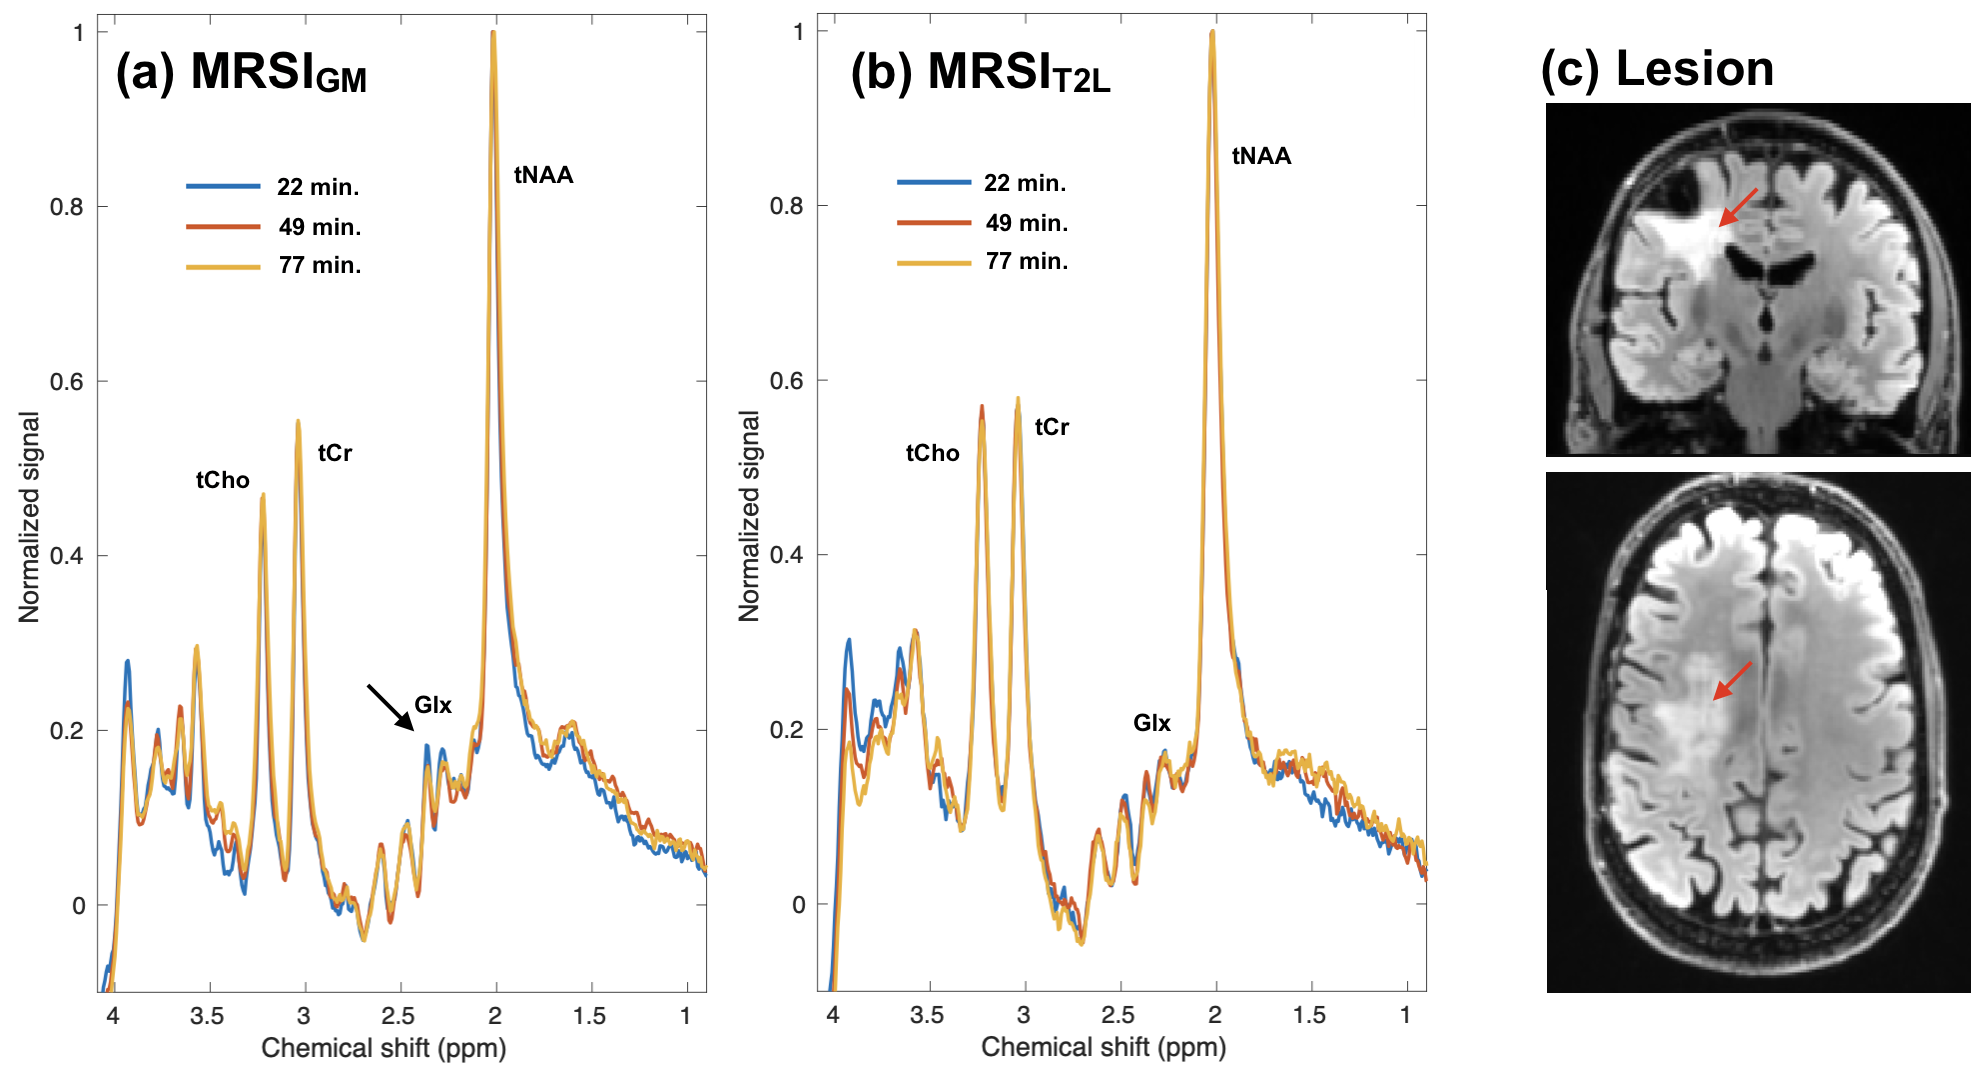
Figure 1 shows example atlas-based SVS of the ACC acquired from 2 healthy volunteers shortly following 2H-glucose consumption (blue traces) and at a later timepoint (red traces). In both subjects, the levels of glutamate quantified by LCModel demonstrated a decrease over the scan intervals. Example MRSI data from a patient are shown in Figure 2, which have been averaged over 7 voxels within midline gray matter (a) and the T2L (b). Similar to the healthy subjects, the patient displayed progressive reduction in gray matter signal corresponding to the glutamate/glutamine (Glx) region; however, the T2L did not demonstrate any visually apparent reduction. The same general trend was observed in the other patient as well.Discussion/Conclusion
Preliminary assessment of the healthy subject and patient data indicated that Glu signal was reduced in a manner consistent with a prior study on indirect detection of 2H-glucose metabolism at 7 Tesla2. Such reduced 1H signal can mechanistically result from the deuteration of glutamate as 2H-glucose competes with the native substrate. The absence of a trend toward reduced glutamate in the patients may be due to mutations in isocitrate dehydrogenase (IDH), which are known to reduce the levels of glutamate with the gain-of-function production of D-2-hydroxyglutarate. Future work will further evaluate SVS and MRSI data collected from both healthy volunteers and patients, and seek to robustly quantify partially deuterated as well as non-deuterated metabolite species.Acknowledgements
This study was supported by SPORE DRP P50 CA097257 and NICO (Noninvasive Characterization of Oligodendroglioma).I can’t remember the full name of NICO.References
1. De Feyter HM, Behar KL, Corbin ZA, et al. Deuterium metabolic imaging (DMI) for MRI-based 3D mapping of metabolism in vivo. Science Advances 2018; 4(8):
2. Cember ATJ, Wilson NE, Rich LJ, et al. Integrating 1H MRS and deuterium labeled glucose for mapping the dynamics of neural metabolism in humans. NeuroImage 2022; 251:118977
3. Park I, Chen AP, Zierhut ML et al. Implementation of 3 T lactate-edited 3D 1H MR spectroscopic imaging with flyback echo-planar readout for gliomas patients. Ann Biomed Eng 2011;39:193–2044.
4. Bian W, Li Y, Crane JC, Nelson SJ. Fully automated atlas-based method for prescribing 3D PRESS MR spectroscopic imaging: Toward robust and reproducible metabolite measurements in human brain. Magn Reson Med. 2018; 79(2):636-6425.
5. Star-Lack J, Nelson SJ, Kurhanewicz J, et al. Improved water and lipid suppression for 3D PRESS CSI using RF band selective inversion with gradient dephasing (BASING). Magn Reson Med. 1997; 38:311–321.
6. Provencher SW. Automatic quantitation of localized in vivo 1H spectra with LCModel. NMR in Biomed. 2001;14:260-264
Figures