2497
Using 3D APTw and ASL imaging to differentiate solitary brain metastases from glioblastomas1The Fourth Affiliated Hospital, Guangxi Medical University, Liuzhou, China, 2The First Affiliated Hospital, Guangxi Medical University, Nanning, China, 3Philips Healthcare, Guangzhou, China
Synopsis
Keywords: Tumors, Brain
This study is to determine whether APTw and ASL imaging are useful for distinguishing GBMs and SBMs. The differences in APT and CBF values between GBMs and SBMs were compared.The result showed that 3D APTw is an important MRI technique for distinguishing SBMs and GBMs. Particularly, APTw combined with ASL demonstrated a more satisfactory discrimination and a higher diagnostic performance.Introduction
Glioblastomas and brain metastases are the most common malignant types of adult brain tumors in central nervous system with high recurrence and lethality rate [1]. The prevalence of these two malignancies shows a rising trend in recent decades [2]. Surgical resection is attempted in the vast majority of cases with clinically and radiographically suspected GBM [3,4]. When a pathological diagnosis of GBM is made, it is usually followed by temozolomide-based chemoradiotherapy. Thus, differentiating SBMs from GBMs prior to treatment is critical for therapeutic decision making. Recent clinical studies have demonstrated that APTw or ASL is useful for the evaluation of various types brain tumors, including glioma, meningioma, lymphoma and other systemic neoplasms. However, to our knowledge, there are no report comparing the diagnostic performance of APTw and ASL imaging in distinguishing GBMs from SBMs. Therefore, the purpose of this study is to determine whether APTw and ASL imaging are useful for distinguishing GBMs and SBMs.Methods
Forty-eight patients diagnosed with brain tumor (20 cases of glioblastoma and 22 cases of metastase) were enrolled in this study. All patients underwent conventional MRI, APTw and ASL scans on a 3.0 T MRI system ( Ingenia CX, Philips Medical Systems, Best, The Netherlands) . For each patient, the slice with maximal tumour dimension were selected and then the ROI was manually drawn on tumors antumor core area (TCA), and the peritumoral high signal intensity area (PHA). The mean APTw value, mean CBF value, rAPTw value and rCBF value were meseaured. The differences in values between GBMs and SBMs were compared using the independent-samples t-test or Mann–Whitney U test. Receiver operating characteristic (ROC) curves and area under the ROC curves (AUC) were calculated to assess the quantitative performance of these MRI parameters in distinguishing GBMs and SBMs.. The sensitivity, specificity, and accuracy were further calculated.P values<0.05 were considered to be statistically signifcant.Results
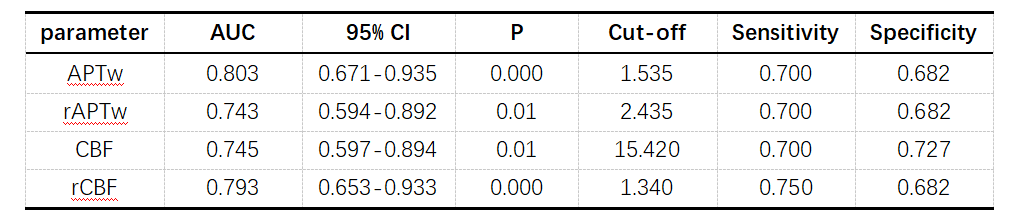
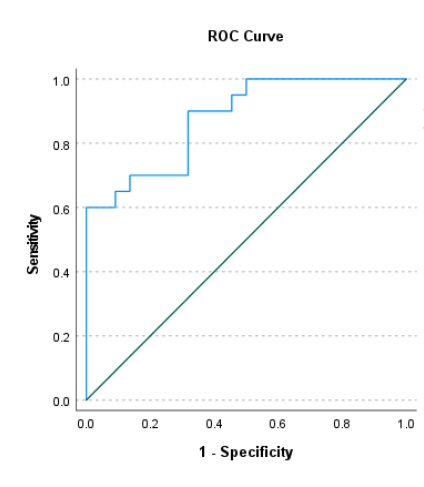
As shown in Table 1 and Table 2, GBMs exhibited significantly higher APTw and CBF values in peritumoral parts compared with SBMs (P<0.05). Although APTw and CBF values of tumor core in GBMs were higher than those in SBMs, there was no statistical difference. The APTw value has the highest diagnostic efficiency in differentiating SBMs from GBMs. When combined CBF value, the AUC increased to 0.877(Figure 1).Discussion
Our result showed that GBMs have higher APTw and CBF values compared with SBMs,which was consistent with previous reports [5,6]. When tumorigenesis, the metabolic level of tumor tissue increases, more protein products will be synthesized, cell proliferation accelerated and microvascular hyperplasia is obvious, which leads to the increase of APTw and ASL signals. Then tumor cells infiltrate the surrounding brain parenchyma in the form of individual diffusely infiltrating cells or tightly clustered cells, and finally, the signal increased in the peritumoral parts. Interestingly, GBMs is often characterized by scattered patchy heterogeneous hyperintensity in our research, which can be recognized more sensitively on APTw or ASL images than conventional MRI. In our study, GBM with heterogeneous hyperintensity often showed diffuse infiltration, uneven signal and ill-defined. The lesions that appear to be slightly or not enhanced were also characterized by inhomogeneous hyperintensity. Due to the invasion of tumor cells into peritumoral edema through the aquaporin pathway, even obvious hyperintensity can sometimes be seen in the peritumoral edema area. This finding is helpful to guide the targeted biopsy for accurate diagnosis and treatment, and may help to identify microscopic tumor invasion areas.Conclusion
Our results demostrate that 3D APTw is an important MRI technique for distinguishing SBMs and GBMs. Particularly, APTw combined with ASL demonstrated a more satisfactory discrimination and a higher diagnostic performance.Acknowledgements
This study was partially supported by grants from Guangxi Liuzhou Science and Technology Planning Project (2021CBC0128).References
1. Abdel Razek AAK, Talaat M, El-Serougy L, Abdelsalam M, Gaballa G. Differentiating Glioblastomas from Solitary Brain Metastases Using Arterial Spin Labeling Perfusion- and Diffusion Tensor Imaging-Derived Metrics. World Neurosurg. 2019 Jul;127:e593-e598.
2. Yamashita K, Yoshiura T, Hiwatashi A, Togao O, Yoshimoto K, Suzuki SO, Abe K, Kikuchi K, Maruoka Y, Mizoguchi M, Iwaki T, Honda H. Differentiating primary CNS lymphoma from glioblastoma multiforme: assessment using arterial spin labeling, diffusion-weighted imaging, and ¹⁸F-fluorodeoxyglucose positron emission tomography. Neuroradiology. 2013 Feb;55(2):135-43.
3. Minniti G, De Sanctis V, Muni R, Filippone F, Bozzao A, Valeriani M, Osti MF, De Paula U, Lanzetta G, Tombolini V, Maurizi Enrici R. Radiotherapy plus concomitant and adjuvant temozolomide for glioblastoma in elderly patients. J Neurooncol. 2008 May;88(1):97-103.
4. Muni R, Minniti G, Lanzetta G, Caporello P, Frati A, Enrici MM, Marchetti P, Enrici RM. Short-term radiotherapy followed by adjuvant chemotherapy in poor-prognosis patients with glioblastoma. Tumori. 2010 Jan-Feb;96(1):60-4.Warnert, E. A. H., et al. (2022). "Mapping tumour heterogeneity with pulsed 3D CEST MRI in non-enhancing glioma at 3 T." Magn reson mater phy 35(1): 53-62.
5. Yu H, Lou H, Zou T, Wang X, Jiang S, Huang Z, Du Y, Jiang C, Ma L, Zhu J, He W, Rui Q, Zhou J, Wen Z. Applying protein-based amide proton transfer MR imaging to distinguish solitary brain metastases from glioblastoma. Eur Radiol. 2017 Nov;27(11):4516-4524.
6. Kamimura K, Nakajo M, Yoneyama T, Fukukura Y, Hirano H, Goto Y, Sasaki M, Akamine Y, Keupp J, Yoshiura T. Histogram analysis of amide proton transfer-weighted imaging: comparison of glioblastoma and solitary brain metastasis in enhancing tumors and peritumoral regions. Eur Radiol. 2019 Aug;29(8):4133-4140.
Figures
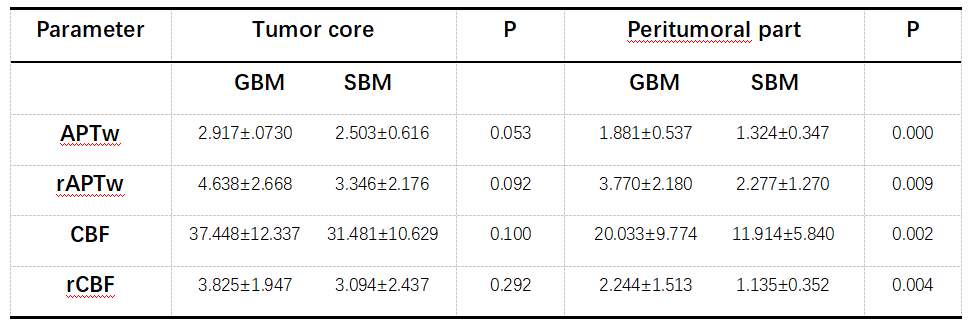
Tabel 1. MRI parameters comparison of the tumors core and the peritumoral part between GBMs and SBMs. Abbreviations: SBMs, solitary brain metastases; GBMS, glioblastomas.