2495
Spatial Habitats Analysis based on Multiparametric Physiologic MR Imaging Predicts Survival of Patients with Glioblastoma1Department of Radiology, Renji Hospital, School of Medicine, Shanghai Jiao Tong University, Shanghai, China, 2MR Collaboration, Central Research Institute, United Imaging Healthcare, Shanghai, China
Synopsis
Keywords: Tumors, Tumor, glioblastoma
Glioblastoma (GBM) is characterized remarkably high tumors heterogeneity which contribute to its poor survival and effective therapies. We build the spatial habitats based on multiparametric physiologic MRI (diffusion-weighted and perfusion-weighted MRI) to describe the intratumoral heterogeneity of gliomas and explore the possibility of the link between theses habitats and progression-free survival (PFS). This shows the spatial correspondence with molecular histological features and MRI images. This also provide valuable information to identify tumor progression areas that may require biopsy and potential treatment resistance subregions which tend to be the target areas of treatment.
Introduction
Glioblastoma (GBM) are the most common and aggressive primary brain tumors. However, current treatment methods provide limited benefits because of the heterogeneity of glioblastoma(1). Pathological specimens obtained by partial resection or biopsy can only represent part of the tumor, and may lose the information of important subregions. It is expected that there will be a non-invasive method to well evaluate tumor heterogeneity, to identify some meaningful areas to guide the operation and to be a promising biomarker for prognosis of glioblastomas.Tumor heterogeneity reflects genetic heterogeneity combined with spatial variation in biologic behavior and leads to the formation of tumor subregions defined as “habitats”(2; 3). Spatially distinct habitats defined based on multiparametric, physiologic MRI using K-means cluster analysis(4-6). Previous studies have evaluated the value of ADC and Ktrans in predicting the prognosis of GBMs separately(7-9), but the parametric response map can only evaluate a single parameter.
Thus, the aim of the study was to (1) clustering spatial habitats based on multiparametric physiologic MRI to reflect the heterogeneity of vascularity and cellularity of GBM and to (2) explore whether the spatial habitats could be a promising biomarker for prognosis of GBM.
Methods
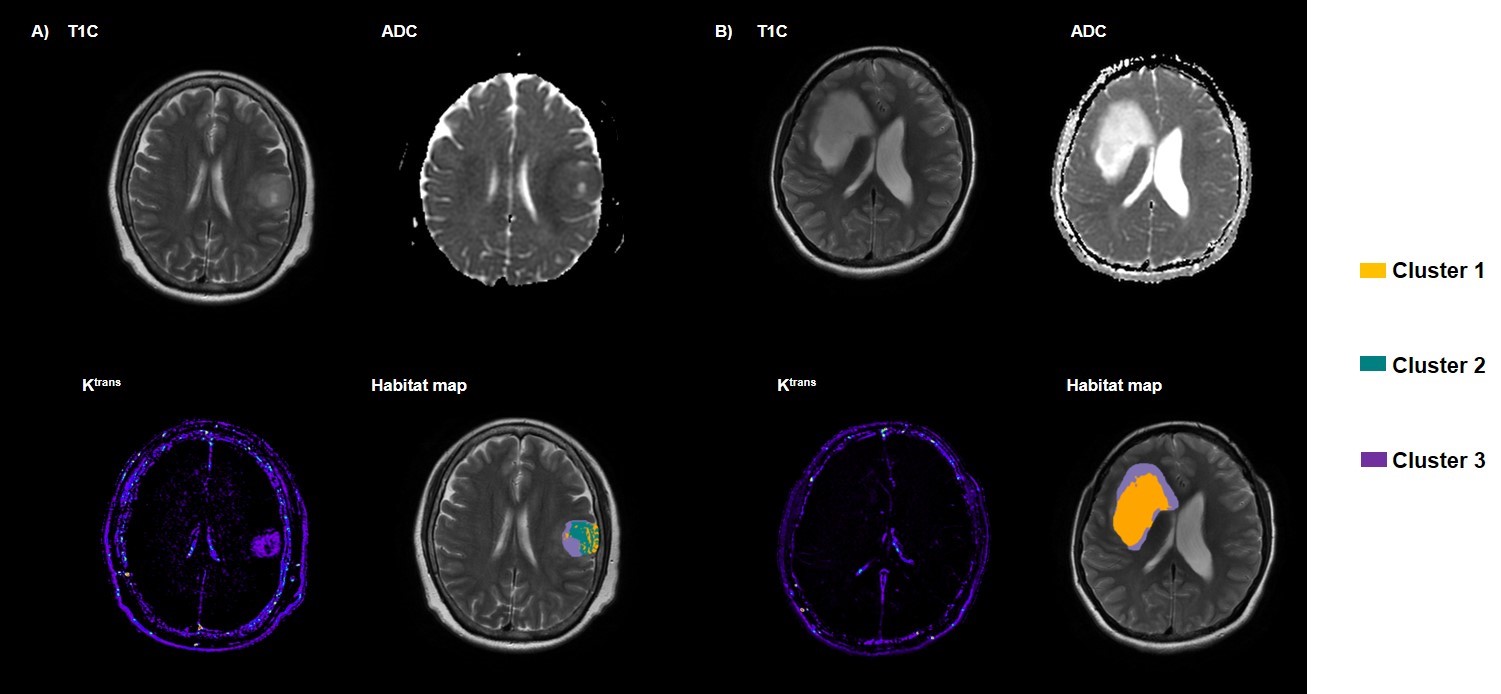
A total of 32 patients with a histopathologic diagnosis of glioblastoma were included in this retrospective study. All MRI examinations were performed on a 3 T scanner (uMR 780, United Imaging Healthcare, Shanghai, China) including T2 weighted imaging, dynamic contrast-enhanced imaging (DCE) and diffusion weighted imaging (DWI). The apparent diffusion coefficient (ADC) maps Ktrans maps were calculated using MR postprocessing workstation (United Imaging Healthcare, Shanghai, China). The ADC maps and Ktrans maps were registered and resampled to match pixel dimensions and slice thicknesses with the late phases of T1-weighted DCE images (T1C) by ANTs (http://stnava.github.io/ANTs). Tumor volumes of interest (VOIs) were labeled in the T1C images using 3D slicer (version 5.0.2) by a senior radiologist with 10-years’ experience. Necrotic areas and cystic degeneration were avoided. Then three subregions were segmented based on ADC and ktrans values from the labeled VOIs using a K-means clustering method with the Scikit-Learn python package.We defined the three spatial habitats with in the contrast-enhancing lesion: cluster 1 represented “hypovascular cellular tumor” with low CBV value and low ADC value; cluster 2 represented “hypervascular cellular tumor” with high Ktrans value and low ADC value; and cluster 3 represented “nonviable tissue” with low CBV value and high ADC value. Absolute tumor volumes, and tumor volume fractions for each habitat were calculated. Patients were assigned to high- or low-risk group based on the median value of the fraction of each subregion. Kaplan-Meier analysis and log-rank test were used to evaluate patient for stratifying into different risk groups. The hazard ratio was used to measure the degree of survival differences.
Results
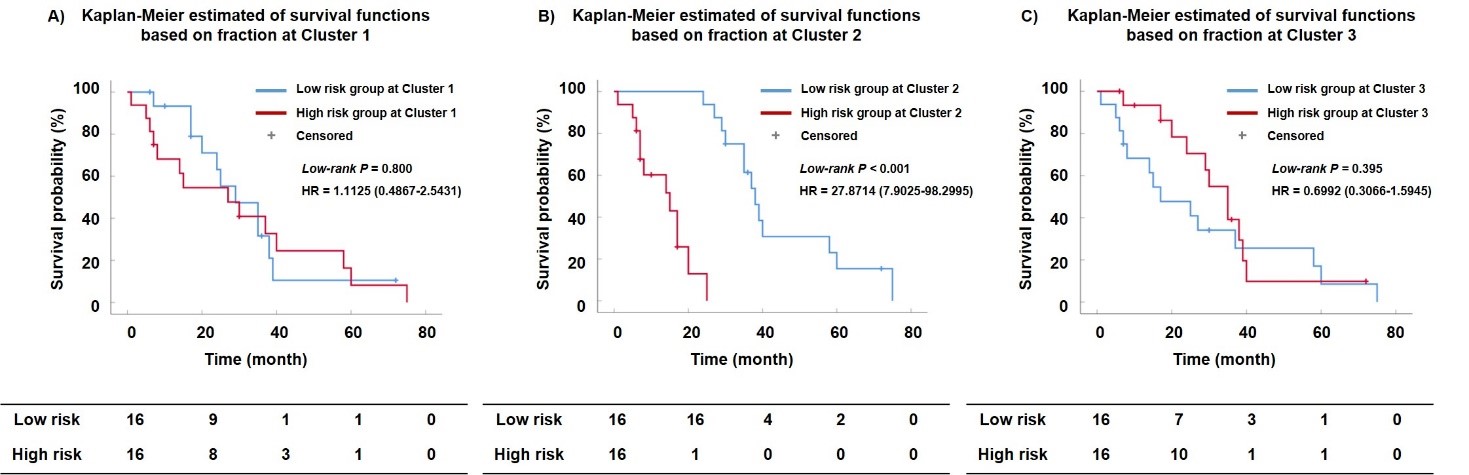
Figure 1 demonstrates examples of habitat maps. The result of survival analysis is presented in Figure 2. The Kaplan-Meier survival analysis yielded a significant difference for the survival times observed from the patients dichotomized by low (< 11.09 %) and high (> 11.09 %) fraction in the hypervascular cellular habitat with high Ktrans (log-rank test, P < 0.001). Low-risk group of hypervascular cellular habitat has a longer survival time than high-risk group for glioblastoma patients (hazard ratio = 27.8714, 95% confidence interval 7.9025 to 98.2995). However, the differences in survival between high- and low-risk subgroups were not significant based on hypovascular cellular habitat (log-rank test, P = 0.395) and nonviable tissue habitat (log-rank test, P = 0.800).Discussion
Our study identified three spatially distinct habitats physiologically, hypervascular cellular habitat represents areas with high cellularity and vascularity, most likely representing tumor component. Hypovascular cellular habitat most likely representing areas of tumor component with hypoxia or ischemia. Nonviable tissue was likely representing nonviable tumor component. In our study, the hypovascular cellular habitat with low ADC and high Ktrans was a strong predictor of glioblastomas PFS. This habitat which has higher cell density and vascularity may represent the most malignant and progressive region of the GBM.Conclusion
The spatial habitats based on multiparametric physiologic MRI could well depict the heterogeneity of GBMs and may serve as a meaningful biomarker of clinical outcomes in patients of GBM.Acknowledgements
This study was funded by the National Natural Science Foundation of China (No.82171885, 81971583); Shanghai Science and Technology Commission explorer Program (21TS1400700); Shanghai Natural Science Foundation (20ZR1433200); the Medical Engineering Cross Research Foundation of Shanghai Jiao Tong University (No. YG2022QN035); Horizontal Research supported by Renji Hospital (grant RJKY22-01)
References
1. Wirsching HG, Galanis E, Weller M. 2016. Glioblastoma. Handb Clin Neurol 134:381-97
2. Kim JY, Gatenby RA. 2017. Quantitative Clinical Imaging Methods for Monitoring Intratumoral Evolution. Methods Mol Biol 1513:61-81
3. Clarke R. 2017. Introduction: Cancer Gene Networks. Methods Mol Biol 1513:1-9
4. Juan-Albarracin J, Fuster-Garcia E, Perez-Girbes A, Aparici-Robles F, Alberich-Bayarri A, et al. 2018. Glioblastoma: Vascular Habitats Detected at Preoperative Dynamic Susceptibility-weighted Contrast-enhanced Perfusion MR Imaging Predict Survival. Radiology 287:944-54
5. Choi SW, Cho HH, Koo H, Cho KR, Nenning KH, et al. 2020. Multi-Habitat Radiomics Unravels Distinct Phenotypic Subtypes of Glioblastoma with Clinical and Genomic Significance. Cancers (Basel) 12
6. Park JE, Kim HS, Kim N, Park SY, Kim YH, Kim JH. 2021. Spatiotemporal Heterogeneity in Multiparametric Physiologic MRI Is Associated with Patient Outcomes in IDH-Wildtype Glioblastoma. Clin Cancer Res 27:237-45
7. Kondo M, Uchiyama Y. 2018. Apparent diffusion coefficient histogram analysis for prediction of prognosis in glioblastoma. J Neuroradiol 45:236-41
8. Yoon RG, Kim HS, Kim DY, Hong GS, Kim SJ. 2016. Apparent diffusion coefficient parametric response mapping MRI for follow-up of glioblastoma. Eur Radiol 26:1037-47
9. Pak E, Choi KS, Choi SH, Park CK, Kim TM, et al. 2021. Prediction of Prognosis in Glioblastoma Using Radiomics Features of Dynamic Contrast-Enhanced MRI. Korean J Radiol 22:1514-24
Figures