2493
Optimization of 2D-APT imaging of brain tumor based on saturated RF pulse parameters1The First Affiliated Hospital of Dalian Medical University, DaLian, China, 2The First Affiliated Hospital of Dalian Medical University, Dalian, China, 3The First Affiliated Hospital of Dalian Medical University, dalian, China
Synopsis
Keywords: Tumors, Molecular Imaging
2D APTw imaging is a single-slice imaging method focusing on the selected plane, with low spatial coverage and a much shorter scan time than its 3D counterpart, which makes it an optional scan sequence for patients who cannot tolerate long scan times. However, there is still a lack of an optimal setting for 2D APTw imaging in clinics for human brain tumors. Therefore, this study aims to explore the different combinations of pulse power and duration of saturation RF pulse in 2D APTw imaging on brain tumors and to find an optimal setting suitable for clinical use.Synopsis
2D APTw imaging is a single-slice imaging method focusing on the selected plane, with low spatial coverage and a much shorter scan time than its 3D counterpart, which makes it an optional scan sequence for patients who cannot tolerate long scan times. However, there is still a lack of an optimal setting for 2D APTw imaging in clinics for human brain tumors. Therefore, this study aims to explore the different combinations of pulse power and duration of saturation RF pulse in 2D APTw imaging on brain tumors and to find an optimal setting suitable for clinical use.Summary of Main Findings
This study reveals that when the power and duration of the saturation RF pulse is 2.0uT and 2.0s, the image quality and contrast are relatively good for quick 2D APT imaging in human brain tumors, and the MTRasym were significantly positively correlated with the Ki-67 index.Introduction
APT imaging is an emerging technique to probe mobile protein and peptide, tissue microenvironment in vivo, which has shown clinical promise in tumor and stroke1.However, 3D APT imaging usually takes a relatively long scan time2,3. Therefore, single-slice 2D APT imaging is preferable for patients who cannot tolerate long scan times. Unlike other traditional MRI methods, such as T1-weighted imaging (T1WI) or T2-weighted imaging (T2WI), the contrast of APT imaging is very complex and also affected by the power and duration of the saturation RF pulse, which should be optimized in different clinical scenario4. What is more, during APT imaging the specific absorption rate (SAR) resulting from long saturation RF pulse should also be paid more attention for safety. In this work, we explore the impact of different combinations of power and duration of the saturation RF pulse on 2D APT imaging in human brain tumors.Materials and methods
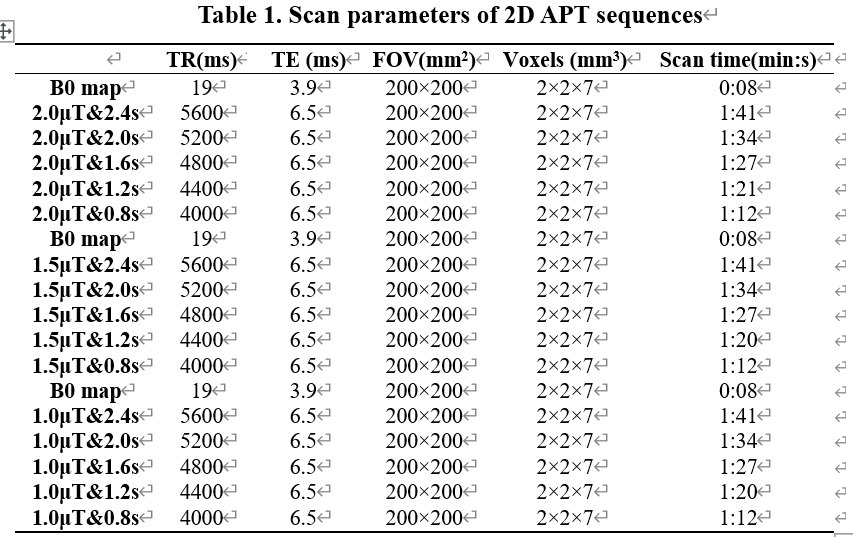
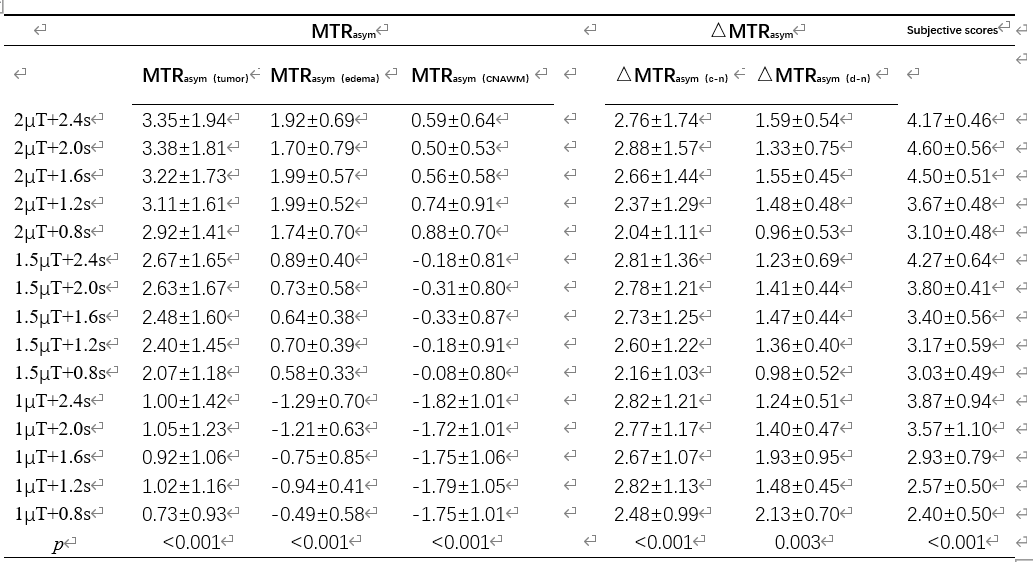
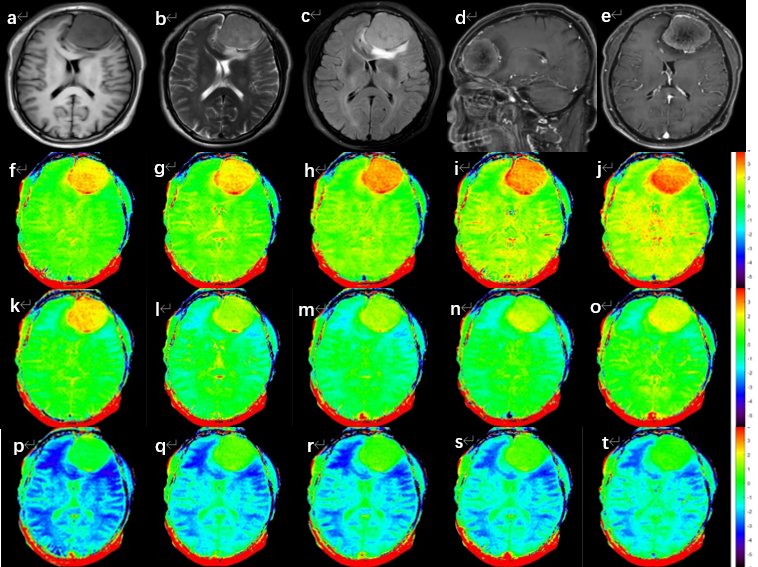
A total of 30 subjects (11 males, mean age: 54.7±11.9) were scanned using a 3.0 T MR scanner (Ingenia CX, Philips Healthcare, Netherlands) with a 32-channel head array coil. The scan sequences included T1WI, T2WI, 3D T1 contrast enhancement, and 2D- APT with different RF pulse saturation schemes (Table 1), and B0 mapping. A similar analysis procedure was adapted to extract the MTRasym (APTw) values using an in-house MATLAB script. The asymmetric analysis relative to the water frequency was carried out by the MTRasym method 1. The APT-weighted signal is the asymmetry of the 3.5 ppm z-spectrum calculated at MTRasym (3.5 ppm). Two observers with more than 3 years of diagnostic experience evaluated the images based on the Likert scale. The APT values of the three regions of interest (ROI) of the tumor core, the perigma edema, and the contralateral normal white matter region were measured separately. If there is no clear edema area, only the MTRasym values of the tumor core and the contralateral white matter region were measured. 4 ROIs were placed in each area, and the average value was taken as the MTRasym value of the corresponding ROI. MTRasym(c-n) represented the difference between the APT effect of tumor and normal white matter(△MTRasym(c-n)= MTRasym(tumor)- MTRasym(cnawm)),△MTRasym(d-n)indicates the difference between edema and the effect of normal white matter APT(△MTRasym(d-n)= MTRasym(edema)- MTRasym(cnawm)).The Friedman test was conducted to explore the differences in MTRasym values, △MTRasym values, and subjective scores among the different settings of the saturation RF pulse. The correlation between MTRasym (tumor) and Ki-67 expression measured by the Spearman correlation coefficient method to was also analyzed to select the optimal setting of the saturation RF pulse in 2D-APT sequences.Results
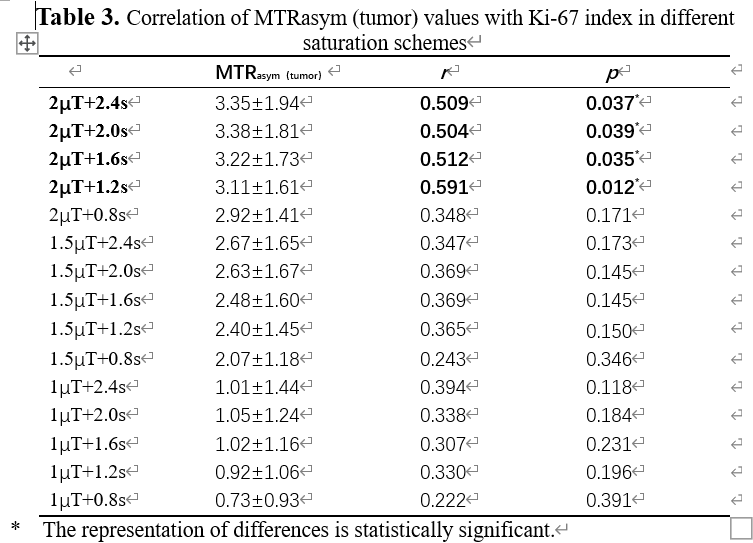
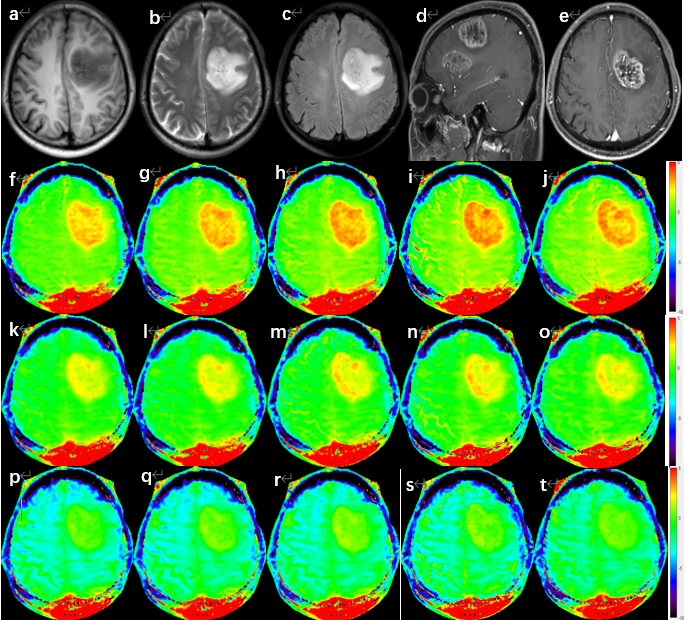
The measurement data and the score of the two observers were in good agreement (ICC:0.942~0.992,Kappa:0.778). The values of MTRasym,△MTRasym and subjective scores among the different settings of the saturation RF pulse were different (p<0.05) (Table 2). When the RF pulse saturation power is 2.0T and the duration is 2.0s, the MTRasym(tumor), MTRasym(c-n), and subjective ratings are at their peak. The MTRasym (edema) is greatest when the RF pulse saturation power is 2.0T and the duration is 1.6s. The MTRasym (cnawm) is highest when the RF pulse saturation power is 2.0T and the duration is 0.8s. MTRasym(d-n) is greatest when the RF pulse saturation power is 1.0T and the duration is 0.8s. Compared with the saturation RF pulse duration, the saturation power has a greater effect on MTRasym, and the higher the saturation power, the higher the MTRasym value. MTRasym (tumor) were positively correlated with the Ki-67 index at RF pulse saturation power of 2.0 μT and duration of 2.4s, 2.0s, 1.6s, and 1.2s, respectively.Discussion and Conclusions
APT imaging is playing a more and more important role in clinics. However, its contrast relies on the setting of the saturation RF pulse and the corresponding clinical scenario. Our study reveals that when the power and duration of the saturation RF pulse are 2.0uT and 2.0s, the image quality and contrast are relatively good for quick 2D APT imaging in human brain tumors4, and the MTRasym were significantly positively correlated with the Ki-67 index. In conclusion, we suggest that the optimal power and duration of the saturation RF pulse of 2D APT imaging is 2.0uT and 2.0s for patients with brain tumors who cannot tolerate long scan times.Acknowledgements
No acknowledgement found.References
1Zhou J, Zaiss M, Knutsson L, et al. Review and consensus recommendations on clinical APT‐weighted imaging approaches at 3T: Application to brain tumors[J]. Magnetic resonance in medicine. 2022;88(2):546-574.
2 Zhang Y, Yong X, Liu R, et al. Whole-brain chemical exchange saturation transfer imaging with optimized turbo spin echo readout[J]. Magnetic resonance in medicine. 2020;84(3):1161-1172.
3Zhou J, Zhu H, Lim M, et al. Three-dimensional amide proton transfer MR imaging of gliomas: Initial experience and comparison with gadolinium enhancement. J Magn Reson Imaging. 2013;38(5):1119-1128. 4Zhao X, Wen Z, Huang F, et al. Saturation power dependence of amide proton transfer image contrasts in human brain tumors and strokes at 3 T. Magnetic resonance in medicine. 2011;66(4):1033-1041.
Figures