2492
Optimisation of 1H MRS quantitation with tissue water referencing in the presence of brain tumour heterogeneity1Molecular and Clinical Sciences Research Institute, St George's, University of London, London, United Kingdom, 2Neurosurgery, St George's University Hospital Foundation Trust, London, United Kingdom, 3Neuroradiology, St George's University Hospital Foundation Trust, London, United Kingdom, 4Faculty of Medicine and University Hospital Carl Gustav Carus, OncoRay - National Center for Radiation Research in Oncology, Dresden, Germany, 5Image Analysis Group, London, United Kingdom
Synopsis
Keywords: Tumors, Spectroscopy, quantitation
A tissue water signal is frequently used as a reference for metabolite quantitation by 1H MRS. We have determined the variability of T1, T2 and PD in glial brain tumours and normal brain to assess how tumour heterogeneity affects the reference signal at 3T. The typical short echo time MRS parameters TR 2000ms and TE 32ms reside within a “sweet spot” of minimum variation in the product PD*exp(-TE/T2)*[1-exp(-TR/T1)] that determines the water reference signal across a wide range of tissues (NWM, tumour core, necrosis and oedema). This choice also provides good SNR per unit time for the key metabolite singlets.INTRODUCTION
1H MRS can aid brain tumour diagnosis, prognosis and evaluation of treatment response1. Short TE acquisitions provide maximum metabolite signals with ideally a quantitative assessment to eliminate confounds of metabolite ratios2. Brain tumours are heterogeneous, comprising variously, tumour core, oedema, cyst, necrosis with a wide range of T1, T2 and PD. The intensity of a reference water signal is partial volume and TE/TR dependent3. We have acquired parametric maps of low and high-grade brain tumours to enable full correction of the water reference signal for quantitative MRS and investigated if there is an optimum TE/TR that minimises water reference variability for quantitation.METHODS
This was a retrospective analysis of 3T MRI data from: 9 healthy controls (HC), 17 non-enhancing gliomas (13 diffuse astrocytoma, 3 oligodendroglioma, 1 anaplastic astrocytoma), 12 patients with ring enhancing glioblastomas. T2 maps were calculated from a log-fit to multi-TE acquisition (10 echoes, TE 18 to 286ms, TR 5206ms). T1 and PD maps were calculated from 3D GRE images with TR 10ms, TE 3.7ms with 3 and 20 degree flip-angle (FA)4. Parametric maps were co-registered to the FA 20 images. Single voxel MRS was acquired post-Gd using PRESS with TE 32ms, TR 2000ms, with LCModel used for metabolite quantitation (assumed water concentration of 41.7M with no relaxation time corrections).Tumour ROIs were defined semi-automatically with Jim software (Xinapse systems) and ImageJ (https://imagej.net/software/fiji/) to encompass: necrotic core; contrast-enhancing (CE) and non-CE regions; non-tumour WM hyperintensities; cyst and CSF. MRS voxels were mapped to parametric images using in-house software to obtain parameter information from non-enhancing non-necrotic tumour core and parietal white matter (PWM). Image segmentation of HC data provided normal white matter (NWM) and grey matter (NGM) averages. Parameter maps were used to create T1 and T2 weighted images and the product PD*exp[-TE/T2]*[1-exp(-TR/T1)] (PDT1wT2w) at defined TE and TR. Statistical calculations were performed with IBM SPSS v.28
RESULTS
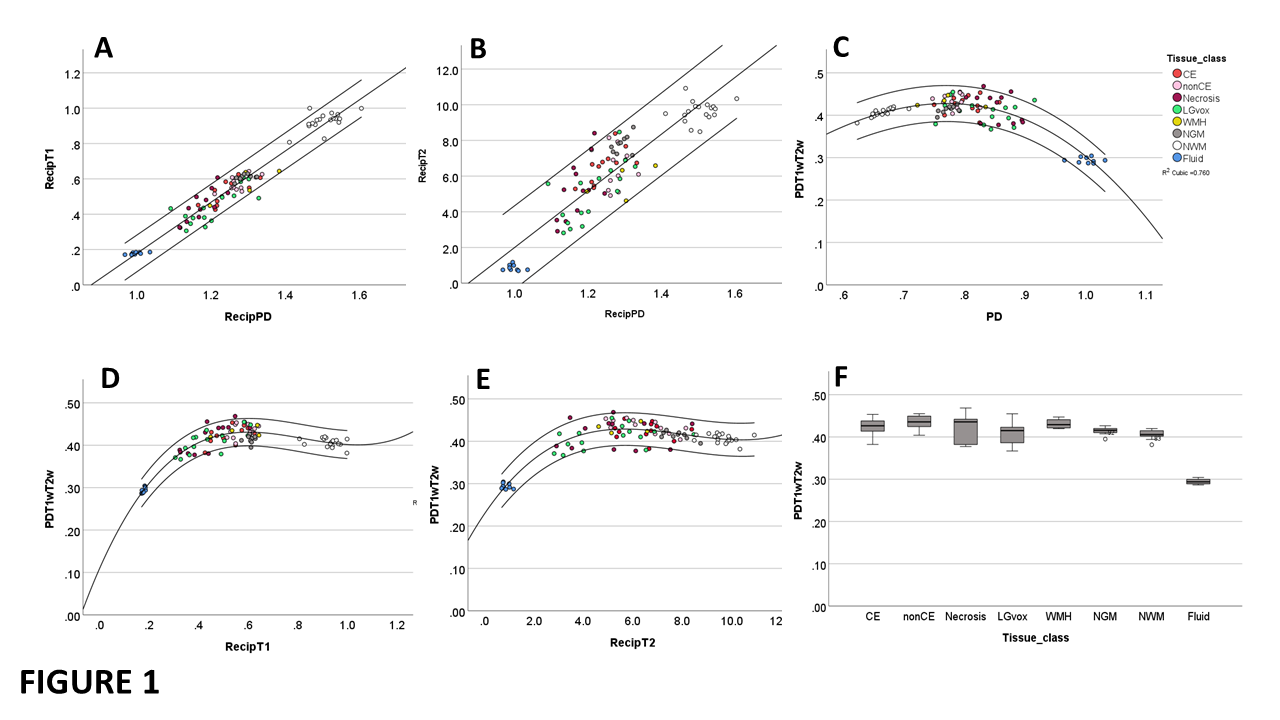
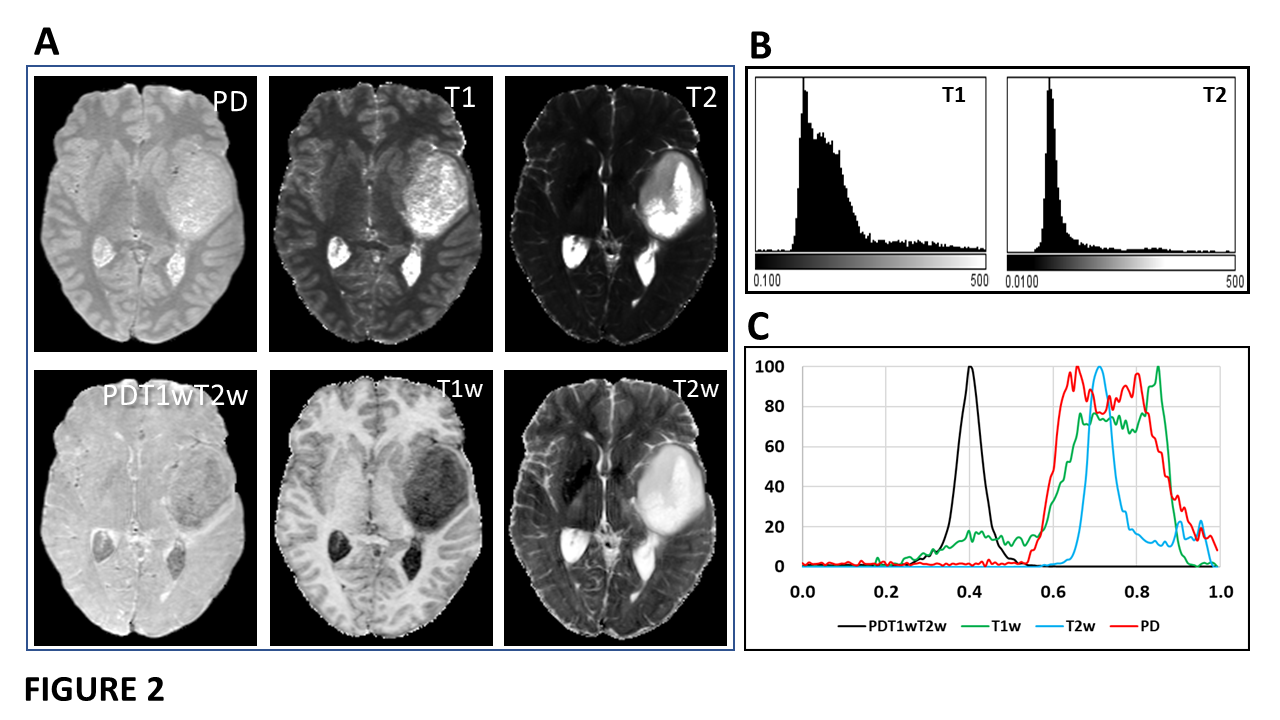
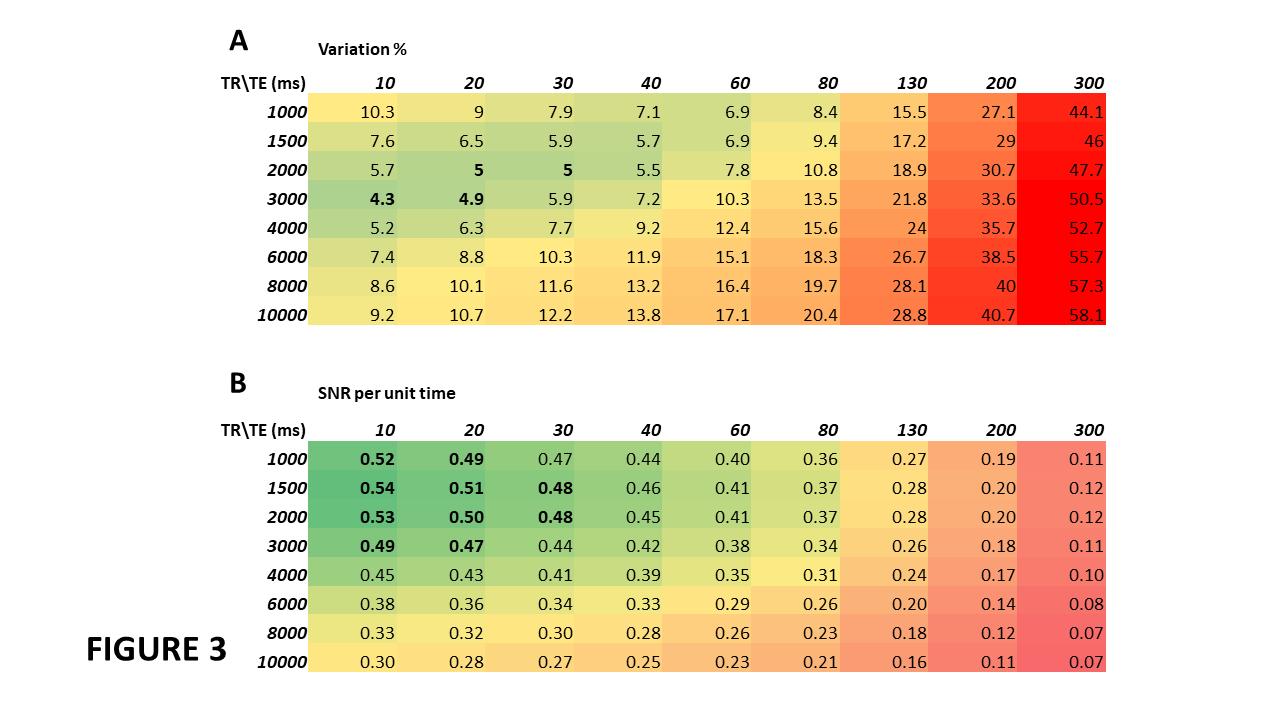
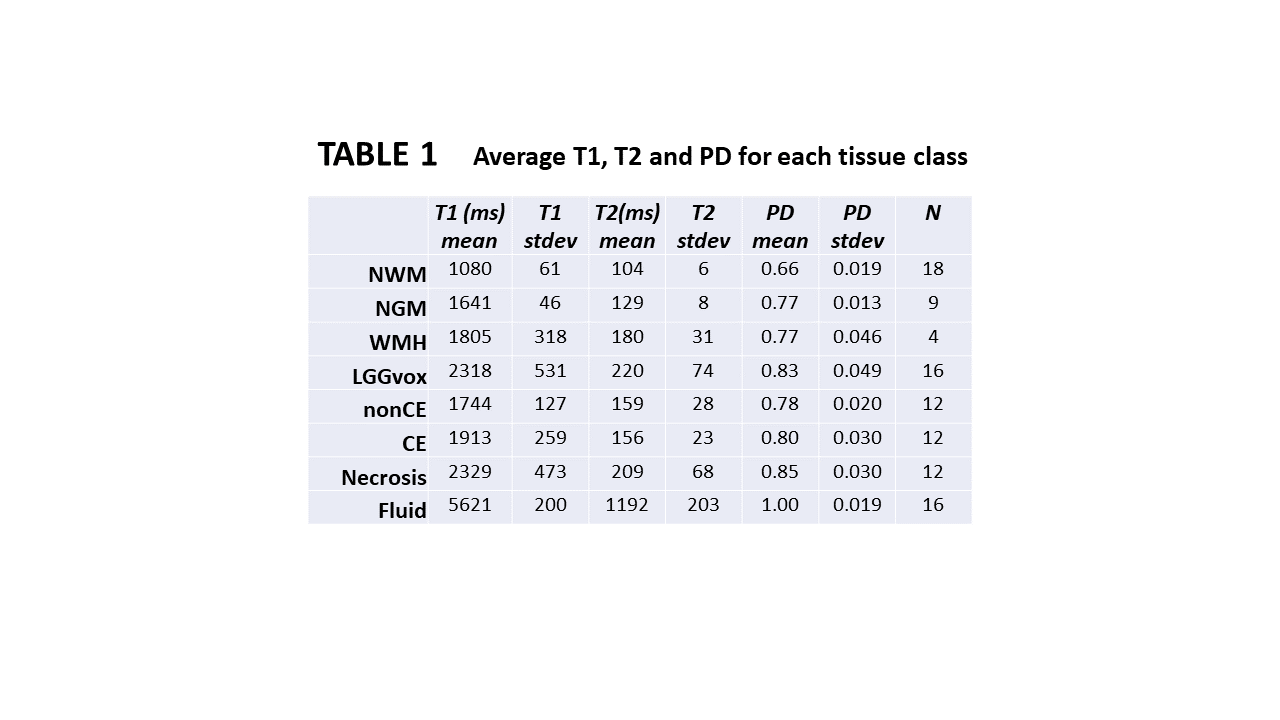
1/PD, 1/T1 and 1/T2 were strongly correlated across all tissue classes (Figs 1A-1B) and PDT1wT2w varied smoothly with PD, 1/T1 and 1/T2 across all tissues (Figs 1C-1E). At TE 32ms, TR 2000ms, PDT1wT2w was on average 0.42 +/-0.02 across all tissue classes, except for fluid (CSF and cyst) where it was 0.29. Table 1 provides average T1, T2 and PD for each tissue class.Figure 2 shows single slice images and their histograms of the raw parametric and calculated weighted maps for a large cystic low-grade glioma. Although very high heterogeneity in the individual maps, the PDT1wT2w map of variability in tissue water signal at TE 32ms, TR 2000ms, shows remarkable uniformity.PDT1wT2w was recalculated across the different tissue regions over ranges of TR (1,000-10,000ms) and TE (10-300ms) and the percentage variability (cf. Fig 1C) calculated across normal and tumour tissue classes shown in Fig 3A (excluding CSF and cyst). Assuming average metabolite T1 and T2 for tNAA (1380ms, 242ms), tCr (1380ms, 148ms) and tCho (1060ms, 189ms)5, we calculated an average SNR_per_unit_time for the same TE, TR range (Fig 3B).
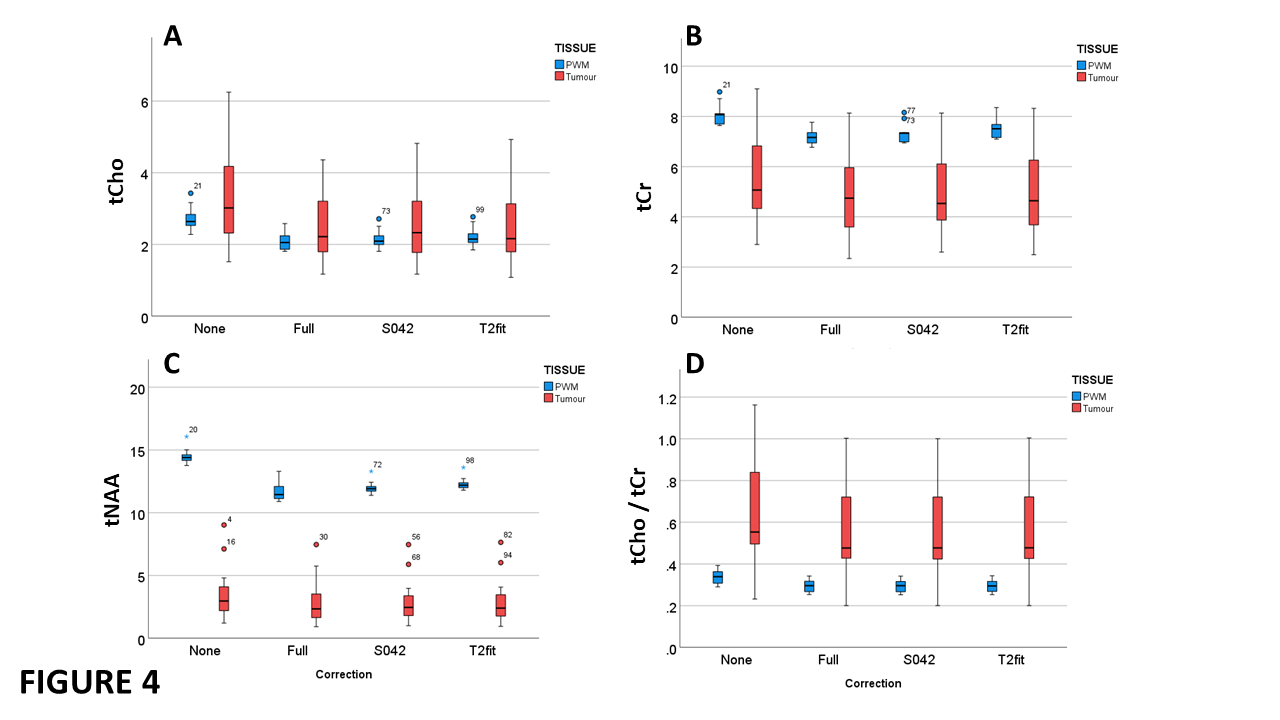
For MRS data from gliomas with no contrast-enhancement, pockets of cystic fluid, or haemorrhagic features, we compared various quantification strategies (Fig 4). LCModel quantification without corrections, and those corrected for metabolite T1 and T2 relaxation with: full correction for water PDT1wT2w; fixed correction factor of 0.42; a PDT1wT2w correction factor from a T2-fit (Fig 1E). Compared to the full correction, for NWM, the fixed 0.42 correction gave a systematic error of <3% (p<0.02), which was better than the T2 fit of 5% (p<0.001). For tumour tissue a systematic error of around 3% was also observed but only tCr showed a significant difference (p<0.05 for full correction vs. T2 fit). A ROC analysis to assess discrimination of tumours from PWM for each metabolite and quantitation method, showed all methods performed equally well for tCr, tNAA and tCho/tCr (AUCs 0.9, 1.00, 0.88), but tCho was not a good discriminator (AUC 0.56).
DISCUSSION
Despite high tumour heterogeneity, for a small range of MRS parameters, the water signal shows only a small dependence across a wide range of pathology due to compensation of increased PD with increased T1/T2 weighting factors. The historical TE/TR choice of typically 30ms/2000ms is within the sweet spot for minimal variation in water signal and maximum metabolite SNR per unit time. A fixed correction factor of 0.42 provides metabolite concentrations across normal brain and oedematous tumour regions within 5% of a fully quantitative method.Tumour tCho is not always elevated, as others observe6; significantly elevated tCho/tCr was mostly driven by reduced tCr. Strong correlation of relaxation rates to 1/PD (Figs 1A, 1B) is consistent with free-water and fast-exchange dominating relaxation processes7 across wide pathological variations. Deviations of higher R2 for necrotic tissue and NGM may relate to susceptibility effects from Fe compounds in NGM and microhemorrhage in necrosis.Limitations are for MRS acquired post-Gd in enhancing high-grade tumours with greatly altered water relaxation times, additionally the necrotic fraction needs accurate assessment to obtain a tumour tissue concentration.
In conclusion, for assessing non-enhancing glioma sub-types, their growth and treatment response, a straightforward PRESS acquisition with a water reference may provide sufficient “absolute” quantitation with no further correction factors.
Acknowledgements
This work was funded by an INNOVATE UK grant 103353 held jointly by St. George’s, University of London and Image Analysis Group, London, UK.References
1. Howe FA and Peet AC. MRS in brain cancer. Chapter 57, Handbook of Magnetic Resonance Spectroscopy In Vivo: MRS Theory, Practice and Applications. 2016. DOI: 10.1002/9780470034590.emrstm1425
2. Wilson M, Andronesi O, Barker PB et al. Methodological consensus on clinical proton MRS of the brain: Review and recommendations. Magn Reson Med 2019;1-24. DOI: 10.1002/mrm.27742.
3. Gasparovic C, Chen H, Mullins PG. Errors in 1H‐MRS estimates of brain metabolite concentrations caused by failing to take into account tissue‐specific signal relaxation. NMR in Biomedicine. 2018;31:e3914. doi.org/10.1002/nbm.3914
4. Volz S, Noth U, Deichmann R. Correction of Systematic Errors in Quantitative Proton Density Mapping. Magnc Reson Med 2012;68:74–85. DOI 10.1002/mrm.23206
5. Li Yan, Srinivasan, Ratiney H et al. Comparison of T1 and T2 Metabolite Relaxation Times in Glioma and Normal Brain at 3T. J Magn Reson Imag. 2008;28:342–350.
6. Chawla S, Lee S-C, Mohan S. Lack of choline elevation on proton magnetic resonance spectroscopy in grade I–III gliomas. Neuroradiol J. 2019; 32: 250–258. doi: 10.1177/1971400919846509
7. Fatouros PP, Marmarou A, Kraft KA. In Vivo Brain Water Determination by T1 Measurements: Effect of Total Water Content, Hydration Fraction, and Field Strength. Magn Reson Med 1991;17,402-413.
Figures