2491
Amide proton transfer-weighted MRI of brain tumors with fluid & solid compartment corrections using background magnetization transfer effects1Molecular Imaging & Diagnosis, Graduate School of Medical Sciences, Kyushu University, Fukuoka, Japan, 2Philips Research, Hamburg, Germany, 3Department of Radiology Informatics and Network, Graduate School of Medical Sciences, Kyushu University, Fukuoka, Japan, 4Department of Clinical Radiology, Graduate School of Medical Sciences, Kyushu University, Fukuoka, Japan, 5Division of Radiology, Department of Medical Technology, Graduate School of Medical Sciences, Kyushu University, Fukuoka, Japan
Synopsis
Keywords: Tumors, CEST & MT
We propose a simple and efficient metric for APT-weighted MRI, which suppresses fluid signals and enhances signals form solid components based on the spectral shape of the background MT ratio. No extra acquisition or mathematical fitting is needed because the metric can be computed from the minimum Z-spectral data required for standard APT-weighted MRI. This post-processing normalizing for background MT effects may facilitate the quantitative evaluation of the APT-weighted signal of the active solid component in brain tumors.Introduction
Promising clinical applications of amide proton transfer weighted (APTw) MRI are envisioned in oncology and in stroke1, 2. One potential issue of APTw MRI is that the same magnetization transfer ratio (MTR) asymmetry analysis is performed on tissues with various MT effects. As a result, for fluid components with no/little background MT effect (e.g., cyst, necrosis), the CEST effect can be thoroughly evaluated, whereas, for solid components with large MT effect, the CEST effect can be underestimated by MTRasym when overlapping with background MT effects (Figure 1). Compartments with fluid content, like necrosis, cyst, or hemorrhage, may complicate image reading and affect quantitative signal measurements. We previously reported a post-processing method based on an MT ratio-based metric to suppress fluid signals within tumors3. This study aimed to further explore efficient post-processing schemes for APTw signals using MT effects in brain tumors.Methods
Subjects: Fourteen patients with glioblastoma, IDH-wildtype (62.9±10.7-year-old, two males and 12 females) were selected based on the inclusion criteria: supratentorial tumor with ring-shaped contrast enhancement with necrosis greater than 2cm in diameter.MRI: A 3.0T MRI- scanner (Ingenia Elition 3.0T, Philips, Netherlands) with 2-channel body-coil transmission and 16-channel neuro-vascular head coil reception was used with the following parameters: 40×50ms = 2s sinc-gaussian pulsed saturation (100% duty cycle by alternated transmission), B1=2μT, 25 Z-spectral images S[ω] (ω=−6…6ppm, step 0.5ppm, and S0, ω=−1560ppm), 2D single-shot fast spin-echo, driven equilibrium refocusing, sensitivity encoding R=2, FOV=230×230mm, voxel size=1.8×1.8×5 mm, TR/TE=5s/6.2ms, acquisition time 2½ min.
Post-processing: MTR is defined as MTR[∆ω]=1-S[∆ω]/S0, where S[Δω] denotes the signal at the saturation frequency Δω. A standard method to derive APTw images is: MTRasym [3.5 ppm]=(MTR-3.5 ppm-MTR+3.5 ppm)/S0 . We define the new metric as follows: MTRasym MT norm [3.5 ppm]=[MTRasym (MTR-3.5 ppm+MTR+3.5 ppm)]epsilon. Here epsilon≥0 is an exponent to tune the strength of MT-normalization, which suppresses APTw signal of tissue with a small MT effect and enhances the signal of tissue with a large MT effect. Optionally, a limit is set for the signal enhancement.
Image Analysis: Co-registration of contrast-enhanced T1-weighted and APTw image was performed using the TurboReg function (affine registration). The ROIs were placed on a contrast-enhanced T1-weighted image to include contrast-enhancing area, necrosis, and normal appearing white matter (NAWM). The ROIs were copied onto the corresponding APT-weighed image. The mean value within the ROI was used for the analysis.
Results
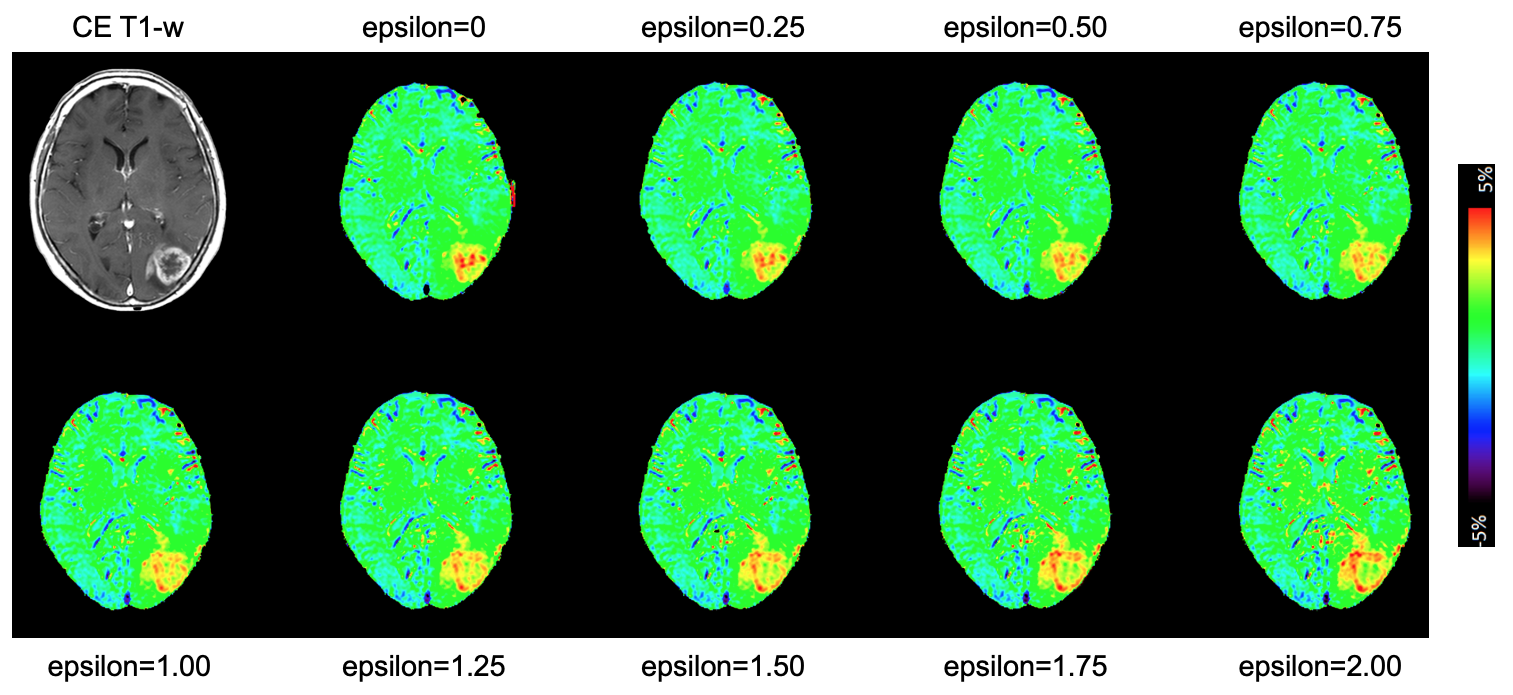
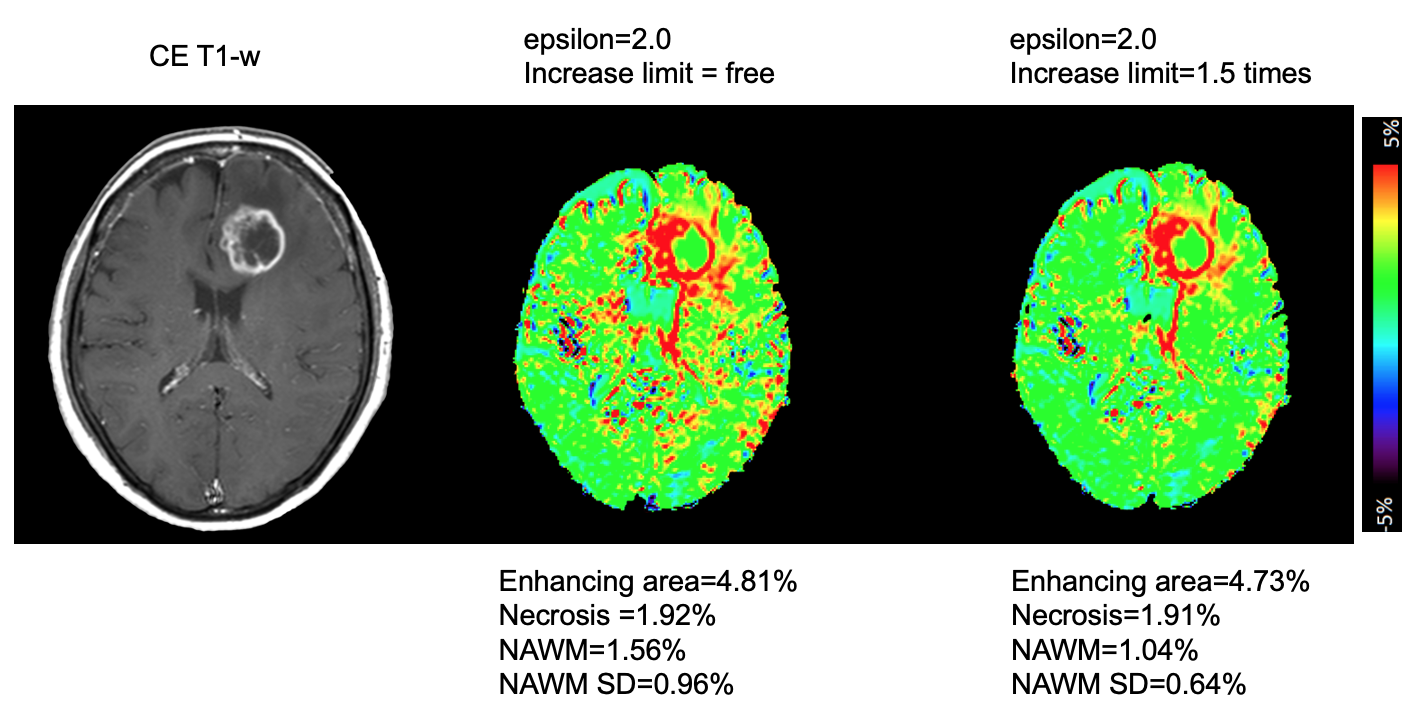
Figure 2 indicates the MT-normalized APTw images with epsilon varied from 0 to 3. The APT-weighed image with an epsilon of 0 corresponds to a conventional MTRasym[3.5ppm] map, showing high signals both in the peripheral enhancing area and central necrosis. As epsilon increases, the signal in the necrosis decreases, while the signal in the enhancing area remains high; however, background noise increases as epsilon increases. Figure 3A shows mean MT-normalized APTw signals in the enhancing area, necrosis, and NAWM. The signals in the enhancing area increase as epsilon increases (4.06±0.96 at epsilon=0, 4.07±0.88 at epsilon=1.0, 4.27±0.96 at epsilon=2.0, 4.64±1.17 at epsilon=3.0). The signals in the necrosis decrease as epsilon increases (6.12±1.77 at epsilon=0, 3.63±0.70 at epsilon=1.0, 2.30±0.70 at epsilon=2.0, 1.58±0.86 at epsilon=3.0). Figure 3B shows the MT-normalized APTw signals in the NAWM and its standard deviation (SD). Both the signals in the NAWM and its SD increase as epsilon increases (0.41±0.35 at epsilon=0, 0.59±0.50 at epsilon=1.0, 0.85±0.74 at epsilon=2.0, 1.22±1.08 at epsilon=3.0). With epsilon≈2.00, signal intensity remains <1 and SD<1 in the NAWM. Figure 4 shows that with epsilon=0, the signal of central necrosis is higher than that of the peripheral enhancing areas. However, as epsilon increases, the signal of the enhancing areas increases, and the signal of necrosis decreases. As a result, with epsilon=2.0, the signal of the enhancing areas is higher than that of the necrosis. If the signal increase is limited to 1.5×, background noise is suppressed, and the solid component is not affected significantly (Figure 5).Discussion
The results demonstrated the potential of an efficient fluid-suppressing metric to visualize solid tumor components by the normalizing APTw signal via background MT effects. No extra acquisition or mathematical fitting is needed because the metric can be computed from the minimum Z-spectral data required for standard APTw MRI. Epsilon=1 is equivalent to the previous method3, but signal increase in areas of strong MT was not included, and fluid suppression was insufficient in some cases. As epsilon increased, the suppression of the signal in the necrosis became greater, but so did the background noise. Considering this fact, a maximum epsilon of around 2 seemed optimal, keeping signal and SD in NAWM limited. The signal of the enhancing area increased by a factor of 1.14 as epsilon increased from 0 to 2, while the noise increased by a factor of 2.43. By constraining the upper limit of signal increase to 1.5×, the background signal and noise increase could be suppressed without affecting the signal increase in the enhancing areas.Conclusion
An efficient metric for APTw MRI, which suppresses signals in fluid components and enhances signals in solid components by normalizing to background MT, has been proposed. Further analysis is needed to evaluate if this post-processing may enhance glioma grading by better highlighting aggressive tumor components.Acknowledgements
No acknowledgement found.References
1. Zhou J, Payen JF, Wilson DA, et al. Using the amide proton signals of intracellular proteins and peptides to detect pH effects in MRI. Nat Med 2003;9:1085-10902.
2. Togao O, Yoshiura T, Keupp J, et al. Amide proton transfer imaging of adult diffuse gliomas: correlation with histopathological grades. Neuro Oncol 2014;16:441-4483.
3. Keupp J, Togao O. Magnetization transfer ratio based metric for APTw or CEST MRI suppressing signal from fluid compartments: Initial Application to Glioblastoma Assessment. Proc Int Soc Magn Reson Med 2018 2018;3156
Figures
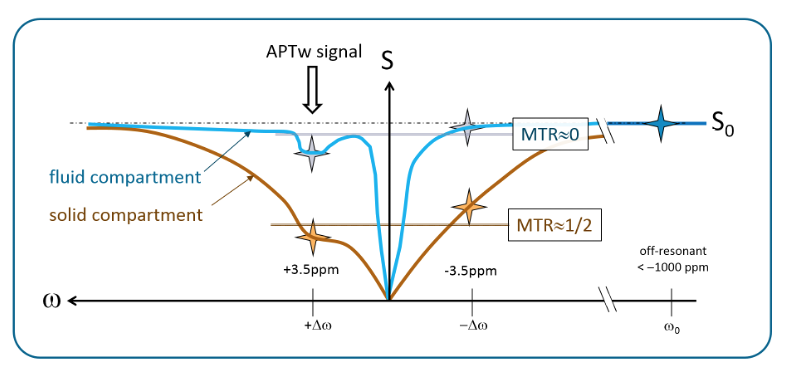
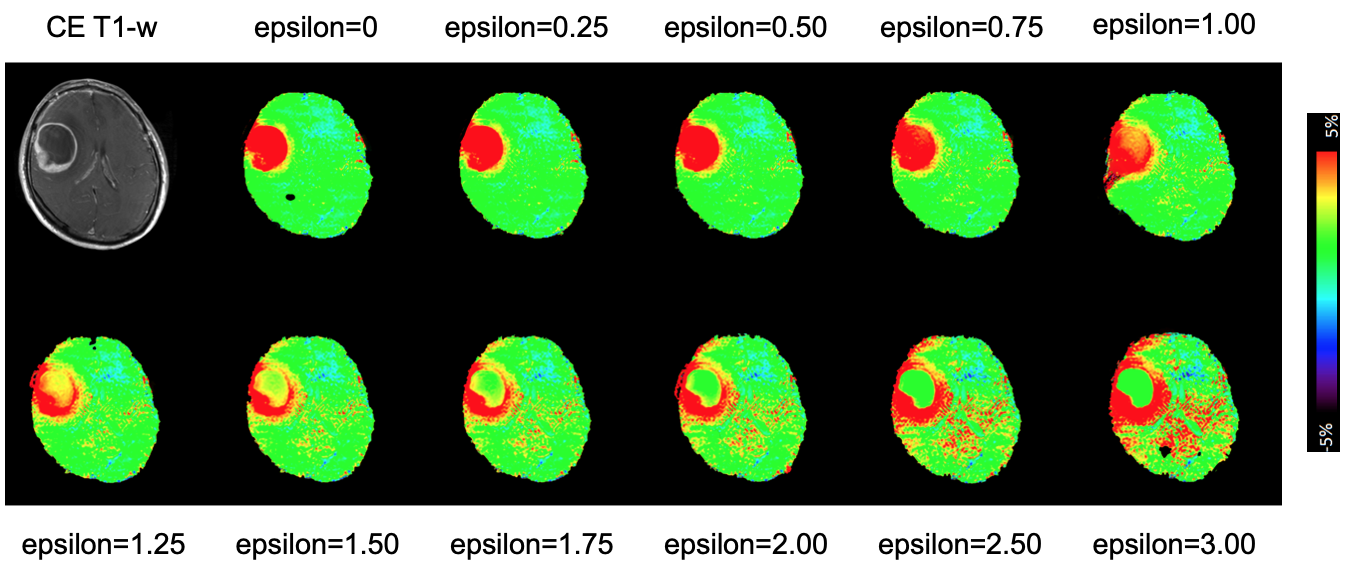
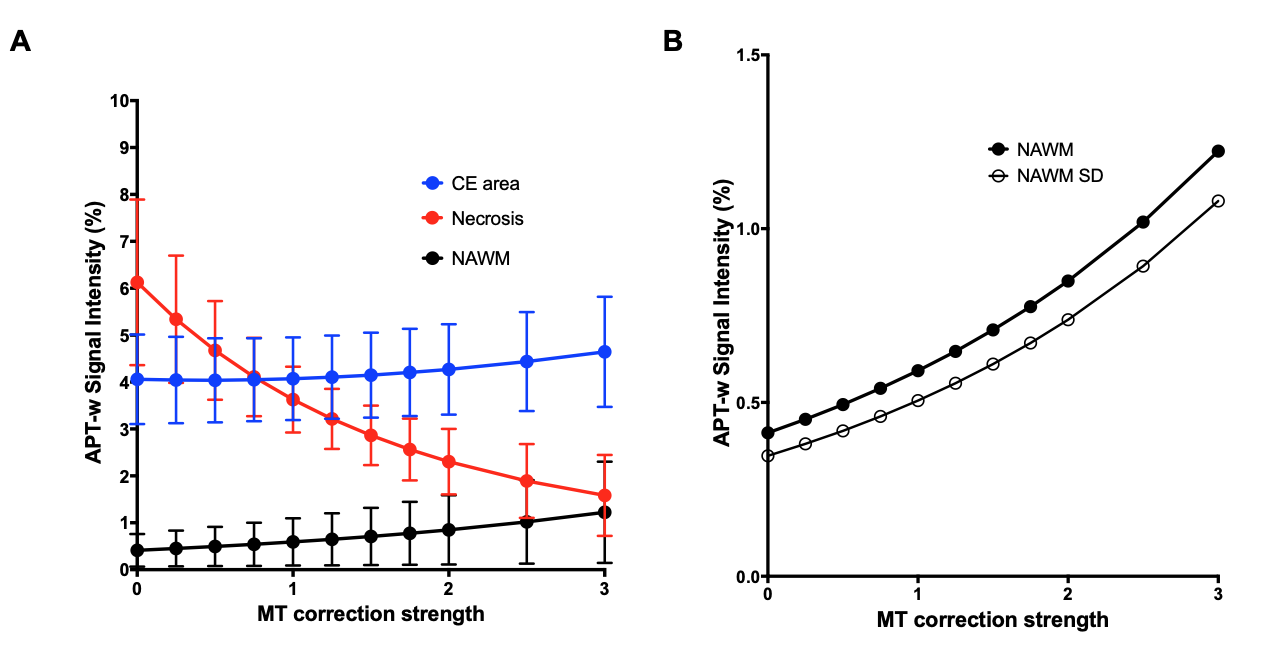
Figure 3. (A) Mean MT-normalized APTw signals in the enhancing area, necrosis, and NAWM. The signals in the enhancing area increase as epsilon increases. The signals in the necrosis decrease as epsilon increases.
(B) Mean MT-normalized APTw signals in the NAWM and its standard deviation (SD). Both the signals in the NAWM and its SD increase as the epsilon increases. With epsilon≈2.00, signal intensity remained <1 and SD<1 in the NAWM.