2488
Cerebral vessel size imaging reveals altered microvascular architecture in patients with vascular cognitive impairment1Department of Radiology and Nuclear Medicine, School for Mental Health and Neuroscience, Maastricht University Medical Center, Maastricht, Netherlands, 2Department of Neurology, CARIM School for Cardiovascular Diseases, Maastricht University Medical Center, Maastricht, Netherlands
Synopsis
Keywords: Blood vessels, Blood vessels, Vessel size imaging
With vessel size imaging, utilizing hybrid spin-echo gradient-echo perfusion scans, we studied microvascular architectural differences in patients with vascular cognitive impairment (VCI). We found lower vessel density and larger vessel radii in white matter hyperintensities compared to normal-appearing white matter. Moreover, we observed lower vessel density and larger vessel radii in deep gray matter of VCI patients compared to controls. Our findings suggest that the smallest capillaries are the first to collapse in VCI pathology and that the microvasculature not only alters in visibly injured tissue but also in regions that are less prone to hypoperfusion (gray matter).Introduction
Cerebral small vessel disease (cSVD) is the most common cause of vascular cognitive impairment (VCI)1. The endothelial and perivascular cells play an important role in the pathophysiology of cSVD. For example, endothelial dysfunction and enhanced pericyte contraction both decrease the microvessel diameter and in turn can cause a loss of microvessels, whereas the loss of pericytes increases the microvessel diameter, leading to uneven flow patterns2. However, unraveling the exact pathophysiology underlying cSVD and corresponding altered vascular morphology remains challenging2.Vessel size imaging is an MRI technique that can provide more insight into the microvascular architectural changes in the course of cSVD. By acquiring intertwined dynamic gradient echo (GE) and spin echo (SE) in response to the passage of a paramagnetic contrast agent bolus, estimates for the microvascular radius and density can be derived3. Our study is the first to apply dynamic vessel size imaging in VCI patients, and aims to investigate microvascular architectural differences in VCI compared to healthy controls.
Methods
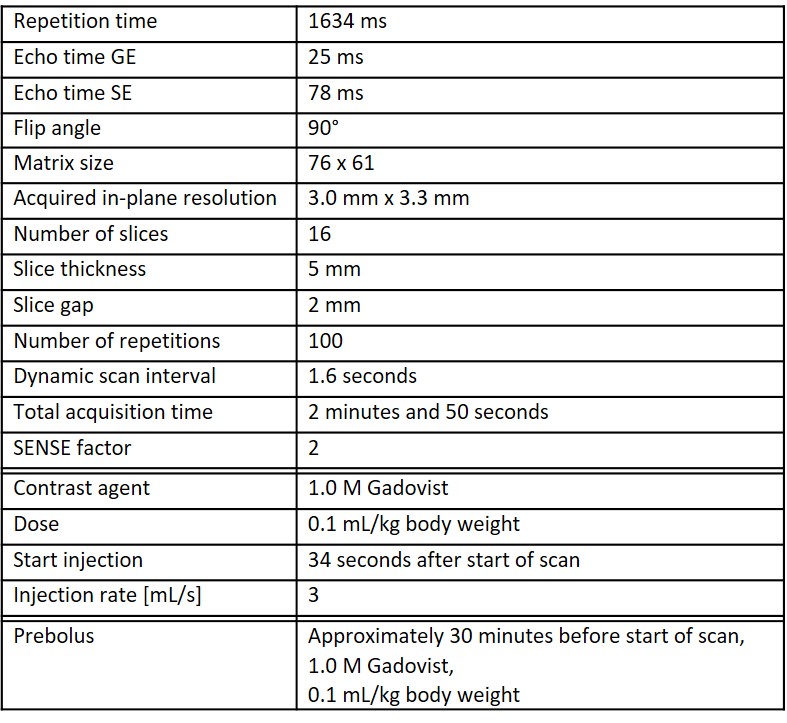
Subjects: Fourteen patients with VCI due to cSVD (9 males; age range: 63-82 years) and ten healthy controls (HC) (6 males; age range: 64-79 years) underwent 3T MRI (Philips, Ingenia). VCI patients had objective cognitive impairment (Montreal Cognitive Assessment (MoCA) < 26 or cognitive impairment in at least 1 cognitive domain in neuropsychological assessment), as well as imaging evidence of cSVD (white matter hyperintensities (WMH) Fazekas score ≥ 2 or Fazekas 1 and lacunar infarcts/deep microbleeds).MRI acquisition: Vessel size imaging was acquired with a dynamic rapid transverse single-shot GE SE echo-planar-imaging (EPI) sequence (see Table 1). To calculate the extravascular diffusion coefficient (D), diffusion-weighted MRI (dMRI) was performed in three orthogonal diffusing-sensitizing directions with b-values of 200, 300, 400, 500, 600, 800, and 1000 s/mm2. Additionally, GE and SE, as well as b=0 s/mm2 images were acquired with reversed phase-encoding direction to correct for EPI distortions. Furthermore, T2-FLAIR and T1-weighted images were performed for anatomical reference.
Image analysis: The dynamic GE and SE images were corrected for subject motion (FSL mcflirt 4) and EPI distortions (FSL topup 5). Subsequently, the R2* and R2 relaxation rate time-series were calculated (from GE and SE, respectively). The vessel density index (Q) was derived on a voxel-wise basis by Q=∆R2/(∆R2*)2/3, where ∆R2* and ∆R2 were assessed around the bolus peak3. Furthermore, a quantitative measure for the weighted-average of blood vessel radii (=vessel size index (VSI)) was obtained according to 3: VSI=0.867·(rCBV·D)1/2·Q-3/2. Here, rCBV is the relative cerebral blood volume, derived from the dynamic GE images 6, and D was obtained by fitting a mono-exponential function to the dMRI signal decay for b>200 s/mm2.7 The deep gray matter (DGM), cortical gray matter (CGM), normal-appearing white matter (NAWM), and WMHs were automatically segmented from the T2-FLAIR and T1-weighted images using samseg followed by manual corrections8.
Statistical analysis: Within the VCI group, we compared the VSI and Q between WMH and NAWM, and between gray matter (GM) and NAWM using paired-samples t-tests. To examine possible microvascular alterations in normal-appearing brain regions in VCI (regions-of-interest (ROIs): NAWM, DGM, and CGM), we compared the ROI-averaged VSI and Q measures between VCI patients and HC with multivariable linear regression, correcting for age and sex.
Results
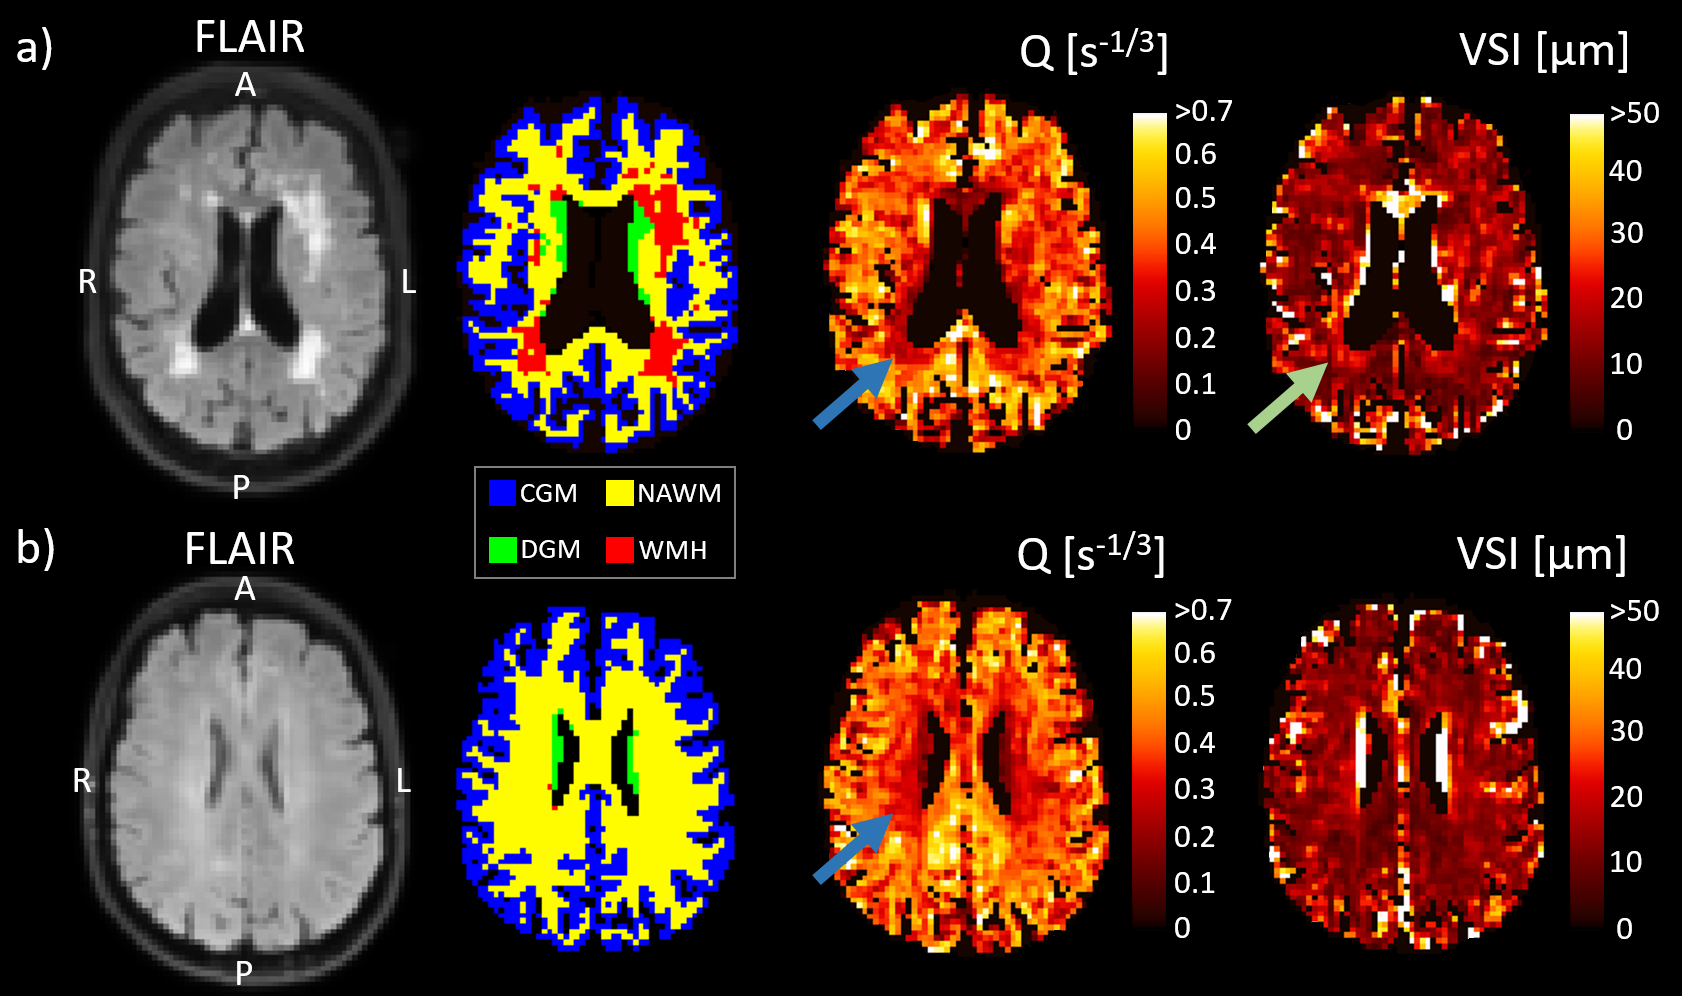
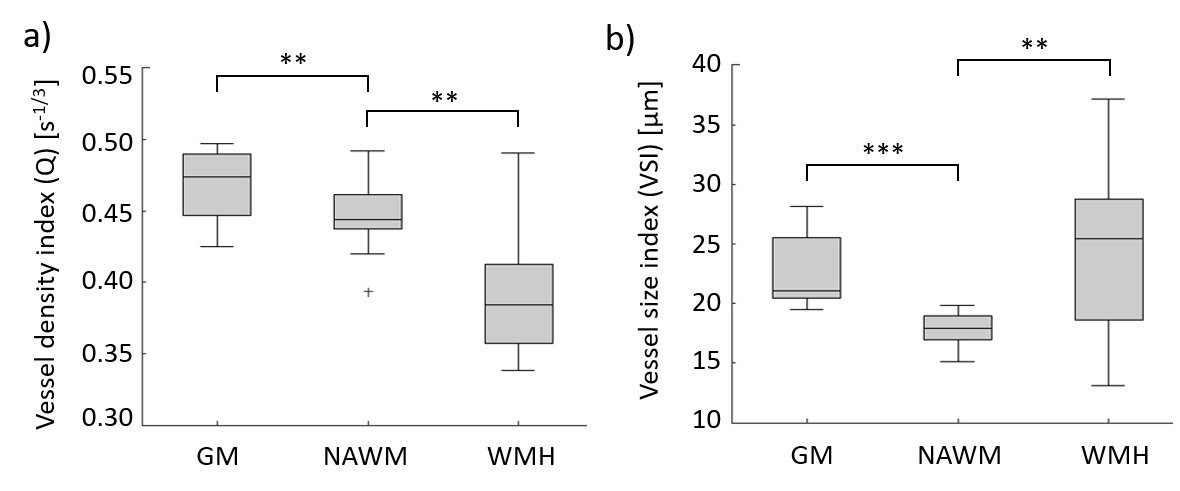
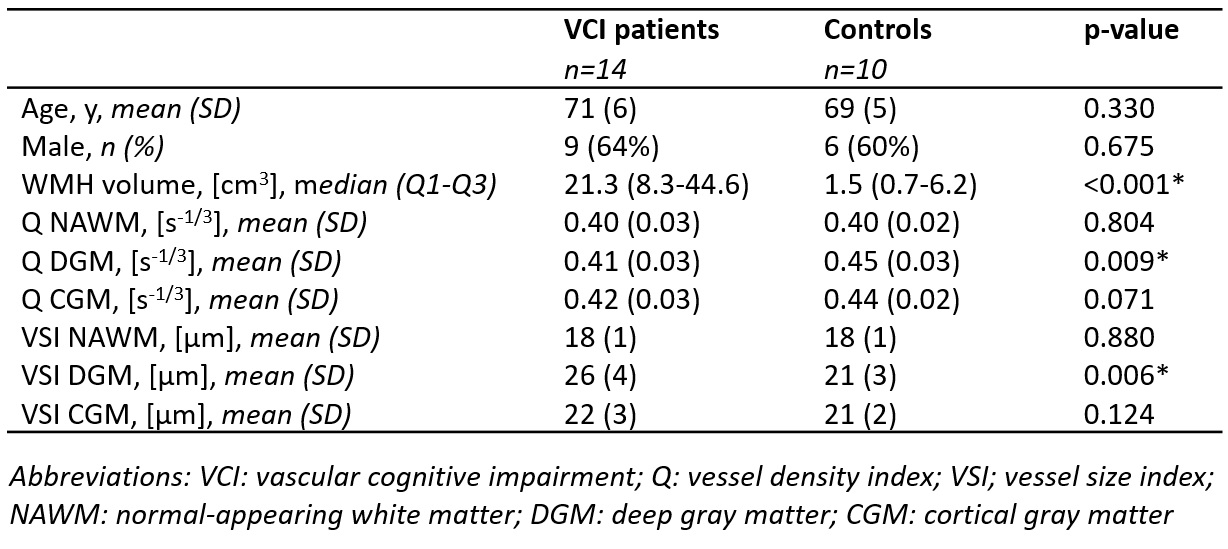
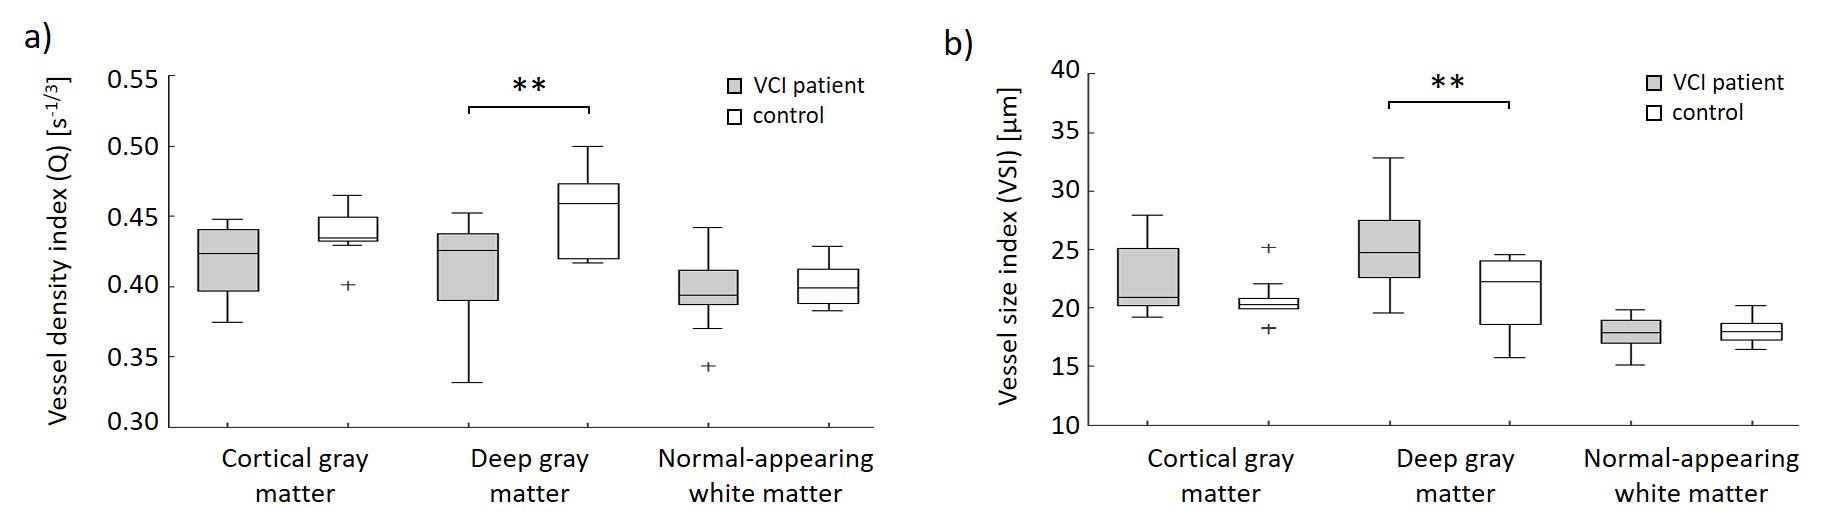
Examples of the obtained Q and VSI maps for a VCI patient and a HC are shown in Figure 1. For the VCI patients, Q was 15% lower in WMH and 5% higher in GM compared to NAWM (p=0.001 and p=0.002, respectively), whereas the VSI was 38% higher in WMH and 26% higher in GM compared to NAWM (p=0.001 and p<0.001, respectively), as visualized in Figure 2.Table 2 summarizes the vessel size imaging measures in the VCI and HC group. As can be observed in Figure 3, the VCI patients had 9% lower Q and 19% higher VSI in DGM compared to HC (p=0.008 and p=0.012, respectively).
Discussion & Conclusion
Our study provides evidence of microvascular architectural abnormalities in VCI patients using dynamic vessel size imaging. In line with previous MRI perfusion and histology studies, we found lower Q (vessel density) in WMH and higher Q in GM compared to NAWM9,10. Moreover, the higher VSI in WMH compared to NAWM is in concordance with a previous study that applied steady-state vessel size imaging in vascular dementia11. The increased VSI found in WMH could imply that the blood vessels dilate to compensate for hypoperfusion, and/or that the smallest capillaries collapse or disappear, increasing the weighted-average VSI due to more contribution of the larger blood vessels. The decreased Q in WMH is in agreement with the latter explanation.Furthermore, the lower Q and higher VSI in DGM of VCI patients compared to controls might imply that pathophysiological processes underlying cSVD are widespread, where capillary rarefaction in gray matter precedes or coincides with white matter damage. In conclusion, dynamic vessel size imaging has great potential to study early widespread microvascular alterations in the course of cSVD leading to VCI. The quantitative biomarkers of this new imaging tool might aid in monitoring the microvascular biological effects of disease progress and responses to treatment in cerebrovascular diseases.
Acknowledgements
This work has received funding from the European Union’s Horizon 2020 research and innovation programme ‘CRUCIAL’ under grant number 848109.
Furthermore, we would like to thank Martin Buehrer (Gyrotools) for providing the patch and supporting the installation of the hybrid gradient echo spin echo sequence.
References
1. Østergaard L, Engedal TS, Moreton F, et al. Cerebral small vessel disease: capillary pathways to stroke and cognitive decline. J Cereb Blood Flow Metab. 2016;36(2):302-25.
2. van Dinther M, Voorter PH, Jansen JF, et al. Assessment of microvascular rarefaction in human brain disorders using physiological magnetic resonance imaging. J Cereb Blood Flow Metab. 2022;41(11):1-20.
3. Troprès I, Pannetier N, Grand S, et al. Imaging the microvessel caliber and density: principles and applications of microvascular MRI. Magn Reson Med. 2015;73(1):325-41.
4. Jenkinson M, Bannister P, Brady M, Smith S. Improved optimization for the robust and accurate linear registration and motion correction of brain images. Neuroimage. 2002;17(2):825-41.
5. Andersson JL, Skare S, Ashburner J. How to correct susceptibility distortions in spin-echo echo-planar images: application to diffusion tensor imaging. Neuroimage. 2003;20(2):870-88.
6. Kellner E, Breyer T, Gall P, et al. MR evaluation of vessel size imaging of human gliomas: Validation by histopathology. J Magn Reson Imaging. 2015;42(4):1117-25.
7. Paschoal AM, Leoni RF, Dos Santos AC, Paiva FF. Intravoxel incoherent motion MRI in neurological and cerebrovascular diseases. Neuroimage Clin. 2018;20:705-14.
8. Cerri S, Puonti O, Meier DS, et al. A contrast-adaptive method for simultaneous whole-brain and lesion segmentation in multiple sclerosis. Neuroimage. 2021;225:117471.
9. Wong SM, Jansen JF, Zhang CE, et al. Blood-brain barrier impairment and hypoperfusion are linked in cerebral small vessel disease. Neurology. 2019;92(15):e1669-e77.
10. Moody DM, Thore CR, Anstrom JA, et al. Quantification of afferent vessels shows reduced brain vascular density in subjects with leukoaraiosis. Radiology. 2004;233(3):883-90.
11. Choi HI, Ryu CW, Kim S, et al. Changes in Microvascular Morphology in Subcortical Vascular Dementia: A Study of Vessel Size Magnetic Resonance Imaging. Front Neurol. 2020;11:1302.
Figures