2487
Characterization of Cerebral Perforating Arteries using submillimeter-resolution PC-MRI with Dual-VENC at 3T: A Feasibility Study
Jianing Tang1,2, Helena Chui3, and Lirong Yan2,3
1Biomedical Engineering, Northwestern University, Evanston, IL, United States, 2Radiology, Northwestern University, Evanston, IL, United States, 3Department of Neurology, University of Southern California, Los Angeles, CA, United States
1Biomedical Engineering, Northwestern University, Evanston, IL, United States, 2Radiology, Northwestern University, Evanston, IL, United States, 3Department of Neurology, University of Southern California, Los Angeles, CA, United States
Synopsis
Keywords: Blood vessels, Brain
Direct characterization of cerebral perforating arteries, such as lenticulostriate arteries (LSAs), can provide valuable insight for understanding the pathology of small vessel diseases. Previous studies have demonstrated the feasibility of 7T PC-MRI for the characterization of LSA pulsatility. However, 7T MRI has not been in widespread use in both clinical and research studies, compared to conventional 3T. The current study aims to study the feasibility of using 3T dual-VENC PC-MRI to characterize LSA pulsatility. Our results show that 3T PC-MRI with dual-VENC offers reliable LSA pulsatility measurements that are comparable to 7T measurements.Introduction
In small vessel disease (SVD), the existing vascular imaging markers, such as white matter hyperintensity, lacunar infarcts, microbleeds, etc., mainly focus on brain parenchyma. There is still a lack of research in directly assessing the functions of small vessels in the brain, such as cerebral perforating arteries. The dysfunction of cerebral perforating arteries is the major cause of SVD. Recent 7T studies have demonstrated that the arterial pulsatility of cerebral perforating arteries, such as lenticulostriate arteries (LSAs), can be characterized using submillimeter-resolution MRI at ultra-high field 7T MRI3. However, 7T MRI has not been in widespread use in clinical practice due to its high cost and inherent technical challenges such as B1/B0 inhomogeneities and high specific absorption rate (SAR). A more recent study has initially demonstrated the possibility of detecting and measuring the pulsatility of cerebral perforating arteries using conventional 3T MRI4. To overcome the reduced VENC-to-noise ratio (VNR) and improve the reliability of LSA pulsatility measurement at 3T, in this study, we proposed a submillimeter-resolution phase-contrast MRI with dual-VENC for 3T LSA pulsatility assessment. The 3T performance on LSA characterization was further compared with that at 7T.Methods
Twelve healthy volunteers (2 females, 24.1 ± 4.0 years) participated in this study. Retrospectively gated 2D phase-contrast MRI (PC-MRI) sequences with VENCs of 20 cm/s and 40 cm/s were performed on each participant on the following imaging parameters: FOV= 180x200 mm2, slice thickness= 2 mm, voxel size= 0.2x0.2x2.0 mm, flip angle= 60°, real temporal resolution= ~100ms, 20 phases across a cardiac cycle, 5 averages. A 3D high-resolution TOF was performed on each subject prior to the PC-MRI scans to image the structure of LSAs, which was used as the spatial reference for PC-MRI positioning. To test the reproducibility of 3T LSA assessment, test & retest scans were performed on 10 participants. To further validate the reliability of 3T LSA measurements, 9 participants underwent PC-MRI scans on a Siemens 7T Terra MRI scanner with closely matched imaging parameters except with three averages. Participants were scanned on the same day for both 3T and 7T. Background phase correction and phase unwrapping were done before the velocity and PI were calculated. In dual-VENC data analysis, high VENC phase maps were used to unalias the phase wrapping in low VENC phase maps to ensure a correct velocity profile. To evaluate the performance of PC-MRI with dual-VENC over the conventional PC-MRI with a single-VENC, we compared the PI measures between a single-VENC of 40cm/s and dual-VENC of 20cm/s and 40cm/s. Test-retest reproducibility of PI measurements at 3T was evaluated using the Bland-Altman analysis. A Wilcoxon signed-rank test was conducted to test the differences in PI measures between single vs dual-VENC and between 3T and 7T.Results & Discussion
LSA structures were successfully depicted on 3T TOF MRI. 3T LSA (Figure 1a) showed comparable morphological features (number of LSAs, length, and tortuosity) compared to that of 7T (Figure 1b), although the background of LSA on 3T TOF images looked slightly noisier. The velocity waveforms of LSAs across a cardiac cycle were successfully detected using PC-MRI from all subjects on both 3T and 7T. Figure 1(b-d) shows the detected perforators and average velocity waveforms from a representative subject. Figure 2 shows the Bland-Altman plots of PI values measured with a single VENC and dual VENC. Both single-VENC and dual-VENC showed good test-retest reproducibility. However, dual VENC showed overall better test-retest reproducibility with reduced bias and variations between the test-retest measurements. There was no significant difference in PI measurement between single VENC and dual-VENC (p = 0.25). Figures 3a and b show the case-by-case comparison of the PI values and number of detected perforators (Nperforator) measured with dual-VENC at 3T and 7T, respectively. There was no significant difference in PI (0.46+/-0.08 vs. 0.50+/-0.06, p = 0.25) and Nperforator (22.4+/-5.0, 22.7+/-6.4, p = 0.85) between 3T and 7T indicating that the LSA characterization using 3T PC-MRI with dual-VENC is comparable to that at 7T.Conclusion
This study has demonstrated the feasibility of using 2D submillimeter-resolution PC-MRI to characterize the LSA pulsatility at 3T. PC-MRI with dual-VENC shows better reproducibility of LSA PI measurements compared to the conventional PC-MRI with a single VENC. The LSA PI measurements as well as the sensitivity of LSA detection at 3T are comparable to those at 7T. These promising results suggest that LSA can be reliably characterized using conventional 3T. As 3T scanners are in widespread use in both clinical and research studies, this study opens a new door to directly assessing the functions of subcortical small arteries at 3T which can be used as potential imaging markers for aging and small vessel disease.Acknowledgements
This work is supported by grants from NIH R01NS118019, RF1AG072490, and BrightFocus Foundation A20201411S.References
1. Djulejić V, Marinković S, Milić V, Georgievski B, Rašić M, Aksić M, Puškaš L. Common features of the cerebral perforating arteries and their clinical significance. Acta Neurochir (Wien). 2015 May;157(5):743-54; discussion 754. doi: 10.1007/s00701-015-2378-8. Epub 2015 Mar 14. PMID: 25772345.
2. Hakim AM. Front Neurol. 2019;10:1020. Kargiotis O. J Neurosonol Neuroimag. 2018;10(2):80-94.
3. Bouvy WH, Geurts LJ, Kuijf HJ, et al. Assessment of blood flow velocity and pulsatility in cerebral perforating arteries with 7-T quantitative flow MRI. NMR Biomed. 2016;29(9):1295-1304. doi:10.1002/nbm.3306
4. Arts T, Meijs TA, Grotenhuis H, Voskuil M, Siero J, Biessels GJ, Zwanenburg J. Velocity and Pulsatility Measures in the Perforating Arteries of the Basal Ganglia at 3T MRI in Reference to 7T MRI. Front. Neurosci., 26 April 2021Figures
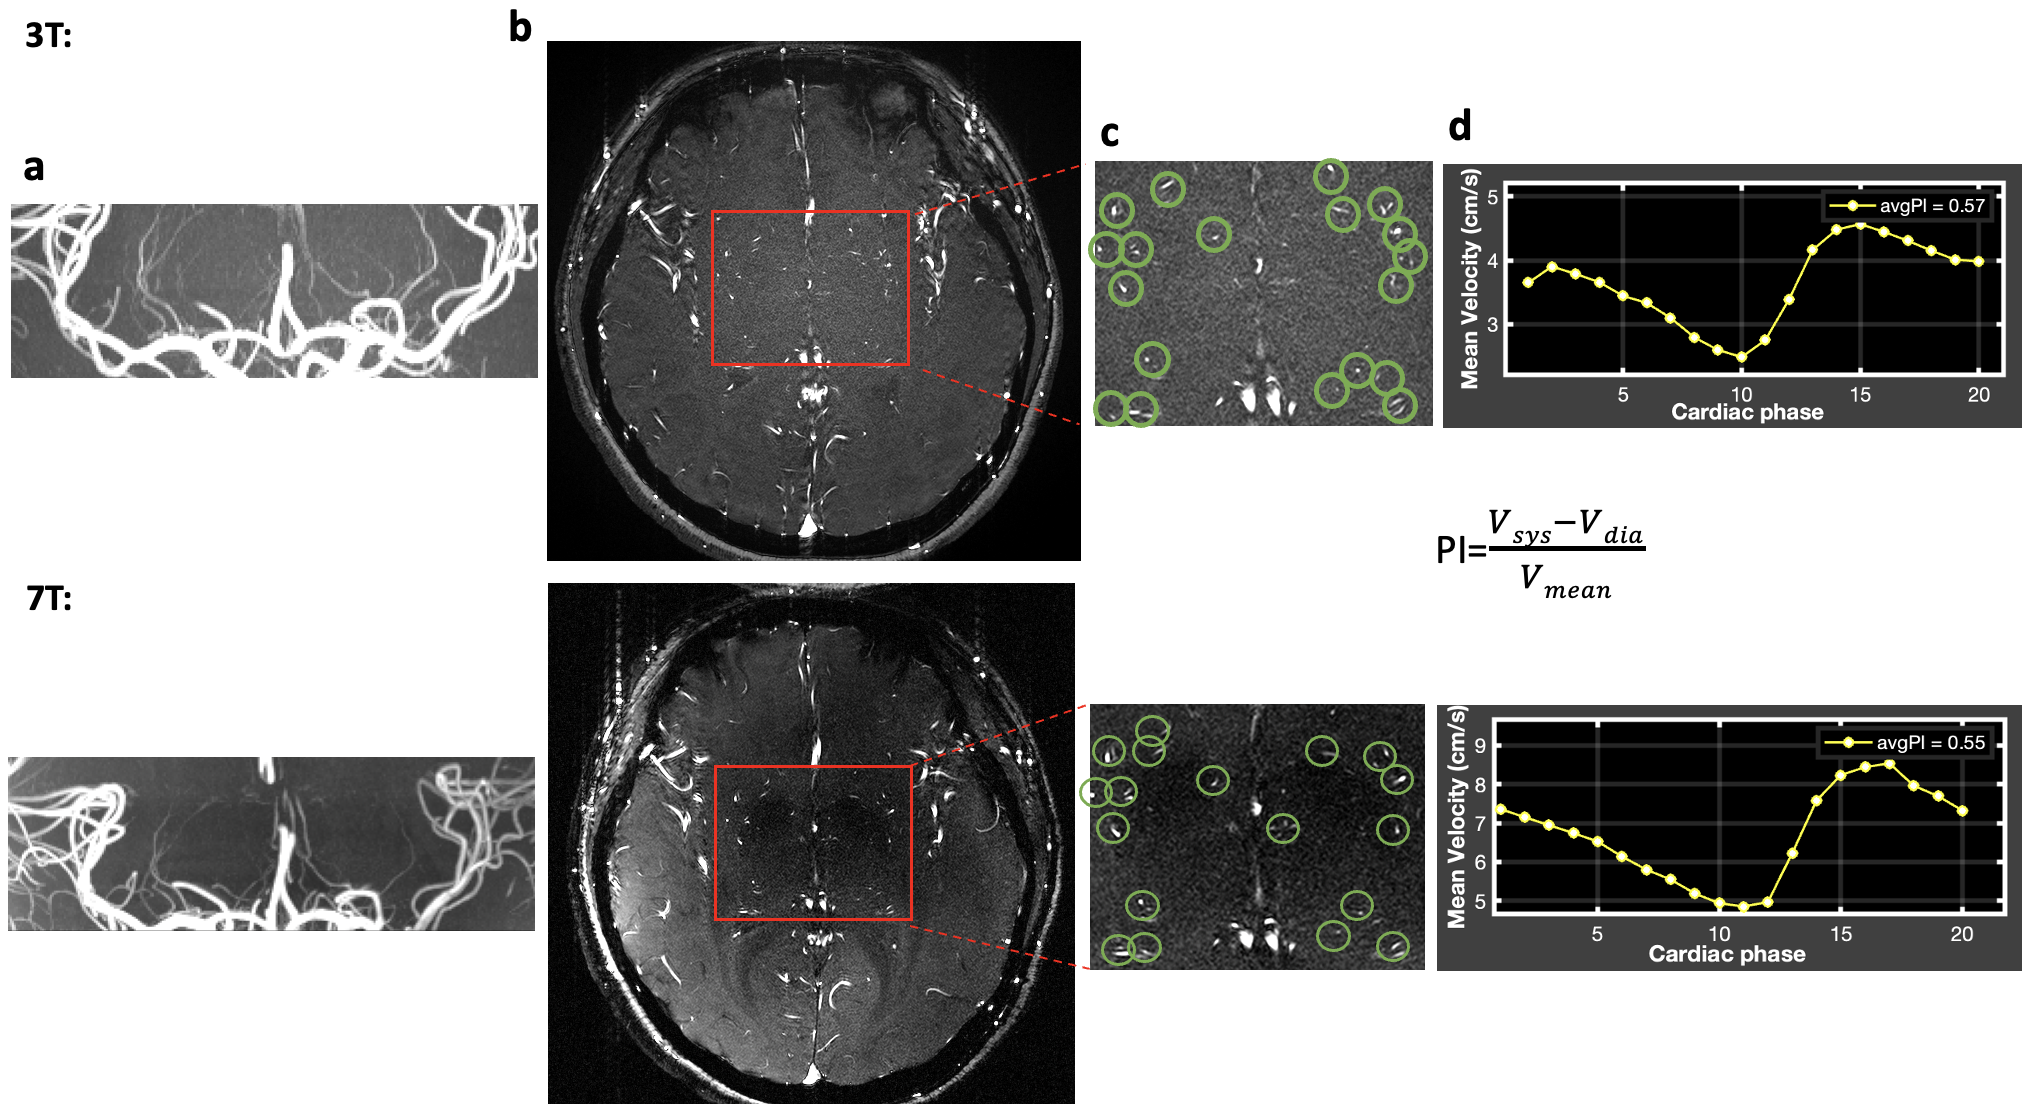
Figure 1. A representative case for the characterization of LSAs at both 3T (top) and 7T (bottom). a. TOF MIP image. b. PC-MRI structure image. Red box indicates the region of interest. c. Zoom in view of ROI. Green circles mark the LSAs detected. d. The corresponding average velocity curve of LSAs.
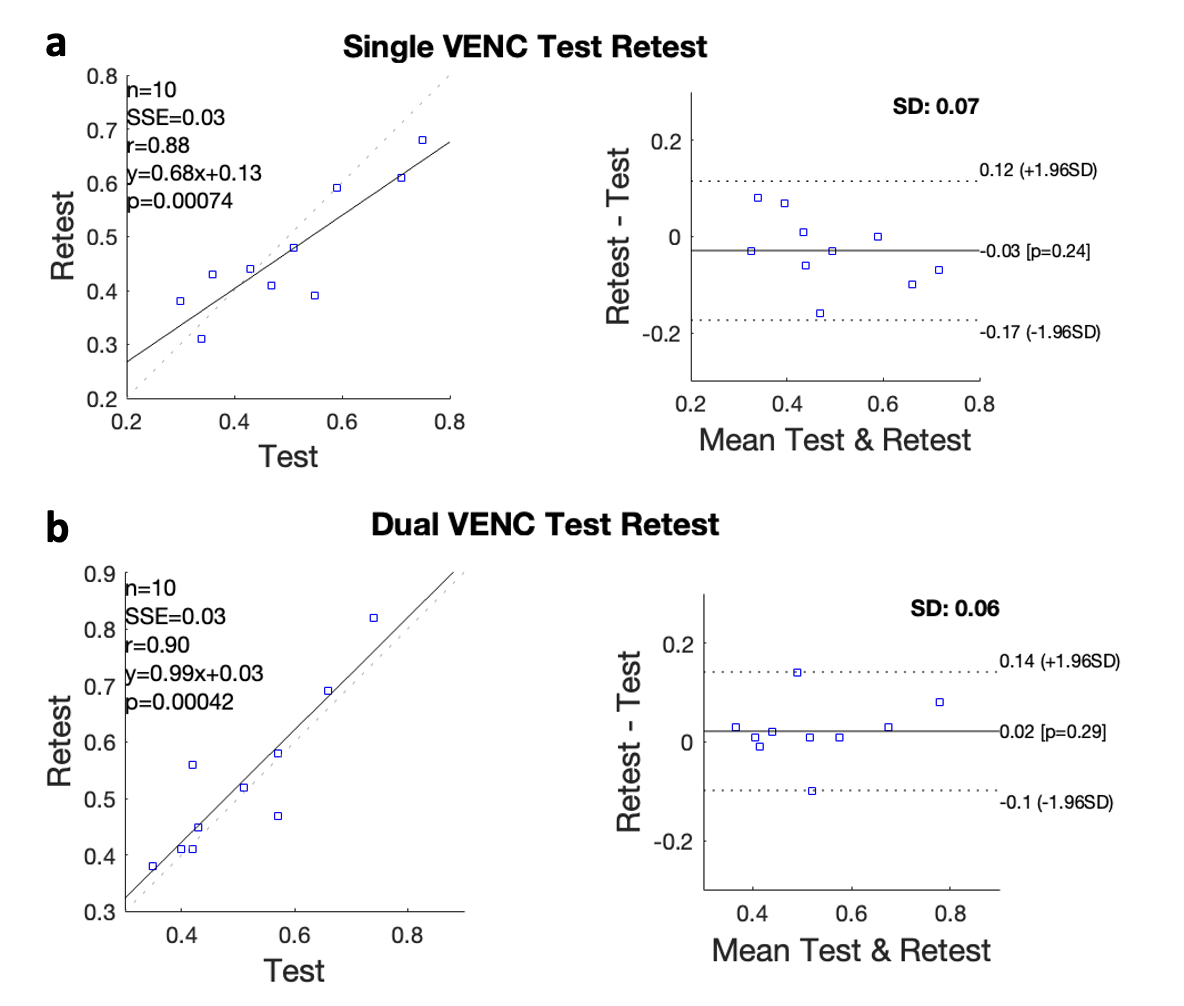
Figure 2. Bland-Altman plots of the test-retest PI measurements using PC-MRI with a single VENC (a) and dual-VENC (b) at 3T
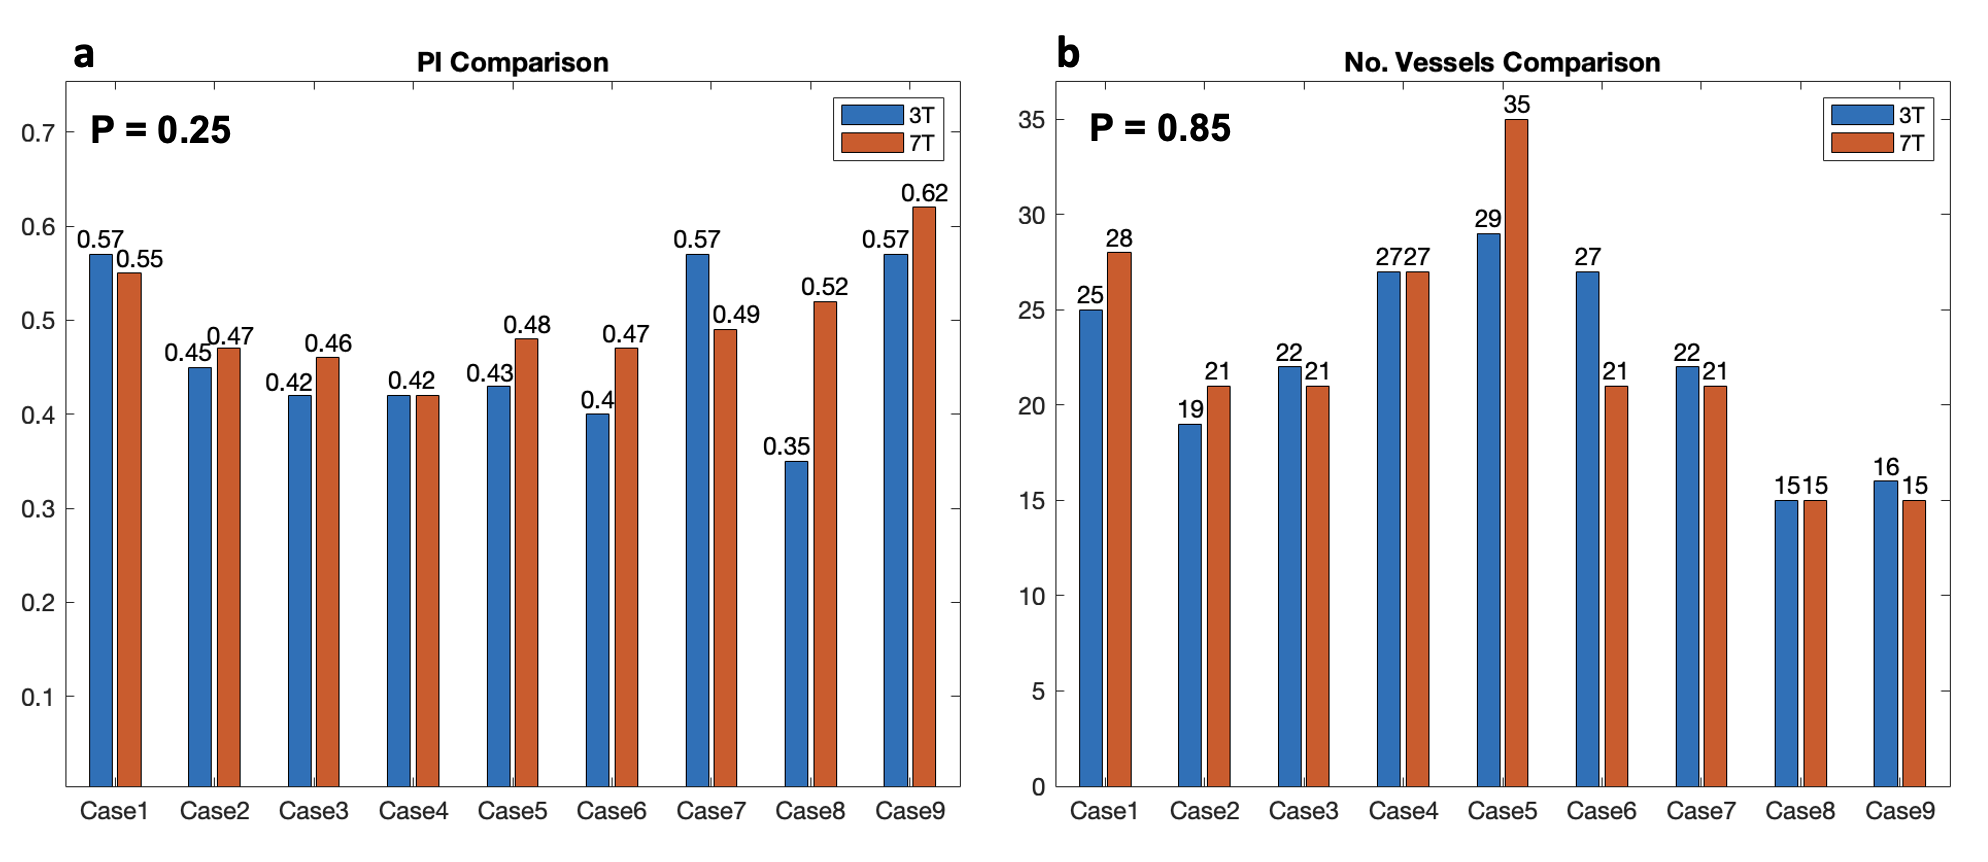
Figure 3. Case-by-case comparison of PI measurements and the number of detected perforators between 3T and 7T
DOI: https://doi.org/10.58530/2023/2487