2485
Cerebrovascular reactivity differences in the anterior and posterior brain circulations in Healthy individuals1Department of Physiology, University of Toronto, Toronto, ON, Canada, 2Joint Department of Medical Imaging and the Functional Neuroimaging Lab, University Health Network, Toronto, ON, Canada, 3Department of Anaesthesiology and Pain Management, University Health Network, Toronto, ON, Canada
Synopsis
Keywords: Blood vessels, fMRI (task based), Cerebrovascular Reactivity
There is no consensus regarding the differences in Cerebrovascular Reactivity (CVR) magnitude differences between anterior and posterior circulations in healthy individuals. Forty-four healthy individuals underwent BOLD fMRI using a standardized blood vascular stress test achieved with sequential gas delivery. These results showed that cerebrovascular magnitude and speed of response tau) were stronger and faster in the posterior circulation compared to anterior circulation tissues. Therefore, the knowledge that there are significant regional differences in CVR is critical for investigating the regional impact of cerebrovascular pathologies.
INTRODUCTION:
Several studies have focused on measuring regional Cerebrovascular Reactivity (CVR) differences between healthy and diseased groups1,2. However, there is a lack of consensus regarding regional differences in the anterior and posterior circulations in the healthy human brain. Perko et al. (2011) compared anterior (i.e. Middle Cerebral Artery (MCA)) and posterior (i.e. Posterior Cerebral Artery (PCA)) CVR using L-arginine, a nitrous oxide precursor as a vasodilatory stimulus. They concluded that CVR was significantly higher in the PCA than the MCA and was more pronounced in females compared to males3. Conversely, Skow et al. (2013) measured CVR in the anterior and posterior circulation using the Duffin Rebreathing method finding that MCA reactivity was greater than PCA reactivity4. Bruce et al. (2016) using a breath-hold maneuver in 23 healthy participants, found that MCA CVR was 70% greater than PCA CVR during5. The conflicting results may have been influenced by the unknown blood levels of the vasodilatory stimuli applied. To address the conflicting results, we implemented a vasodilatory stimulus validated against arterial blood sampling while using fMRI6.METHODS:
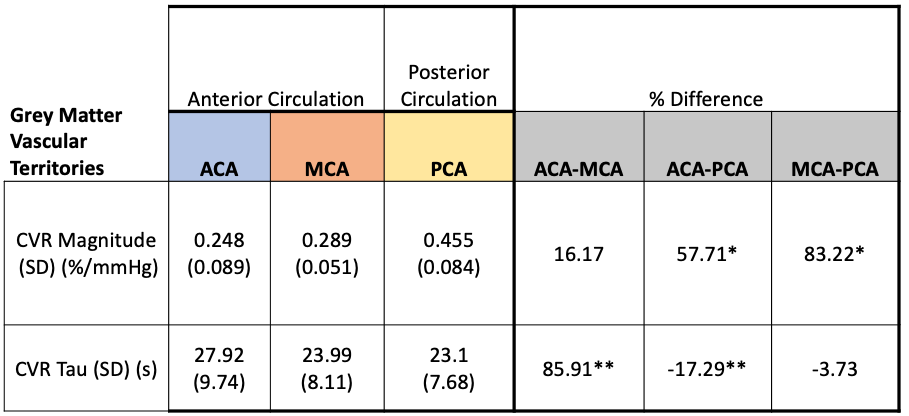
Forty-four healthy volunteers (17F, age 18-76 years) were imaged on a 3T MR scanner during carbon dioxide manipulation. BOLD images were acquired with the following parameters: TR/TE = 2400/30 ms, flip angle = 70 degrees, 41 slices, 3.5 mm isotropic voxels, matrix 64x64. BOLD images were volume registered, slice-time corrected, and co-registered to the anatomical T1-scan. The standardized stimulus consisted of a standardized single-step increase in end-tidal carbon dioxide relative to the volunteer’s premeasured baseline using a computer-controlled gas blender with sequential gas delivery (RespirAct™, Thornhill Medical, Toronto, Canada)7. Vascular territories were previously delineated from a Montreal Neurological Institute anatomical template1. The magnitude and speed of the CVR response were measured as the BOLD signal change per mmHg. In addition, the speed of the response was modelled as an exponential rise in the BOLD signal with the time constant tau (Poublanc et al. (2021), see Figure 1)8. These metrics were calculated in the gray matter in the anterior cerebral artery (ACA), middle cerebral artery (MCA), and posterior cerebral artery (PCA) territories, as well as the whole brain white matter (WM-WB). Differences in the CVR magnitude and tau measures between territories were analyzed with a repeated measures ANOVA provided that the data passed the Shapiro-Wilk test for normality; otherwise, a Friedman Repeated Measures Analysis of Variance on Ranks was used. Regional differences were considered significant for CVR magnitude and tau values when p ≤ 0.05.RESULTS:
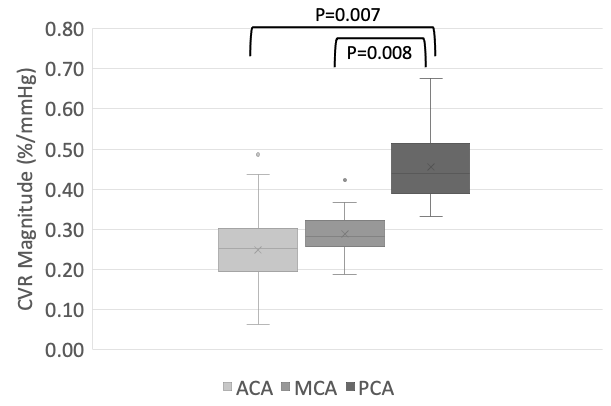
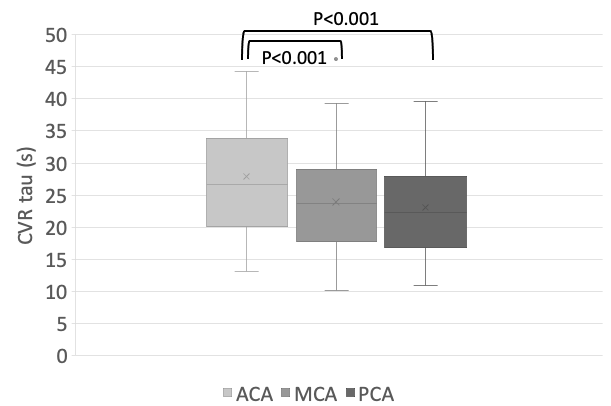
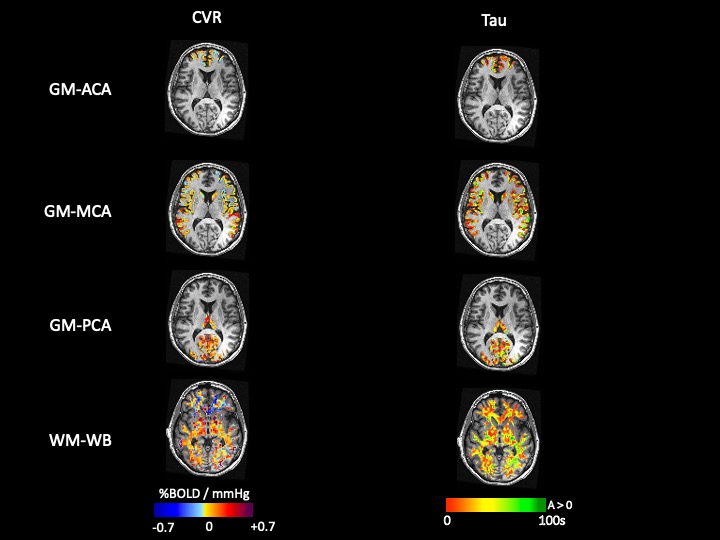
Numerical results are presented in Figures 2-4, and one participant’s CVR magnitude and mean tau maps are illustrated in Figure 5. In general, CVR magnitude and speed of response (tau) were stronger and faster, respectively, in the posterior circulation compared to the anterior circulation.DISCUSSION:
The results of this study disagree with previous publications, which were limited by the use of vasoactive stimuli with no validated arterial concentrations indicating that the results are more correlated with the applied methodologies rather than the physiology. The main strength of our study design was the application of a sequential gas delivery method to produce quantitative vasoactive stimuli where the blood concentrations of the stimuli are known to have been validated against arterial blood gas sampling 6. Also, the BOLD-sequence enabled whole brain temporal resolution at 2.4 seconds, sufficient to measure the speed of response time constant tau) metric. However, a limitation of our method is the use of the relative BOLD signal itself, which has a non-linear relationship with cerebral blood flow. Response speed is an additional metric for assessing the impact of vascular pathologies such as that seen in Alzheimer’s or Sickle Cell disease 2,9. Although a quantitative stimulus is not necessary for conducting effective research in CVR, having such a stimulus provides two advantages. A quantitative stimulus can reduce the sample size of a population needed to observe a statistically significant effect, and it has greater reproducibility, thus improving result validity. Therefore, replacing the BOLD sequence with a sequence with similar anatomical coverage and temporal resolution sensitive only to blood flow changes would be welcomed. Current variants of ASL, including multi-echo and FAIR methodology, are begining to show promise in this regard. Finally, the etiology for the CVR differences between the anterior versus the posterior circulations is unknown. They may represent differences in the responsiveness of cerebral blood flow regulation that developed as the neocortex evolved in primates favouring the preservation of critical tissues such as the brainstem and visual cortex.CONCLUSION:
In this study, we established population-based normative CVR magnitude and tau values in healthy individuals demonstrating significant differences between the two major circulations in the human brain. Therefore, future investigations into cerebrovascular health should consider regional differences when investigating the vascular pathology has on CVR.Acknowledgements
The authors thank the MR technologists at Toronto Western Hospital and Vepeson Wijeya for experimental setup and troubleshooting. This work was supported by the Holt-Hornsby and Andreae Vascular Dementia Research Unit in the Joint Department of Medical Imaging at the Toronto Western Hospital and the University Health Network.
References
1. Sayin ES, Sobczyk O, Poublanc J, et al. Assessment of cerebrovascular function in patients with sickle cell disease using transfer function analysis. Physiological Reports 2022; 10
2. Forté S, Sobczyk O, Poublanc J, et al. Sickle cell cerebrovascular reactivity to a CO2 stimulus: Too little, too slow. Frontiers in Physiology 2022; 13
3. Perko D, Pretnar-Oblak J, Šabovič M, Žvan B, Zaletel M. Differences between Cerebrovascular Reactivity to L-Arginine in the Anterior and Posterior Cerebral Circulation. Cerebrovasc Dis 2011; 31:358–364.
4. Skow RJ, MacKay CM, Tymko MM, et al. Differential cerebrovascular CO2 reactivity in anterior and posterior cerebral circulations. Respiratory Physiology & Neurobiology 2013; 189:76–86.
5. Bruce CD, Steinback CD, Chauhan UV, et al. Quantifying cerebrovascular reactivity in anterior and posterior cerebral circulations during voluntary breath holding. Experimental Physiology 2016; 101:1517–1527.
6. Ito S, Mardimae A, Han J, et al. Non-invasive prospective targeting of arterial PCO2 in subjects at rest. J Physiol 2008; 586:3675–3682.
7. Fierstra J, Sobczyk O, Battisti-Charbonney A, et al. Measuring cerebrovascular reactivity: what stimulus to use? The Journal of Physiology 2013; 591:5809–5821.
8. Poublanc J, Shafi R, Sobczyk O, et al. Normal BOLD Response to a Step CO2 Stimulus After Correction for Partial Volume Averaging. Front Physiol 2021; 12:639360.
9. Holmes KR, Tang-Wai D, Sam K, et al. Slowed Temporal and Parietal Cerebrovascular Response in Patients with Alzheimer’s Disease. Can J Neurol Sci 2020; 47:366–373.
Figures
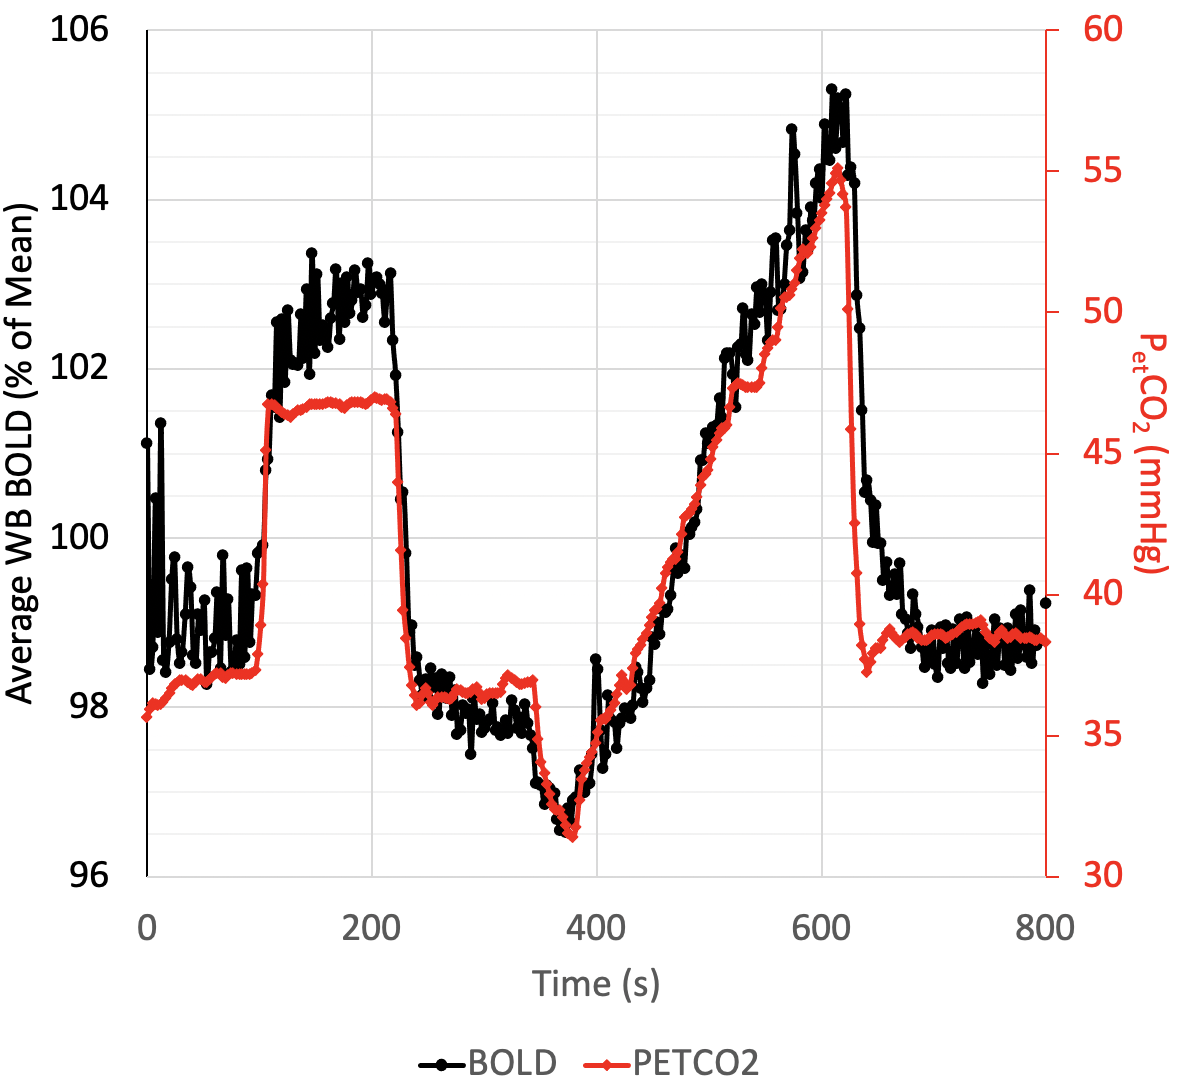
A standard cerebrovascular breathing paradigm represented by PETCO2 sequence from a volunteer. The carbon dioxide stimulus (red line) and the average Whole Brain (WB) BOLD response (black line) are displayed. CVR and tau are calculated from the step change in the breathing paradigm.