2484
Imaging of Lenticulostriate Arteries and Pontine Arteries using 5.0-Tesla Magnetic Resonance Angiography1Shenzhen Institute of Advanced Technology, Chinese Academy of Sciences, Shenzhen, China, 2Department of Radiology, Beijing University Shenzhen Hospital, Shenzhen, China
Synopsis
Keywords: Blood vessels, Blood vessels, ultra-high field, MRA
Small arteries and arterioles, particularly the lenticulostriate arteries (LSAs) and pontine arteries (PAs) are known to be involved in small vessel disease, which contribute to progressive cognitive impairment in elderly persons. In this study, ultra-high field (5T) TOF-MRA was optimized and performed to visualize the LSAs and PAs. Our results show that 0.4mm3 is the optimal resolution for the visualization of LSAs and PAs.Introduction
Small arteries and arterioles, particularly the lenticulostriate arteries (LSAs) and pontine arteries (PAs) are known to be involved in small vessel disease, which contribute to progressive cognitive impairment in elderly persons (1). LSA and PA imaging is challenging due to the small size of perforating arteries (0.08-1.4mm) (2). Ultra-high field (7T) TOF-MRA was proved to be an efficient method of imaging LSA (3,4). Recently, a 5.0 T whole body MRI scanner was developed, providing another choice for visualizing the perforating arteries (5,6). Theoretically, the use of increased magnetic field (5.0 T and 7.0 T) provides images with higher SNR and CNR, which allowed higher resolution for improved imaging of the near microvasculature. Furthermore, the ultra-high field has longer T1 relaxation time of tissues, which has better suppression of the background signal and superior blood-to-tissue contrast. The aim of this study was to explore the feasibility of 5T TOF MRA for visualizing intracranial small branch arteries by optimizing the imaging sequence, and compare the images with 3T imagings.Materials and methods
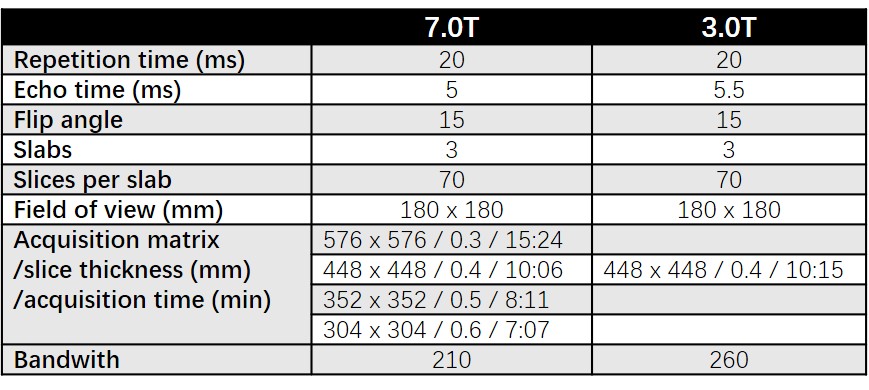
Four healthy subjects (1 males and 3 females), ranging from 24 to 25 years old (mean age = 24.5), were enrolled in this study. We obtained written informed consent from all subjects. The experiments were approved by the institutional review board (IRB). MRA images were obtained with 5.0 T MRI (uMR Jupiter, United Imaging Healthcare) with two-channel transmit and 48-channel receiver head coil and 3.0T MRI scanner (uMR 790, United Imaging Healthcare) with a 32-channel receiver head coil. The multi-slab fast low-angle shot (FLASH) gradient-echo sequence was used for TOF MRA scan collection. Three imaging slabs were acquired with 70 slices per slab (slab overlap, 25%; slab oversampling, 20%) to cover the lenticulostriate artery from anterior circulation and pontine artery from posterior circulation. To ensure an objective comparison and assessment, most of the acquisition parameters were kept consistent across the 5T and 3T acquisitions (table 1). We tested several different resolution settings (0.3-0.6mm3) at 5T and calculated the number of stems and branches to find the optimized resolution for LSAs and PAs visualization (4). On the 3T system, the TOF imaging was only acquired with the optimized resolution. In this experiment, the reference voltage and the SAR of the head coil were 80 to 110 V and 1.8 to 2.5 W/kg.Results
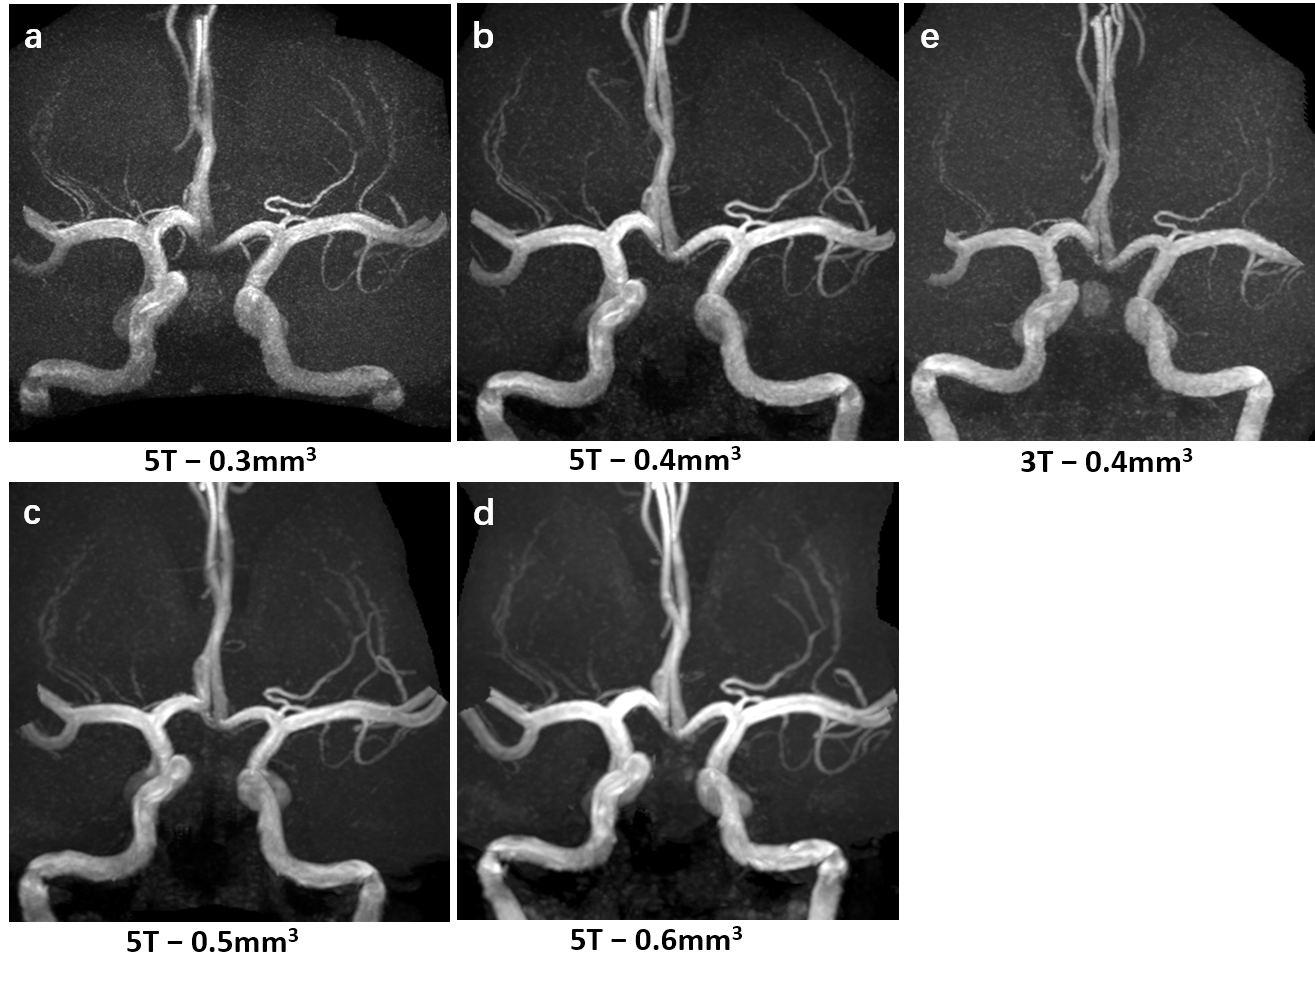
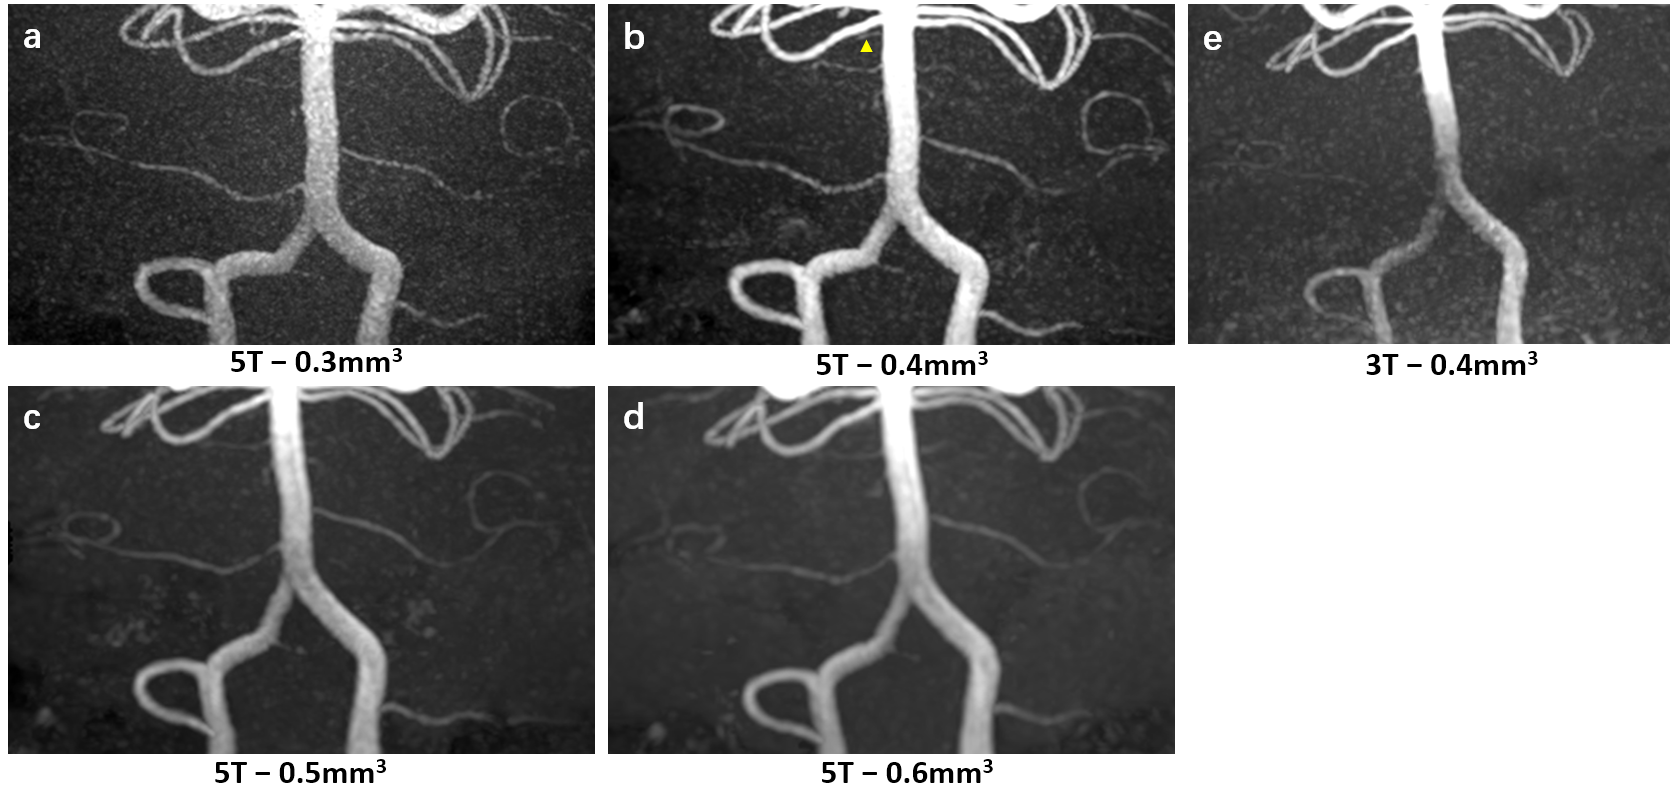
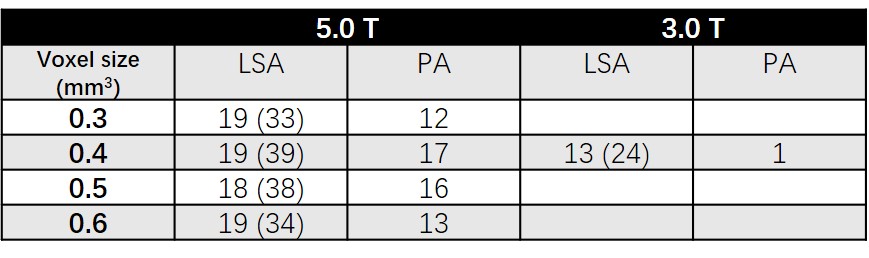
The MIP views of LSAs in Fig. 1 demonstrated the superior visualization of LSAs at the resolution of 0.4mm. The branches appeared blurred in the low-resolution images (0.5mm and 0.6mm) due to the partial volume effect. In the high-resolution images (0.3mm), the images became noisier and the distal branches of LSAs appeared faint due to the low SNR. Fig. 2 compared the MIP views of PAs at four different resolutions (0.3mm, 0.4mm, 0.5mm, 0.6mm) on 5.0T and 0.4mm resolution on 3.0T from another healthy subject. The thin pontine artery near the right superior cerebellar artery (pointed by the arrowhead) was only visualized at the resolution of 0.4mm. The number of stems and branches at four different resolutions were calculated and summarized in table 2, more stems and branches could be identified at the resolution of 0.4mm, especially for PAs.Discussion
In this work, we optimized the TOF-MRA sequence at 5.0T and found the optimized resolution to visualize the LSAs and PAs. More perforating arteries and branches were visualized at the resolution of 0.4mm3. We further compared the performance of 5.0T TOF MRA to those of 3.0T MRI with the optimized resolution, the numbers of stems and branches on 5T were significantly higher compared with those on 3T, especially for PA arteries. Our preliminary results suggest that ultra-high-resolution TOF-MRA imaging using 5.0T MRI is capable of depicting small vessel branches (e.g. LSAs and PAs) and has the potential as a non-invasive imaging tool to study microvascular disease.Acknowledgements
NoneReferences
1. Greenberg SM. Small vessels, big problems. N Engl J Med 2006; 354:1451–1453.
2. Marinkovic S, Gibo H, Milisavljevic M, Cetkovic M. Anatomic and clinical correlations of the lenticulostriate arteries. Clin. Anat. 2001;14:190-5.
3. Cho ZH, Kang CK, Han JY, et al. Observation of the lenticulostriate arteries in the human brain in vivo using 7.0 T MR angiography. Stroke 2008;39 (5):1604–6
4. Kang CK, Park CW, Han JY, Kim SH, Park CA, Kim KN, et al. Imaging and analysis of lenticulostriate arteries using 7.0- Tesla magnetic resonance angiography. Magn Reson Med 2009;61(1):136–44.
5. Zhang Y, Yang C, Liang L, et al. Preliminary Experience of 5.0T Higher Field Abdominal Diffusion-Weighted MRI: Agreement of Apparent Diffusion Coefficient With 3.0T Imaging. J Magn Reson Imaging 2022;56:1009
6. Shi Z, Zhao XY, Zhu S, et al., Time-of-Flight Intracranial MRA at 3 T versus 5 T versus 7 T: Visualization of Distal Small Cerebral Arteries. Radiology 2022. doi: 10.1148/radiol.220114. Online ahead of print
Figures