2483
Visualization of Lenticulostriate Arteries on High-Resolution Magnetic Resonance Imaging and Digital Subtraction Angiography1The First Hospital of Jilin University Department of Radiology, Changchun, China, 2The First Hospital of Jilin University Department of Radiology, Chanchun, China, 3MR Scientific Marketing, Siemens Healthineers, Beijing, China, Beijing, China, 4Siemens Healthineers Digital Technology (Shanghai) Co., Ltd., Shanghai, China
Synopsis
Keywords: Blood vessels, Vessels
Morphological characteristics of lenticulostriate arteries (LSAs) have important clinical significance. TOF MRA and intracranial vessel wall imaging (VWI) are powerful noninvasive vascular imaging techniques routinely used in vascular visualization. However, due to the small caliber of LSAs, it is difficult for conventional 3T TOF MRA to achieve the visualization of LSAs. High-resolution magnetic resonance imaging based on compressed sensing (CS) technology is expected to solve this dilemma. DSA is the gold standard for vascular visualization. This study proposes an optimized high-resolution TOF MRA scanning scheme based on CS technology and shows its feasibility in LSA visualization by comparing with DSA.Introduction
Hypertension and atheromatous disease have been proved to damage lenticulostriate arteries (LSAs) and cause morphological changes of LSAs [1, 2]. The LSA bright blood visualization with TOF MRA was initially realized at ultra-high-field 7T with superior spatial resolution and vessel to tissue contrast[3, 4]. However, the availability of 7T systems in clinical settings is very limited[5]. At clinical field strength, study have shown that 3T vessel wall imaging (VWI) is capable of depicting LSAs, with comparable image quality to that of 7T TOF-MRA[6]. Conventional 3T TOF MRA techniques is difficult to accurately visualize LSAs[5], because of its limited resolution within clinical acceptable scanning time. Compressed sensing (CS) technology enables accelerated MRI by nonlinear iterative reconstruction of sparsely under-sampled k-space data. CS has been used to accelerate TOF MRA for artery visulization. DSA is considered as the gold standard for intracranial large vascular visualization[7].Therefore, this study proposes an optimized high-resolution TOF MRA scanning scheme based on CS acceleration technology and shows the feasibility of 3T high-resolution TOF MRA and VWI sequences in LSA visualization compared with DSA.Methods
Two patients who underwent DSA were examined on a 3T MR scanner (Siemens Healthcare, Erlangen, Germany). The protocol consisted of 3D high-resolution TOF MRA and 3D T1 SPACE sequences. Imaging Parameters are shown in Table 1. TOF MRA and SPACE images were reconstructed by volume rendering (VR), maximum intensity projection (MIP) or minimum intensity projection (MinIP). The number of LSA stems and branches was counted by two experienced radiologists. Stems were defined as the portion of the LSA that originated directly from the MCA or ACA and branches are defined as daughter vessels originating from parent LSA stems. The maximal length was measured on the longest LSA in reformatted coronal image, which was the curved length from MCA to the visible end.Results
The results of this study demonstrate the potential of 3T high-resolution TOF MRA and T1 SPACE in LSA visualization. The maximal length of LSA, the number of LSA stems and branches were recorded. VR, MIP and MinIP images are used to visualize LSAs.Patient 1
A 53 years old female with a history of left middle cerebral artery bifurcation aneurysm embolization one year ago. High-resolution TOF MRA and T1 SPACE at 3T presented LSAs on VR, coronal MIP or MinIP images (Fig.1). The number of LSA stems in left/right cerebral hemisphere on MRA and T1 SPACE is 3/1 and 3/2, respectively. The number of LSA branches in left/right cerebral hemisphere on MRA and T1 SPACE is 5/5 and 4/6, respectively (Fig.1A-D). The maximal length of LSA in left/right cerebral hemisphere on MRA and T1 SPACE is 48.4/58.0mm and 47.3/49.3mm, respectively (Fig.1G-H). The initial segment of LSAs travelled naturally with better visualization effect on TOF MRA than T1 SPACE, while the reverse is true for the distal segment. Due to the influence of complete visualization of small intracranial arteries, it is difficult for DSA to recognize LSAs in left cerebral hemisphere (Fig.1E-F).
Patient 2
A 59 years old female with a history of anterior communicating aneurysm embolization one year ago. The number of LSA stems in right/left cerebral hemisphere on MRA and T1 SPACE is 3/2 and 4/3, respectively. The number of LSA branches in right/left cerebral hemisphere on MRA and T1 SPACE is 5/4 and 6/5, respectively (Fig.2A-D). The maximal length of LSA in right/left cerebral hemisphere on MRA and T1 SPACE is 47.2/37.7mm and 45,1/43.3mm, respectively (Fig.2G-H). T1 SPACE have shown more LSAs with smaller caliber than TOF MRA, but the assessment is more difficult than MRA. The visualization effect of DSA to recognize LSAs is poor (Fig.2E-F).
Discussion
Morphological characteristics of LSAs have important clinical significance and prognostic value. Ultra-high field-strength MR (5 T and 7 T) have shown the capability to visualize LSAs, however, it is still not easy to be implemented in routine clinical examinations[5]. This study has demonstrated that high-resolution TOF MRA based on CS technology at 3T is capable of depicting LSAs within 9 minutes. High-resolution TOF MRA and T1 SPACE demonstrated greater potential in visualization of the initial segment of LSAs than DSA.3T T1 SPACE is capable of depicting LSAs and assess LSAs impairments[1, 6]. However, LSA evaluation is time-consuming and instability, because of its tortuous travelling and morphologic variations[8]. These drawbacks will bring more challenges to clinical implementation. Quantitative assessment of LSAs is easier to implement on TOF MRA than T1 SPACE. Automated processing pipeline for quantifying LSA on TOF MRA has been proposed[5, 8]. The application of VR image, combined with MIP image, is more beneficial to evaluate the morphologic variations of LSAs,which is consistent with this study.
Conclusions
High-resolution TOF MRA based on CS technology is capable of depicting LSAs. 3T high-resolution TOF MRA and T1 SPACE sequences show better visualization effects than DSA and provide a potential alternative imaging method of LSAs.Table1
Table 1 Imaging Parameters of TOF MRA andT1 SPACE| CS TOF MRA | T1 SPACE | |
| Scan time | 7:47 | 8:58 |
| Voxle size | iso 0.3mm | iso 0.3mm |
| FOV | 170mm | 172mm |
| Matrix | 348x352 | 320x320 |
| Acceleration factor | Cs=3.8 | Grappa =2 |
| TR | 37.96ms | 800ms |
| TE | 6.15ms | 20ms |
| Acquisition orientation | transversal | sagittal |
| Flip angle (degrees) | 20 | N/A |
Acknowledgements
We are grateful to Shuo Wang of the First Hospital of Jilin University for helping with data transmission.
References
1. Jiang S, Cui JY, Yan YY, Yang T, Tao WD, Wu B. Association of compromised cerebral perfusion with lenticulostriate artery impairments in the subacute phase of branch atheromatous disease. Ther Adv Neurol Disord 2022; 15:17562864221109746
2. Zhang J, Bai Q, Zhao Z, Mao Y, Dong Q, Cao W. MRI-guided thrombolysis for lenticulostriate artery stroke within 12 h of symptom onset. Sci Rep 2022; 12:7445
3. Cho ZH, Kang CK, Han JY, et al. Observation of the lenticulostriate arteries in the human brain in vivo using 7.0T MR angiography. Stroke 2008; 39:1604-1606
4. Kang CK, Park CW, Han JY, et al. Imaging and analysis of lenticulostriate arteries using 7.0-Tesla magnetic resonance angiography. Magn Reson Med 2009; 61:136-144
5. Shi Z, Zhao X, Zhu S, et al. Time-of-Flight Intracranial MRA at 3 T versus 5 T versus 7 T: Visualization of Distal Small Cerebral Arteries. Radiology 2022:220114
6. Zhang Z, Fan Z, Kong Q, et al. Visualization of the lenticulostriate arteries at 3T using black-blood T1-weighted intracranial vessel wall imaging: comparison with 7T TOF-MRA. Eur Radiol 2019; 29:1452-1459
7. Wei N, Jing J, Zhuo Y, Zhang Z. Morphological characteristics of lenticulostriate arteries in a large age-span population: Results from 7T TOF-MRA. Front Neurol 2022; 13:944863
8. Wei N, Zhang X, An J, Zhuo Y, Zhang Z. A Processing Pipeline for Quantifying Lenticulostriate Artery Vascular Volume in Subcortical Nuclei. Front Neurol 2021; 12:700476
Figures
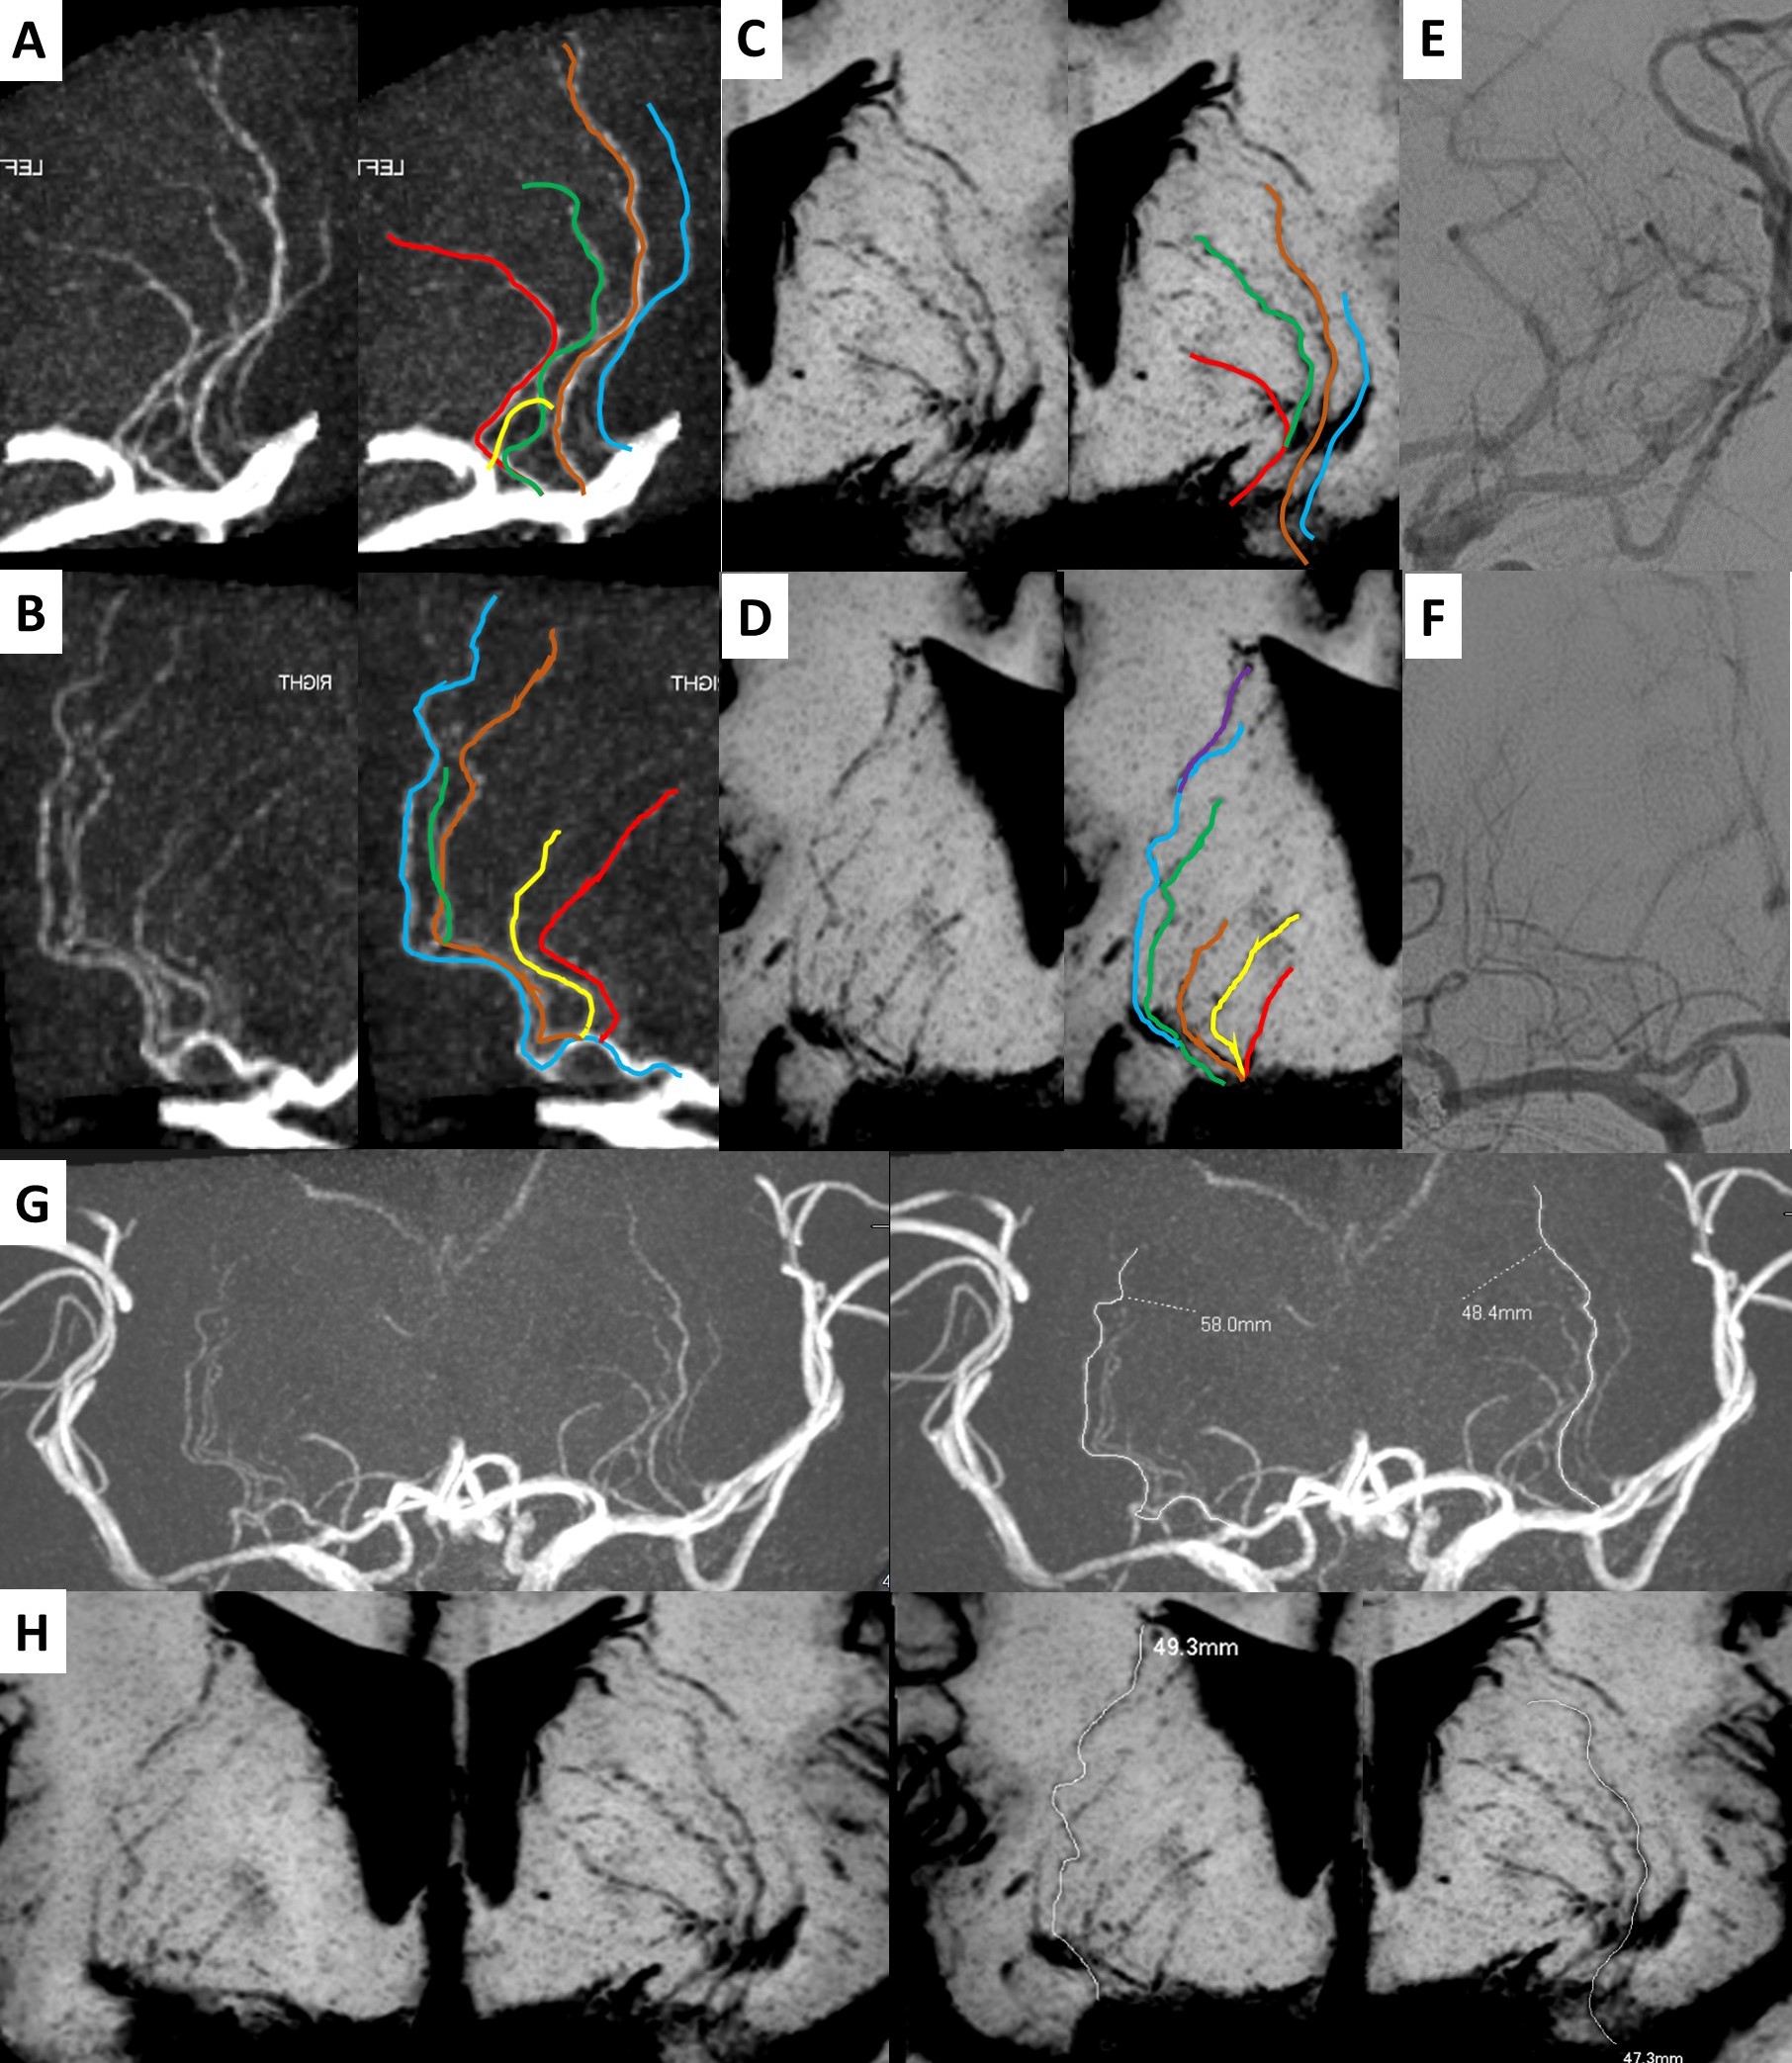
LSAs were manually delineated on VR of TOF MRA (A-B) and MinIP of T1 SPACE (C-D). The initial segment of LSA travelled naturally with clear edges on TOF MRA (A-B). The distal segment of LSA travelled naturally with clear edges on T1 SPACE (C-D). The maximal length was measured on the longest LSA On MIP of TOF MRA (G) and MinIP of VWI (H).
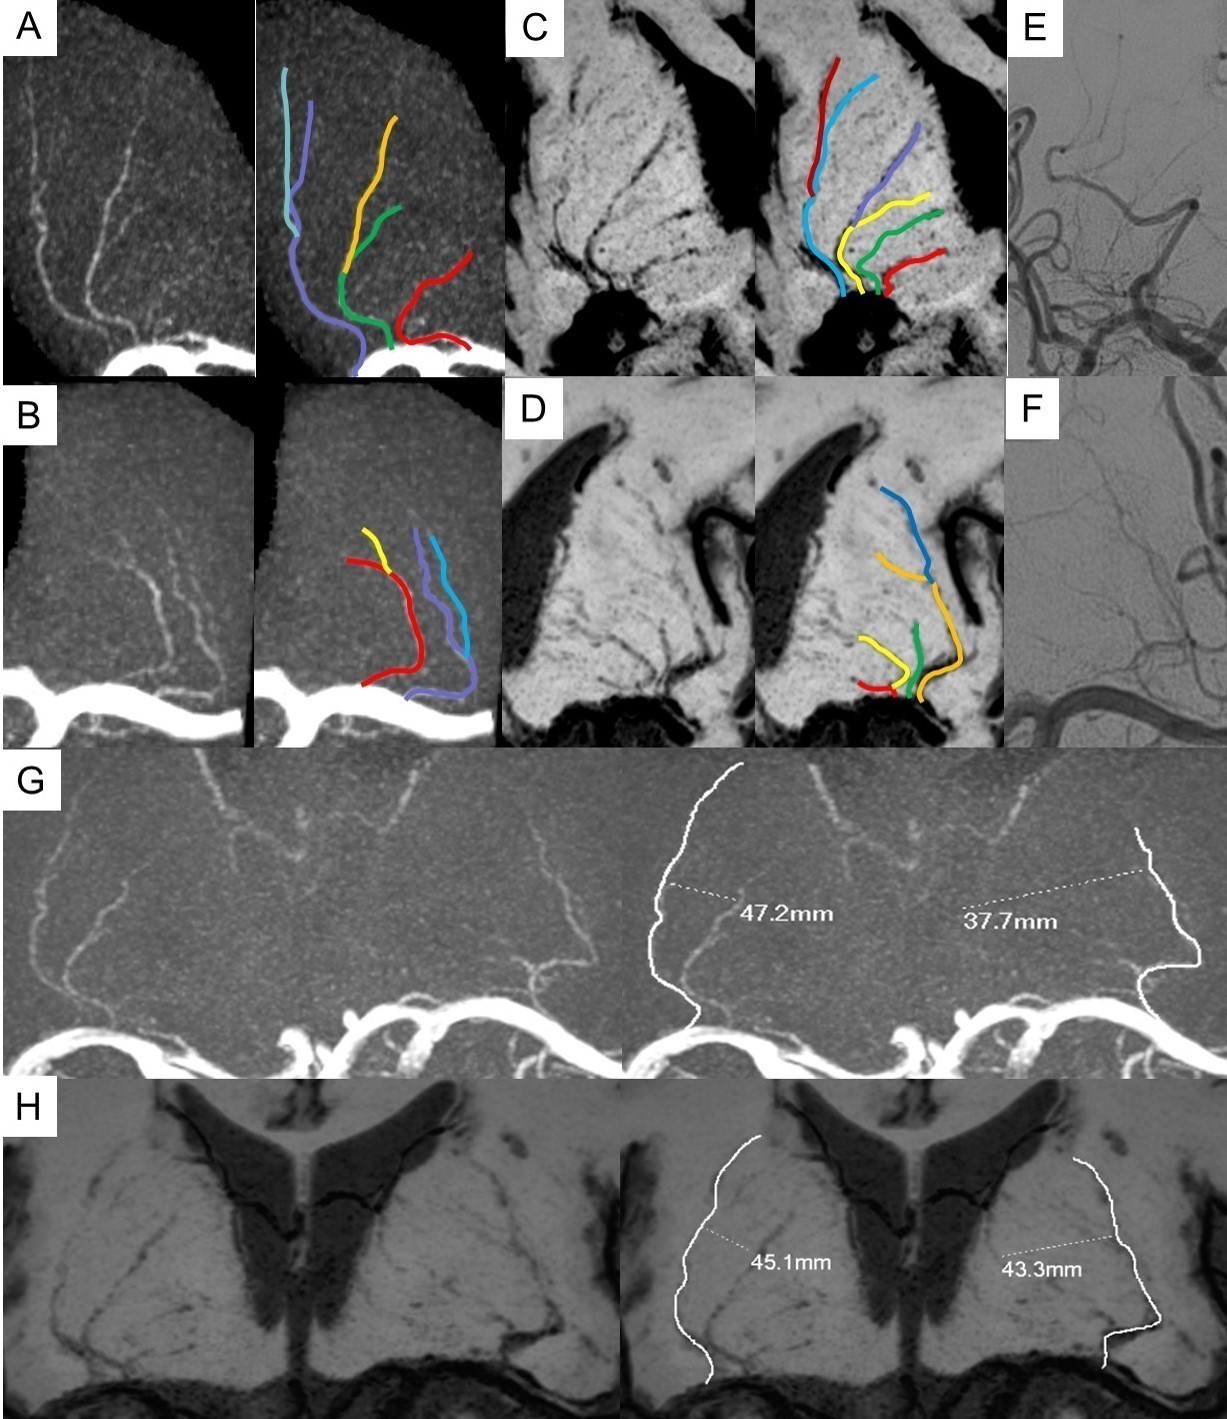
LSAs were manually delineated on VR of TOF MRA (A-B) and MinIP of T1 SPACE (C-D). T1 SPACE have shown more LSAs with smaller caliber than TOF MRA (C: green LSA, D: red and yellow LSA). The maximal length was measured on the longest LSA On MIP of TOF MRA (G) and MinIP of T1 SPACE (H).