2477
Increased pulsatility is associated with higher blood flow in the cerebral microvasculature as assessed with 7T MRI1Radiology & Nuclear Medicine, Maastricht University Medical Center +, Maastricht, Netherlands, 2School for Mental Health and Neuroscience, Maastricht University, Maastricht, Netherlands, 3Psychiatry & Neuropsychology, Maastricht University Medical Center +, Maastricht, Netherlands, 4Neurology, Maastricht University Medical Center +, Maastricht, Netherlands, 5School for Cardiovascular Diseases, Maastricht University, Maastricht, Netherlands, 6Internal Medicine, Maastricht University Medical Center +, Maastricht, Netherlands, 7Electrical Engineering, Eindhoven University of Technology, Eindhoven, Netherlands
Synopsis
Keywords: Blood vessels, Hypertension
We studied blood flow pulsatility and perfusion in the cerebral microvasculature to increase the understanding of the pathophysiological processes in hypertension. By exploiting the possibilities of ultra-high-field strength (7T), utilizing phase contrast MRI and spin-echo dynamic susceptibility MRI, we focused specifically on the microvasculature. We found that a higher blood flow pulsatility in the lenticulostriate arteries is correlated with higher cerebral blood flow. Furthermore, hypertension status seems to have an effect on varying pulsatility, which seems to be counteracted by medication usage.Introduction
Arterial stiffening occurs with aging and is accelerated by cardiovascular risk factors1. The decrease of arterial compliance results in altered autoregulation and is thereby also a risk factor for (cerebro)vascular diseases2. However, the precise underlying pathophysiological process, especially the interplay between arterial stiffness and cerebral blood flow (CBF) control3–5, remains unclear.With advanced MRI techniques, various aspects of cerebral hemodynamics can be measured. Phase contrast (PC) MRI can be used to quantify blood flow pulsatility6, and dynamic susceptibility contrast (DSC) MRI can be applied to quantify perfusion7,8.
Blood flow pulsatility has mostly been investigated in large arteries. However, the increased resolution at ultra-high-field strength (7T) makes it possible to perform quantitative measurements in the small lenticulostriate arteries (LSAs). Also, cerebral perfusion has mostly been investigated including the large cerebral vasculature using gradient-echo perfusion MRI. However, the increased sensitivity of ultra-high-field facilitates the use of spin-echo (SE) perfusion MRI, which is especially sensitive to small vessels and hence suited to measure microvascular perfusion9,10.
This study investigated the relation between blood flow pulsatility and cerebral perfusion derived with ultra-high-field PC-MRI and SE DSC-MRI at the microvascular level in a population with and without hypertension.
Methods
Subjects:Thirty-four elderly subjects with and without hypertension were included (Table 1). None of the subjects had neurological or neurovascular diseases.
MRI acquisition:
MR images (Table 2) were obtained using a 32-channel phased-array head coil at 7T (Siemens Healthineers, Erlangen, Germany). T1-weighted MP2RAGE and T2-weighted FLAIR sequences were acquired for anatomical reference. A Time-Of-Flight angiogram was acquired to conduct maximum intensity projections for the planning of the LSAs. Prospectively gated 2D PC-MRI data was acquired perpendicular to the middle cerebral arteries (MCAs) and LSAs. To measure cerebral perfusion, first a precontrast bolus was administered (3 mL 1M Gadobutrol). Thereafter, a 2D SE multi-slice single-shot EPI DSC-MRI sequence was performed during the administration of a subsequent contrast agent bolus (7 mL 1M Gadobutrol).
Data analysis:
PC-MRI: blood flow velocity measures were obtained from the largest LSA and its ipsilateral MCA. After correction for background noise and aliasing, the vessel area was determined from the magnitude images. The blood flow pulsatility index (PI) was calculated according to Gosling’s equation11: $$$PI=\frac{v_{max}-v_{min}}{v_{mean}}$$$, where $$$v$$$ represents peak velocity.
DSC-MRI: Images were corrected for EPI distortions (FSL topup5), and motion (FSL mcflirt6). Arterial input function (AIF) voxels were selected semi-automatically in the MCAs based on peak height and time-to-peak signal curve characteristics. The cerebral blood flow (CBF) was obtained according to $$$C_{t}(t)=CBF \cdot R(t) \circledast C_{AIF}(t)$$$ 2, using a block-circulant SVD singular value decomposition method. Signal contamination of the 10% largest blood vessels was excluded from the analysis. Perfusion maps were scaled to realistic quantitative levels, using a scaling factor based on the normalization of the perfusion measures in the white matter (WM) of controls to a reference value7.
Segmentations: The cortical gray matter (CGM), deep gray matter (DGM), and WM were automatically segmented using Freesurfer (v6.0.5)8, followed by manual corrections, with the T1-weighted MP2RAGE and T2-weighted FLAIR images as input. Region masks were co-registered to the DSC image space (FSL flirt6).
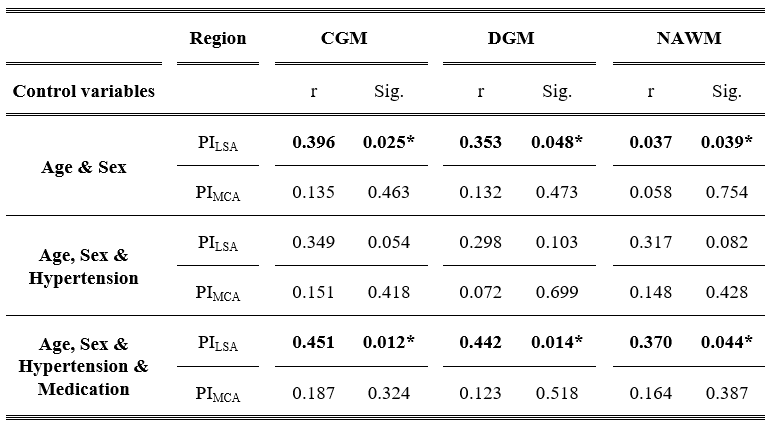
Statistics: Partial Spearman correlation analyses were used to determine the relation between the pulsatility measures and CBF, adjusted for age and sex. Subsequently, the analysis was alternatingly adjusted for hypertension status (yes/no) and medication usage (yes/no) to investigate the pathophysiological process of hypertension and the effect of antihypertensive medication. P<0.05 was considered significant.
Results
A higher PILSA was related to a higher CBF adjusting for sex and age. After additionally correcting for hypertension status the relation between the PILSA and CBF was no longer significant. Subsequently correcting for medication usage again resulted in a significant positive relation.Discussion
Blood flow pulsatility and cerebral perfusion were measured to gain an understanding of the pathophysiological processes in hypertensive patients, especially focusing on the small vasculature by exploiting the possibilities of ultra-high-field strength (7T).We found that a higher PILSA related to a higher CBF, which is in contrast to findings of previous studies assessing the large cerebral vasculature3,14. The contrary results of our study might be explained by the smaller compensation capacity in the small vasculature compared to the larger vasculature. A higher blood flow pulsatility will then easier overcome the peripheral resistance of the cerebral microvasculature, leading to higher velocities and, subsequently, a higher CBF. The CBF decrease, observed by previous studies, was also not related to pulsatility in the larger artery (PIMCA) in this study. This could be due to the SE sequence, which is particularly sensitive to the small vasculature, measuring only 34-45% of the total vasculature compared to a GE sequence15,16.
The relation between PILSA and CBF disappeared after adjusting for hypertension status, indicating the influence of hypertension status on PILSA. The use of antihypertensive medicine reversed this effect, likely due to the vasodilating effect of these medicine leading to a decrease in pulsatility.
Conclusion
A higher PILSA was associated with a higher CBF in the cerebral microvasculature, suggesting a lower compensating capacity for increased pulsatility in the smaller vessels compared to larger vessels. Hypertension status seems to have an effect on the varying pulsatility, which seems to be counteracted by medication use.Acknowledgements
This work was supported by the Stichting de Weijerhorst Foundation, and is part of the program Translational Research 2 with project number 446002509, funded by ZonMw/Epilepsiefonds.References
1. Lahiri S, Schlick KH, Padrick MM, et al. Cerebral Pulsatility Index Is Elevated in Patients with Elevated Right Atrial Pressure. J Neuroimaging. 2018;28(1):95-98.
2. Bailey TG, Klein T, Meneses AL, et al. Cerebrovascular function and its association with systemic artery function and stiffness in older adults with and without mild cognitive impairment. Eur J Appl Physiol. 2022;122(8):1843-1856.
3. Tarumi T, Shah F, Tanaka H, Haley AP. Association between central elastic artery stiffness and cerebral perfusion in deep subcortical gray and white matter. Am J Hypertens. 2011;24(10):1108-1113.
4. Mitchell GF. Aortic Stiffness and Cerebral Blood Flow. Am J Hypertens. 2011;24(10):1056-1056.
5. Webb AJS, Werring DJ. New Insights into Cerebrovascular Pathophysiology and Hypertension. Stroke. 2022;53(4):1054-1064.
6. Arts T, Onkenhout LP, Amier RP, et al. Non-Invasive Assessment of Damping of Blood Flow Velocity Pulsatility in Cerebral Arteries With MRI. J Magn Reson Imaging. 2022;55(6):1785-1794.
7. Østergaard L. Principles of cerebral perfusion imaging by bolus tracking. J Magn Reson Imaging. 2005;22(6):710-717.
8. Boxerman JL, Schmainda KM, Weisskoff RM. Relative Cerebral Blood Volume Maps Corrected for Contrast Agent Extravasation Significantly Correlate with Glioma Tumor Grade, Whereas Uncorrected Maps Do Not. Ajnr Am J Neuroradiol. 2006;27(4):859-867.
9. Boxerman J, Hamberg L, Rosen B, Weisskoff R. Mr contrast due to intravascular magnetic susceptibility perturbations InterEditions/CNRS Editions, Paris, InterEditi. Magn Reson Med. 1995;34:555–566.
10. Weisskoff R, Zuo CS, Boxerman JL, Rosen BR. Microscopic susceptibility variation and transverse relaxation: Theory and experiment. Magn Reson Med. 1994;31(6):601-610.
11. Gosling RG, King DH. Arterial assessment by Doppler shift ultrasound. Proc R Soc Med. 1974;67(6):447-449.
12. Andersson JLR, Skare S, Ashburner J. How to correct susceptibility distortions in spin-echo echo-planar images: application to diffusion tensor imaging. Neuroimage. 2003;20(2):870-888.
13. Jenkinson M, Bannister P, Brady M, Smith S. Improved Optimization for the Robust and Accurate Linear Registration and Motion Correction of Brain Images. Neuroimage. 2002;17(2):825-841.
14. Kellner E, Breyer T, Gall P, et al. MR evaluation of vessel size imaging of human gliomas: Validation by histopathology. J Magn Reson Imaging. 2015;42(4):1117-1125.
15. Fischl B, Salat DH, Busa E, et al. Whole brain segmentation: Automated labeling of neuroanatomical structures in the human brain. Neuron. 2002;33(3):341-355.
16. Liu W, Chen Z, Ortega D, et al. Arterial elasticity, endothelial function and intracranial vascular health: A multimodal MRI study. J Cereb Blood Flow Metab. 2021;41(6):1390-1397.
17. Simonsen CZ, Østergaard L, Smith DF, Vestergaard-Poulsen P, Gyldensted C. Comparison of gradient- and spin-echo imaging: CBF, CBV, and MTT measurements by bolus tracking. J Magn Reson Imaging. 2000;12(3):411-416.
18. Østergaard L, Smith DF, Vestergaard-Poulsen P, et al. Absolute Cerebral Blood Flow and Blood Volume Measured by Magnetic Resonance Imaging Bolus Tracking: Comparison with Positron Emission Tomography Values. J Cereb Blood Flow Metab. 1998;18(4):425-432.
Figures
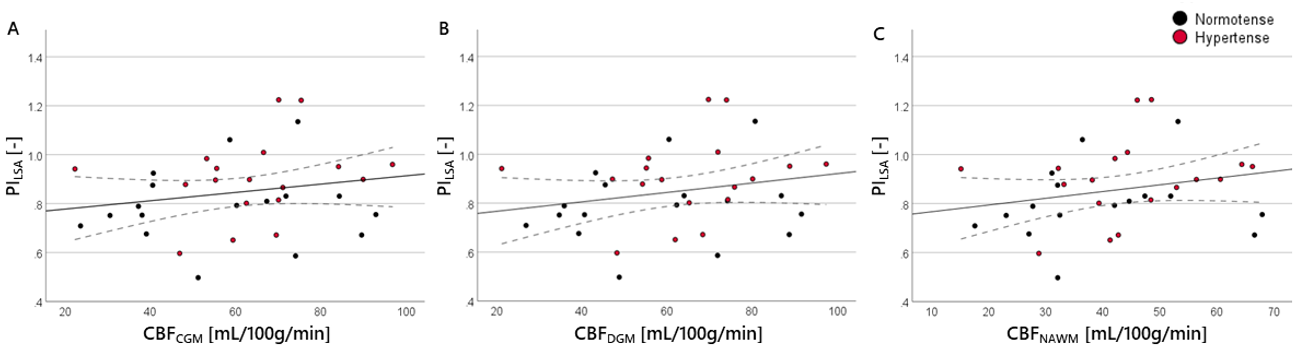
Figure 1: Scatterplots showing the relation between PILSA and CBF in the (A) CGM, (B) DGM, and (C) NAWM. Hypertensive subjects are depicted with red data points.
*PI, pulsatility index; LSA, lenticulostriate artery; CBF, cerebral blood flow; CGM, cortical gray matter; DGM, deep gray matter; NAWM, normal-appearing white matter.
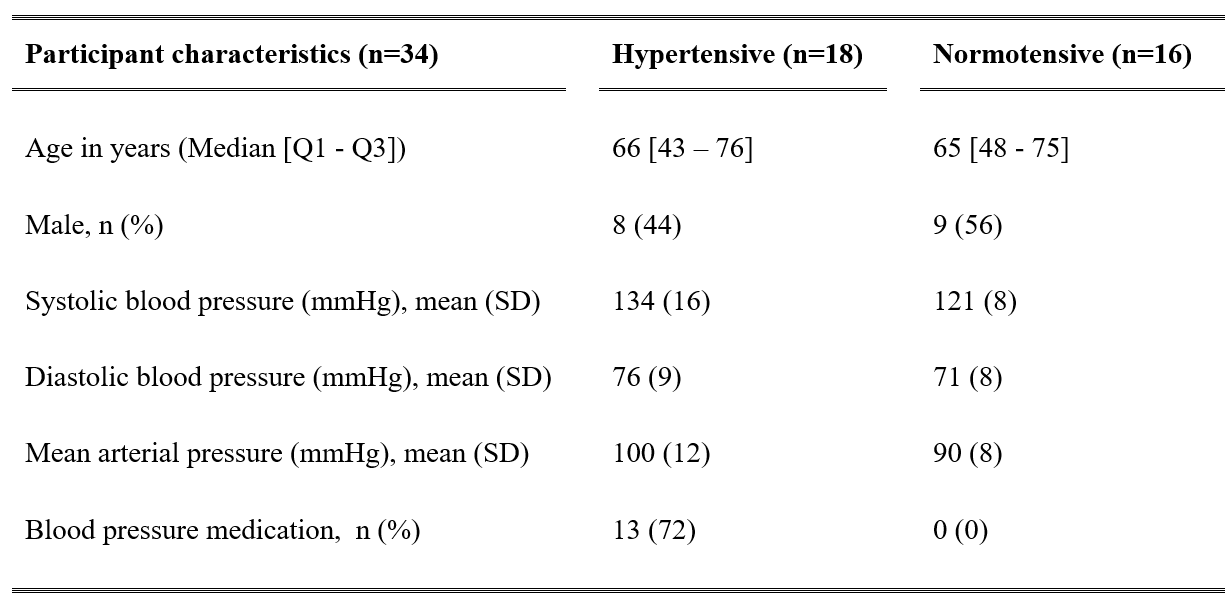
Table 1: Demographical data of the included study participants. Hypertension is defined when the blood pressure level is ≥ 135 mmHg systolic or ≥ 85 mmHg diastolic, or both. Subjects taking antihypertensive medication were also defined as hypertensive.
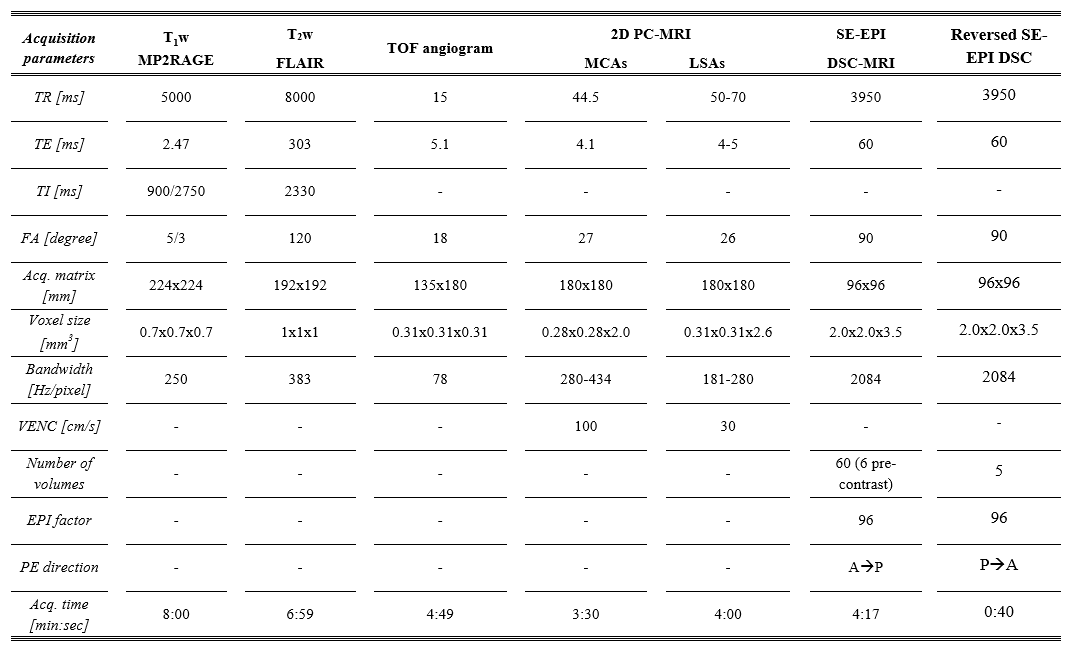
Table 2: Acquisition parameters of the imaging protocol.
*MP2RAGE,
magnetization-prepared 2 rapid acquisition gradient echo; FLAIR, fluid
attenuated inversion recovery; PC-MRI, Phase contrast MRI; DSC, dynamic susceptibility contrast; EPI, echo
planar imaging; TOF, time-of-flight; MCA indicates
Middle cerebral artery; LSA, Lenticulostriate artery; TR,
repetition time; TE, echo time; TI, inversion time; FA, flip angle; VENC,
velocity encoding; PE, phase-encoding; P, posterior; A, anterior.