2475
Impact of resting physiology on the repeatability of phase contrast MRI measures of cerebral blood flow
Hannah R Johnson1,2, Rachael C Stickland2, Kristina M Zvolanek1,2, Yufen Chen3, and Molly G Bright1,2
1Biomedical Engineering, McCormick School of Engineering, Northwestern University, Evanston, IL, United States, Evanston, IL, United States, 2Physical Therapy and Human Movement Sciences, Feinberg School of Medicine, Northwestern University, Chicago, IL, United States, 3Radiology, Feinberg School of Medicine, Northwestern University, Chicago, IL, United States
1Biomedical Engineering, McCormick School of Engineering, Northwestern University, Evanston, IL, United States, Evanston, IL, United States, 2Physical Therapy and Human Movement Sciences, Feinberg School of Medicine, Northwestern University, Chicago, IL, United States, 3Radiology, Feinberg School of Medicine, Northwestern University, Chicago, IL, United States
Synopsis
Keywords: Blood vessels, Velocity & Flow
Interpretation of clinically significant changes in total cerebral blood flow (CBF) can be confounded by normal variability in flow measures. We assessed the effects of resting end-tidal CO2 (PETCO2) on inter-session variability in total CBF as measured with phase contrast MRI. Participants were scanned twice, 1-3 weeks apart, with PETCO2 clamped at resting physiology. Clamping PETCO2 at participants’ resting respiratory physiology does not notably improve inter-session variability in flow, which was found to be consistent with previously reported values. Furthermore, inter-session changes in resting PETCO2 did not help to explain noted variability in total CBF.Introduction
Total cerebral blood flow (CBF) is the combined blood flow in the internal carotid and vertebral arteries supplying the brain1 and is traditionally normalized by brain volume. CBF is an important metric of brain health that can be readily measured clinically with phase contrast MRI. Total CBF is known to change with age2, cerebrovascular disease3, and neurodegenerative disorders4, but interpretation of clinically significant changes can be confounded by expected variability in measurements of flow. For example, acute changes in the end-tidal partial pressure of CO2 (PETCO2) are known to alter blood flow5, and PETCO2 fluctuates normally by 1.08 mmHg between days6. We hypothesize that measuring and accounting for changes in resting PETCO2 will reduce the observed variability in measured total CBF in healthy participants.Data Collection
13 healthy participants (29±4years, 8F) were scanned an average of 10(±5) days apart at the same time on a Siemens 3T Prisma with a 32-channel head coil. During each session, a 3D time-of-flight (TOF) angiogram was used to position the phase contrast (PC) slice perpendicular to the internal carotid arteries (ICAs) and vertebral arteries (VAs) above the carotid bifurcation (Fig1A,B). A retrospective-gated PC scan was acquired (TR=47.52ms, TE=3.45ms, resolution=0.5x0.5x5.0mm3, 1 slice, FA=15°, velocity encoding=100cm/s). Pulse data were collected and PC data were sorted into 8 cardiac bins during reconstruction. Participant resting end-tidal values (O2 and CO2) were calculated and targeted (i.e., “clamped”) using an MRI-compatible computer-controlled gas blending and delivery system (RespirAct RA-MRTM, Thornhill Medical, Toronto7). A T1-weighted image was also acquired for calculation of intracranial volume.Data Analysis
The T1-weighted image was segmented into grey matter (GM), white matter (WM), and cerebrospinal fluid masks using FAST (FSL8). GM and WM volumes were calculated (FSL) and summed to find the intracranial tissue volume for each participant. PC datasets were processed with in-house MATLAB software (Mathworks, Natick, MA). ICA and VA ROIs were determined by thresholding the phase image, with a separate threshold for the ICAs and for the VAs (Fig1C,D). Two researchers agreed on each threshold for consistency. Data quality was qualitatively assessed at this time using both TOF and PC data: if vessels were clearly distinguishable but appeared angled or without expected laminar flow, the quality was considered “fair”, and if they did not have clear edges, the quality was considered “poor” (Fig1E). Flow was calculated as the product of mean blood velocity and vessel cross-sectional area and then averaged across 8 cardiac bins. Mean total blood flow was defined as the sum of flows in each vessel divided by the intracranial volume from the first scan session. PETCO2 values were averaged across the PC scan time.A linear mixed effects model with session and subject modeled as random effects was used to estimate between-subject and within-subject variance and coefficients of variation9,10. A subsequent model was developed to evaluate the effect of PETCO2 on within-subject variability, modeled as a fixed effect. Total CBF variance is the sum of between-subject, within-subject, and residual variances. Coefficients of variation (CV) were found by dividing the modeled standard deviation by the population mean CBF. The intraclass correlation coefficient (ICC) was calculated between sessions.
Results
Sub08 was excluded due to poor data quality (Fig1). Substantial variability was observed between subjects (Fig2A), and the ICC=0.32 was deemed “poor”11. However, reasonable correlation and no systematic bias were observed (Fig2B,C). The high variability in CBF may be partially attributable to specific vessels with poor data quality; although no vessel demonstrated notably higher flow variability between sessions (Fig3A,B), VA PC data were frequently deemed “fair” or “poor” quality (Fig1), likely due to their smaller size. Removing datapoints with “poor” quality slightly increased inter-session correlations in VA CBF (Fig3C).In assessing the effect of resting PETCO2 on CBF variability, we observed that inter-session changes in the measured (and subsequently clamped) resting PETCO2 were not significantly correlated with observed inter-session changes in total CBF (Fig4). Furthermore, inclusion of PETCO2 as a covariate in our linear mixed effects model resulted in changes of less than 2% to all measures of variance (Table1) and indicated that PETCO2 does not contribute significantly to variability (t=0.54, p=0.59).
Discussion
Inter-session total CBF variability (CV=9.14%) was found to be higher than previous studies, which reported CVs of 4-7% for sessions separated by 1 day and up to 6 weeks1,9-10,12. The inclusion of PETCO2 in the linear model did not reduce unexplained inter-session variability, suggesting that other physiological factors or methodological limitations are driving the observed variability. Wearing the RespirAct face mask resulted in participants being lower down in the head coil, which may reduce PC-MRI signal quality and potentially contribute to the greater inter-session variability observed in our data relative to the literature.Mean total CBF across subjects was lower than the established range of 45-55 ml/100g/min13. This could be due to more conservative thresholding when processing PC scans, leading to an underestimation in flow. Additionally, most subjects had at least one vessel that was not well-captured with a single slice, most commonly one or both VAs. A second PC-MRI acquisition, with slice placement optimized for the VAs or any vessels not well-captured in the primary slice, would likely improve reliability.
Acknowledgements
Thanks to Andrew Vigotsky for statistical advice, and to staff at the Center for Translational Imaging (CTI), Northwestern Radiology, and members of the Bright Lab for help with study set up. This research was supported in part by the National Institutes of Health's National Center for Advancing Translational Sciences, Grant Number UL1TR001422. The content is solely the responsibility of the authors and does not necessarily represent the official views of the National Institutes of Health. K.M.Z. was supported by an NIH-funded training program (T32EB025766).References
- Spilt, A, Box, FM, van der Geest, RJ, et al. Reproducibility of total cerebral blood flow measurements using phase contrast magnetic resonance imaging. J. Magn. Reson. Imaging. 2002;16: 1-5. https://doi.org/10.1002/jmri.10133
- Wu, C, Honarmand, A, Schnell, S, et al. Age‐Related Changes of Normal Cerebral and Cardiac Blood Flow in Children and Adults Aged 7 Months to 61 Years. J. Am. Heart Assoc. 2016;5:e002657. https://doi.org/10.1161/JAHA.115.002657
- Detre JA, Alsop DC, Vives LR, et al. Noninvasive MRI evaluation of cerebral blood flow in cerebrovascular disease. Neurology. 1998;50(3):633-41. https://doi.org/10.1212/wnl.50.3.633
- Sweeney, MD, Kisler, K, Montagne, A, et al. The role of brain vasculature in neurodegenerative disorders. Nat Neurosci. 22018;1:1318–1331. https://doi.org/10.1038/s41593-018-0234-x
- Vovk A, Cunningham DA, Kowalchuk JM, et al. Cerebral blood flow responses to changes in oxygen and carbon dioxide in humans. Can J Physiol Pharmacol. 2002;80(8):819-27. https://doi.org/10.1139/y02-105
- Crosby, A, and Robbins, PA. Variability in End‐Tidal PCO2 and Blood Gas Values in Humans. Experimental Physiology. 2003;88:603-610. https://doi.org/10.1113/eph8802585
- Slessarev, M, Han, J, Mardimae, A, et al. Prospective targeting and control of end-tidal CO2 and O2 concentrations. J. Physiol., 2007;581:1207-1219. https://doi.org/10.1113/jphysiol.2007.129395
- Jenkinson, M, Beckmann, CF, Behrens, TEJ, et al. FSL. Neuroimage, 2012:62:2:782-90. https://doi.org/10.1016/j.neuroimage.2011.09.015.
- Ismaili ARA, Vestergaard MB, Hansen AE, et al. Components of day-to-day variability of cerebral perfusion measurements – Analysis of phase contrast mapping magnetic resonance imaging measurements in healthy volunteers. PLOS ONE 2018;13(6): e0197807.https://doi.org/10.1371/journal.pone.0197807
- Henriksen, OM, Larsson, HB, Hansen, AE, et al. Estimation of intersubject variability of cerebral blood flow measurements using MRI and positron emission tomography. J. Magn. Reson. Imaging, 2012;35:1290-1299. https://doi.org/10.1002/jmri.23579
- Cicchetti, DV. The precision of reliability and validity estimates re-visited: distinguishing between clinical and statistical significance of sample size requirements. J. Clin. Exp. Neuropsychol. 2001:23(5):695-700. https://doi.org/10.1076/jcen.23.5.695.1249
- Liu P, Lu H, Filbey FM, et al. Automatic and Reproducible Positioning of Phase-Contrast MRI for the Quantification of Global Cerebral Blood Flow. PLOS ONE 2014;9(5):e95721. https://doi.org/10.1371/journal.pone.0095721
- Lassen NA. Normal Average Value of Cerebral Blood Flow in Younger Adults is 50 ml/100 g/min. Journal of Cerebral Blood Flow & Metabolism. 1985;5(3):347-349. https://doi.org/10.1038/jcbfm.1985.48
Figures
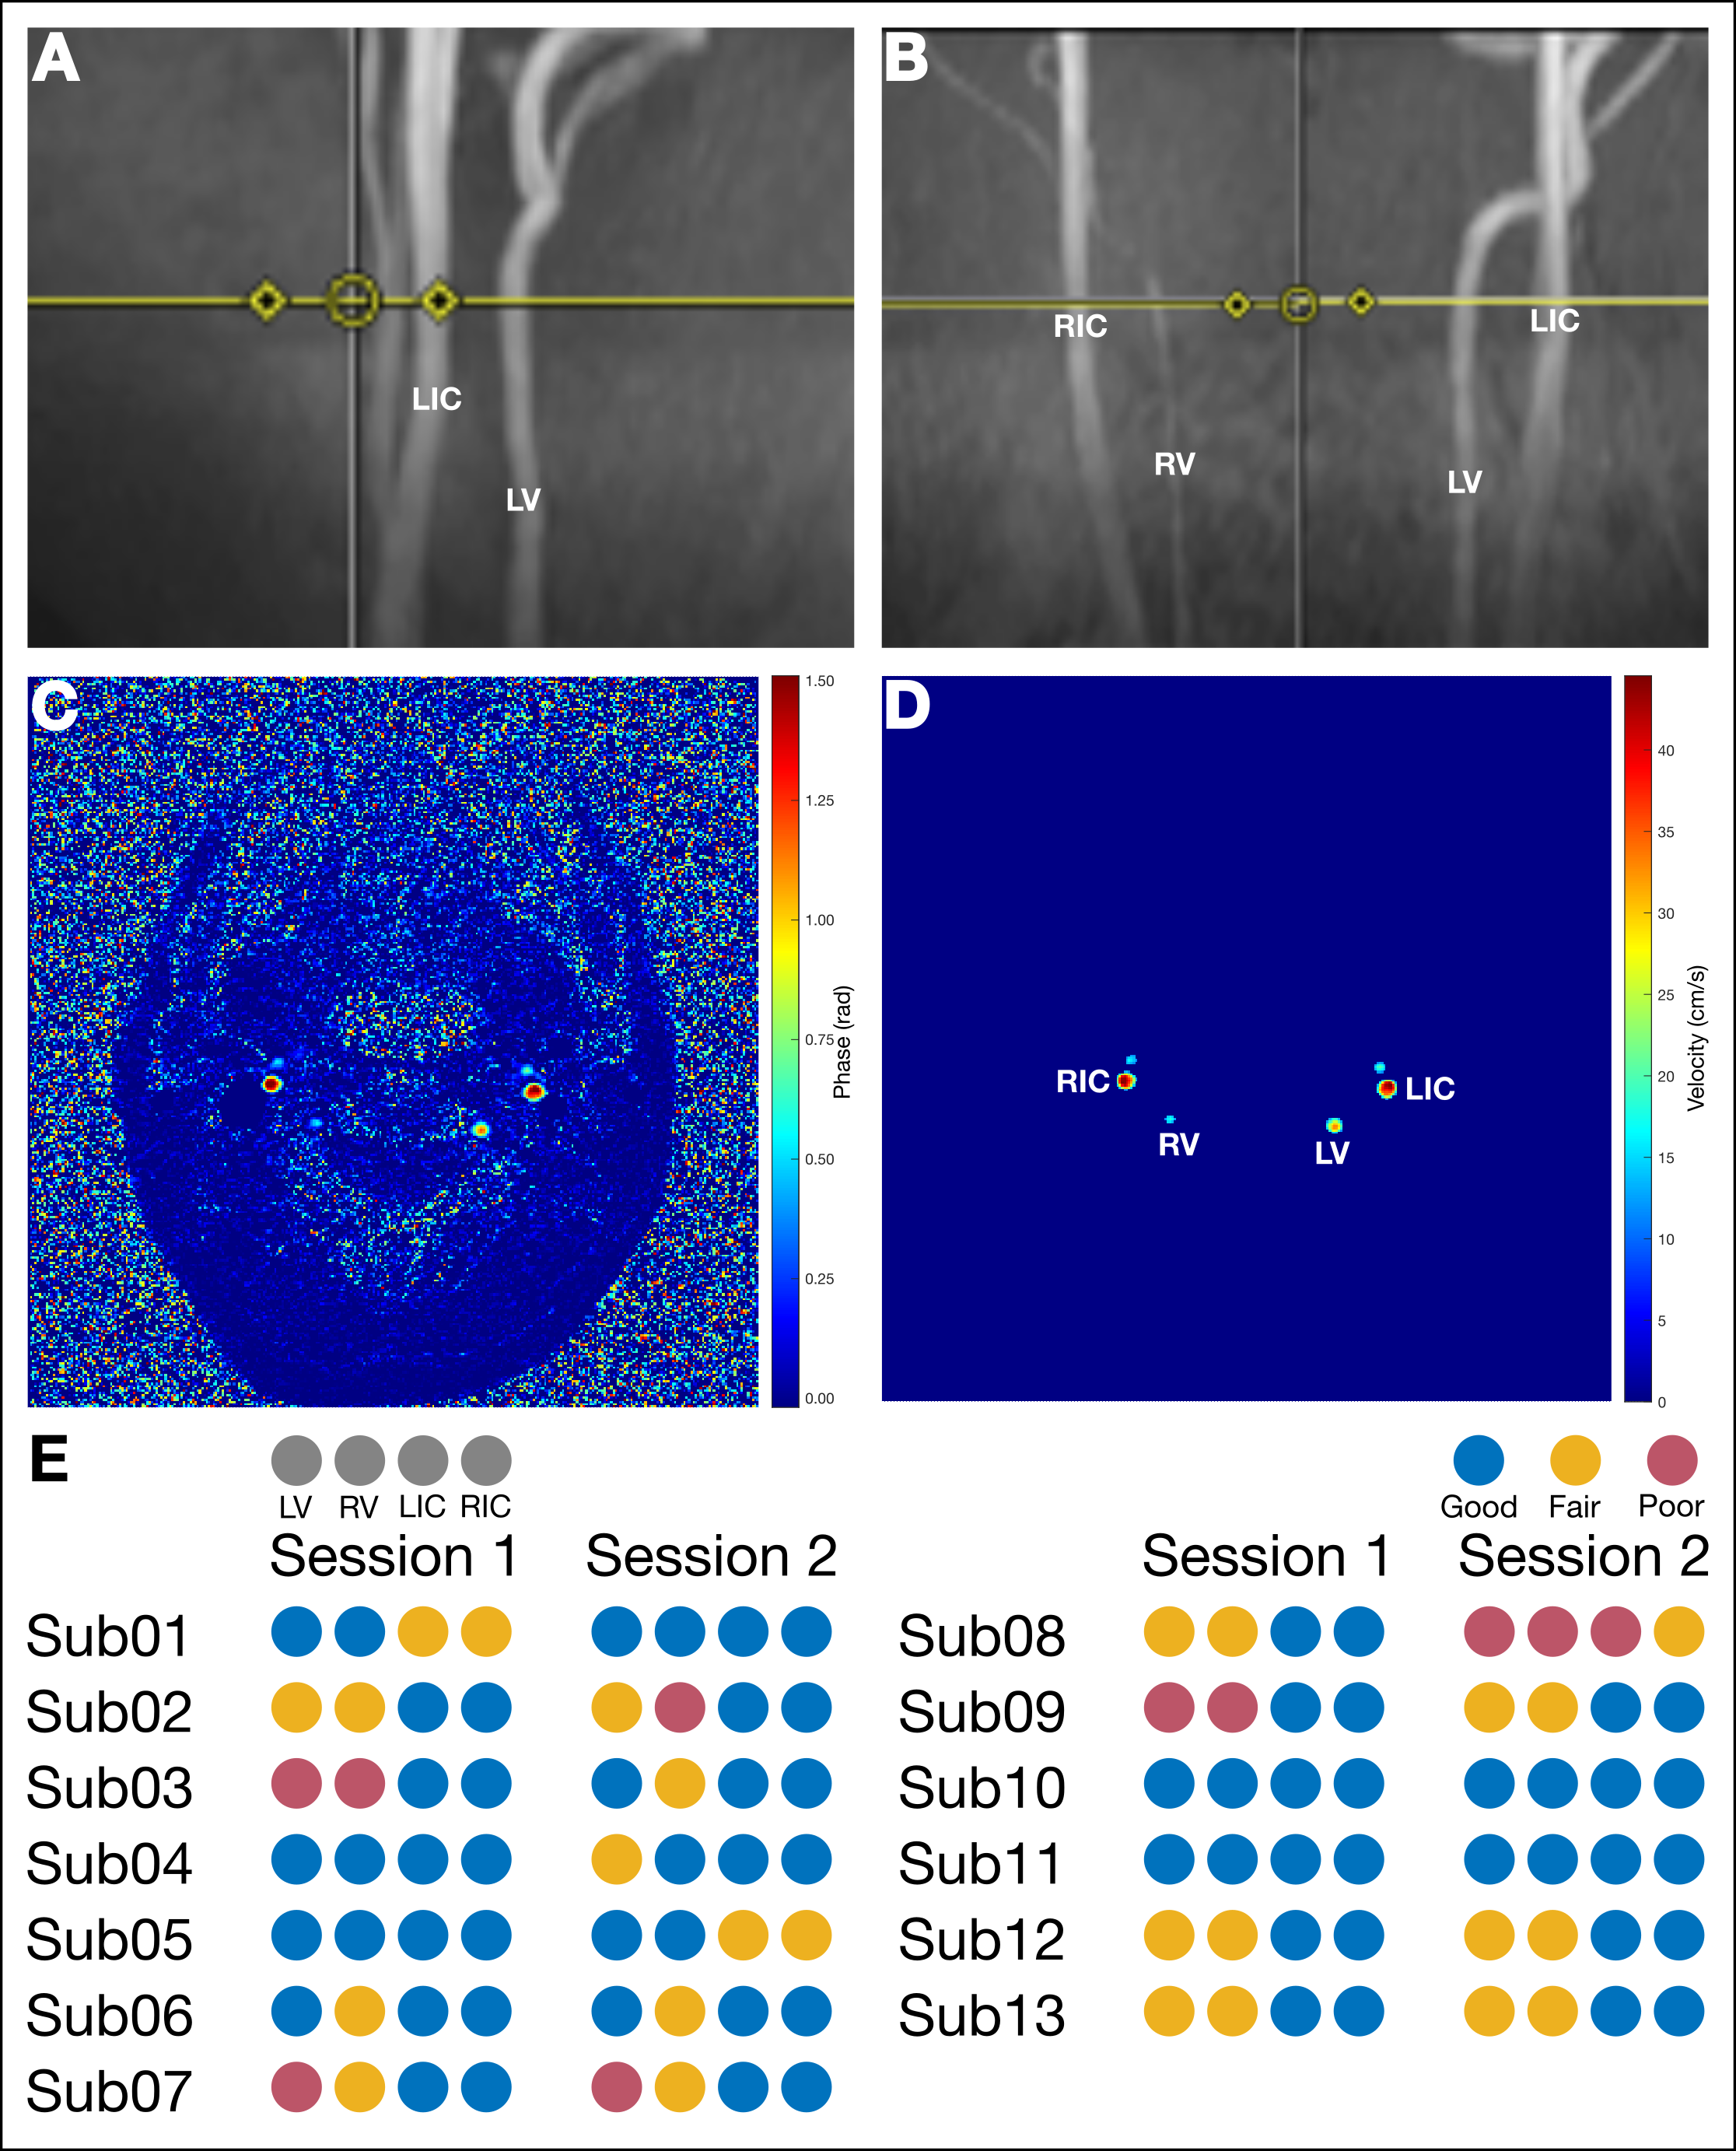
Figure 1. Data Analysis (A) Sagittal and (B) coronal placement of the PC slice (yellow line) for a representative subject. (C) Unmasked and (D) masked phase images. (E) Assessed data quality for each artery. Blue indicates trustworthy data. Yellow indicates fair quality, i.e., total flow is not strictly comparable to other studies but is comparable between sessions. Red indicates poor-quality data. LIC: left internal carotid artery; RIC: right internal carotid artery; LV: left vertebral artery; RV: right vertebral artery.
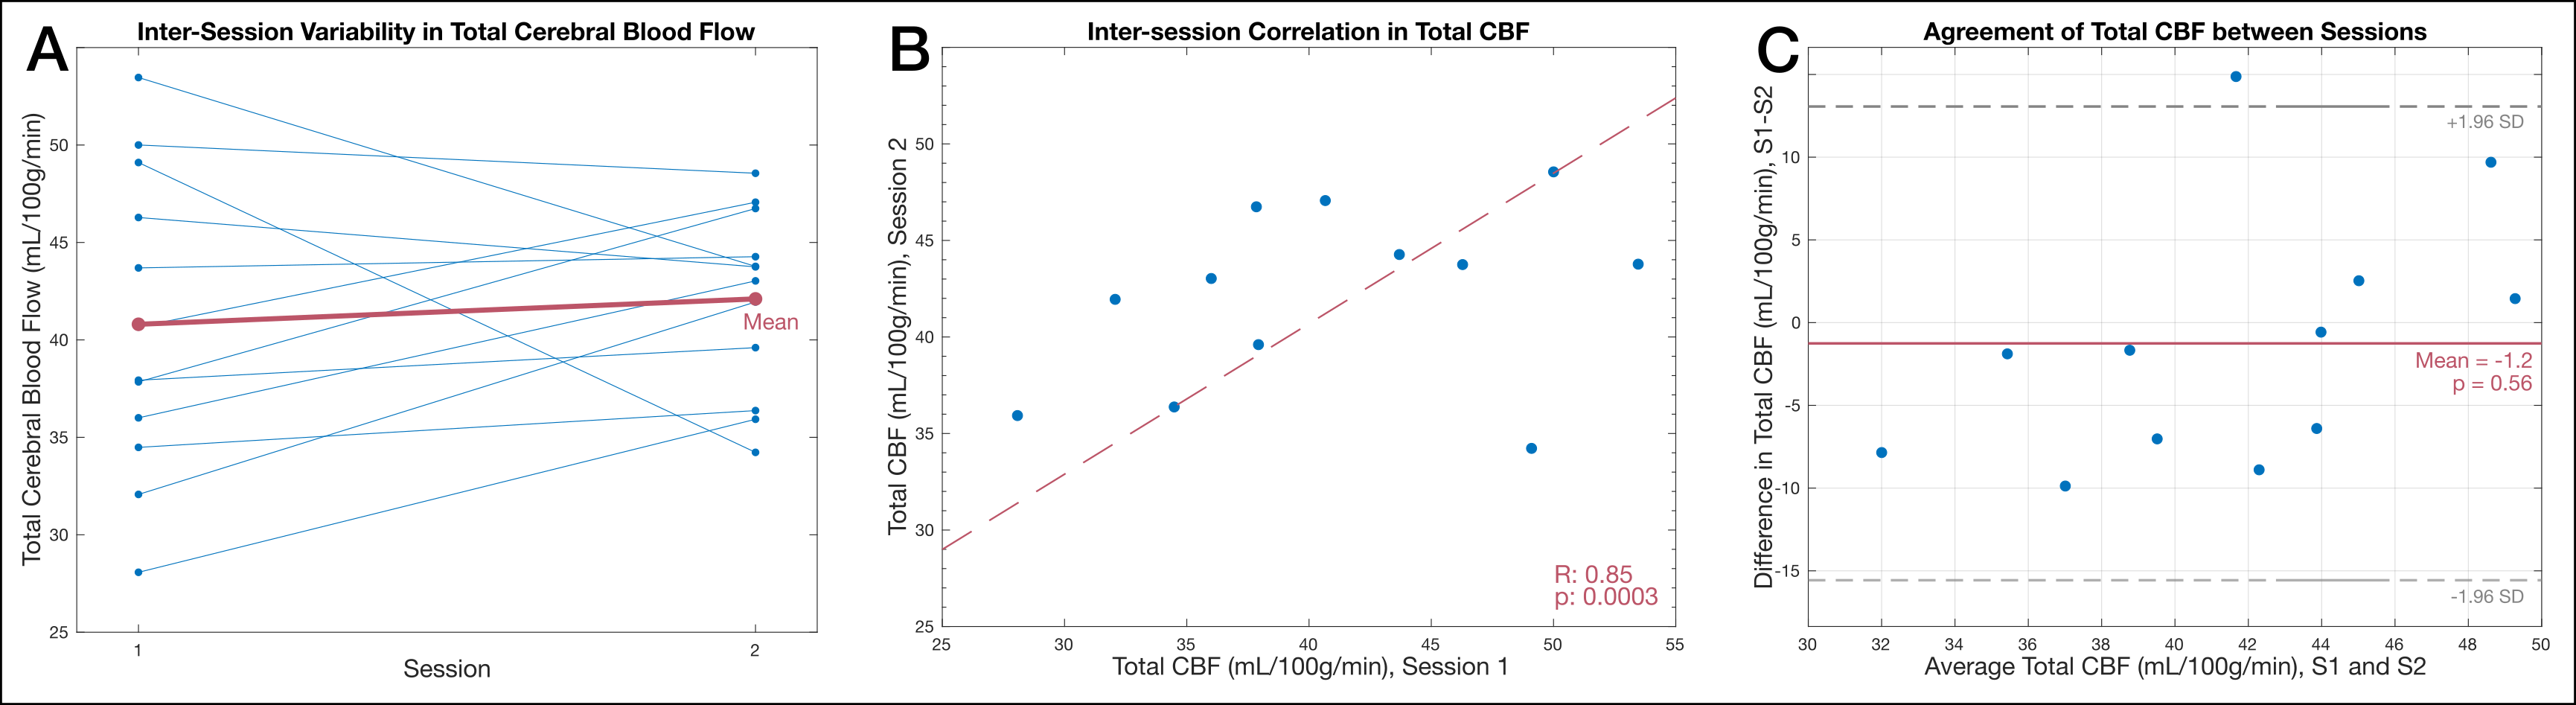
Figure 2. Changes in total CBF between sessions (A) Inter-session difference in total CBF for each subject (blue), and in the group mean CBF (S1: 40.8±7.8mL/100g/min; S2: 42.1±4.7mL/100g/min) (red). (B) Correlation between the two total CBF measures for each participant and the fitted regression line. (C) Bland-Altman plot of the inter-session total CBF measures. The uncorrected p-value for the mean difference test against zero is reported. CBF:cerebral blood flow; S1: Session1; S2: Session2.
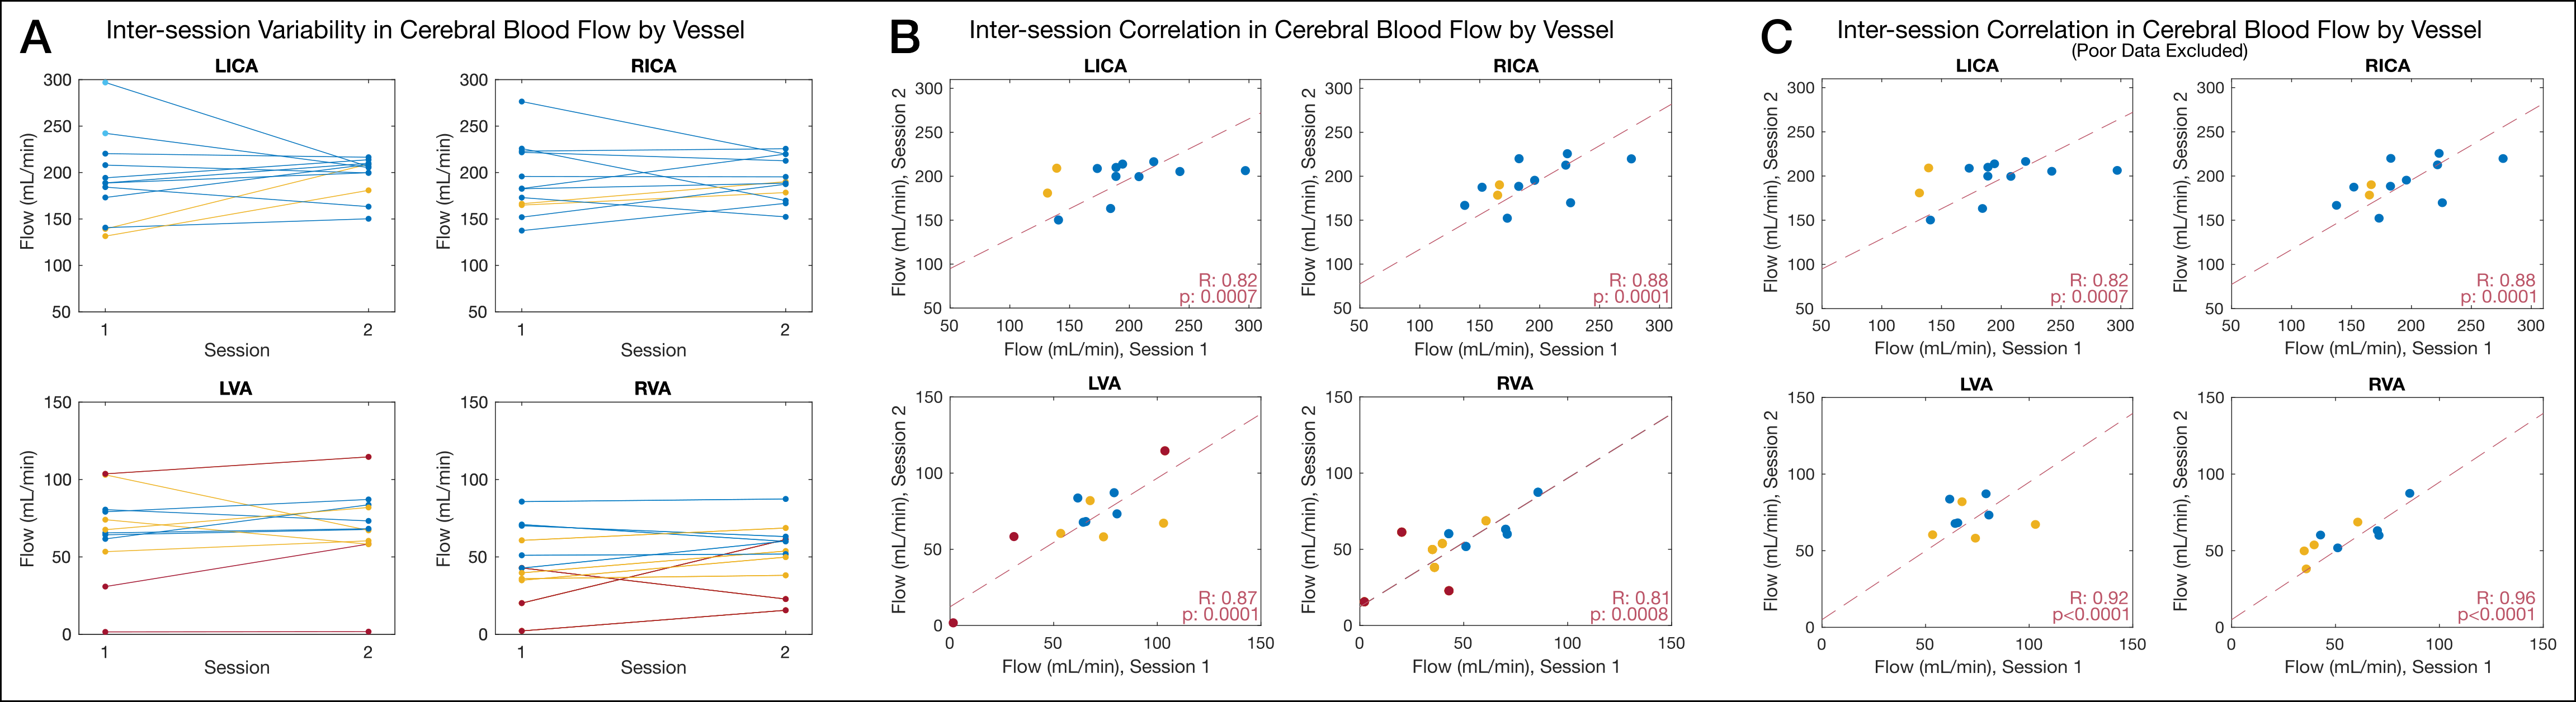
Fig 3. Changes in Blood Flow by Vessel (A) Inter-session difference in blood flow is shown for each of the four vessels of interest. (B) Inter-session correlation in flow for each vessel. As described in Fig1, poor, fair, and good data quality are represented by red, yellow, and blue, respectively. Note: flows for individual vessels are not normalized to intracranial volume. LICA: left internal carotid artery; RICA: right internal carotid artery; LVA: left vertebral artery; RVA: right vertebral artery.
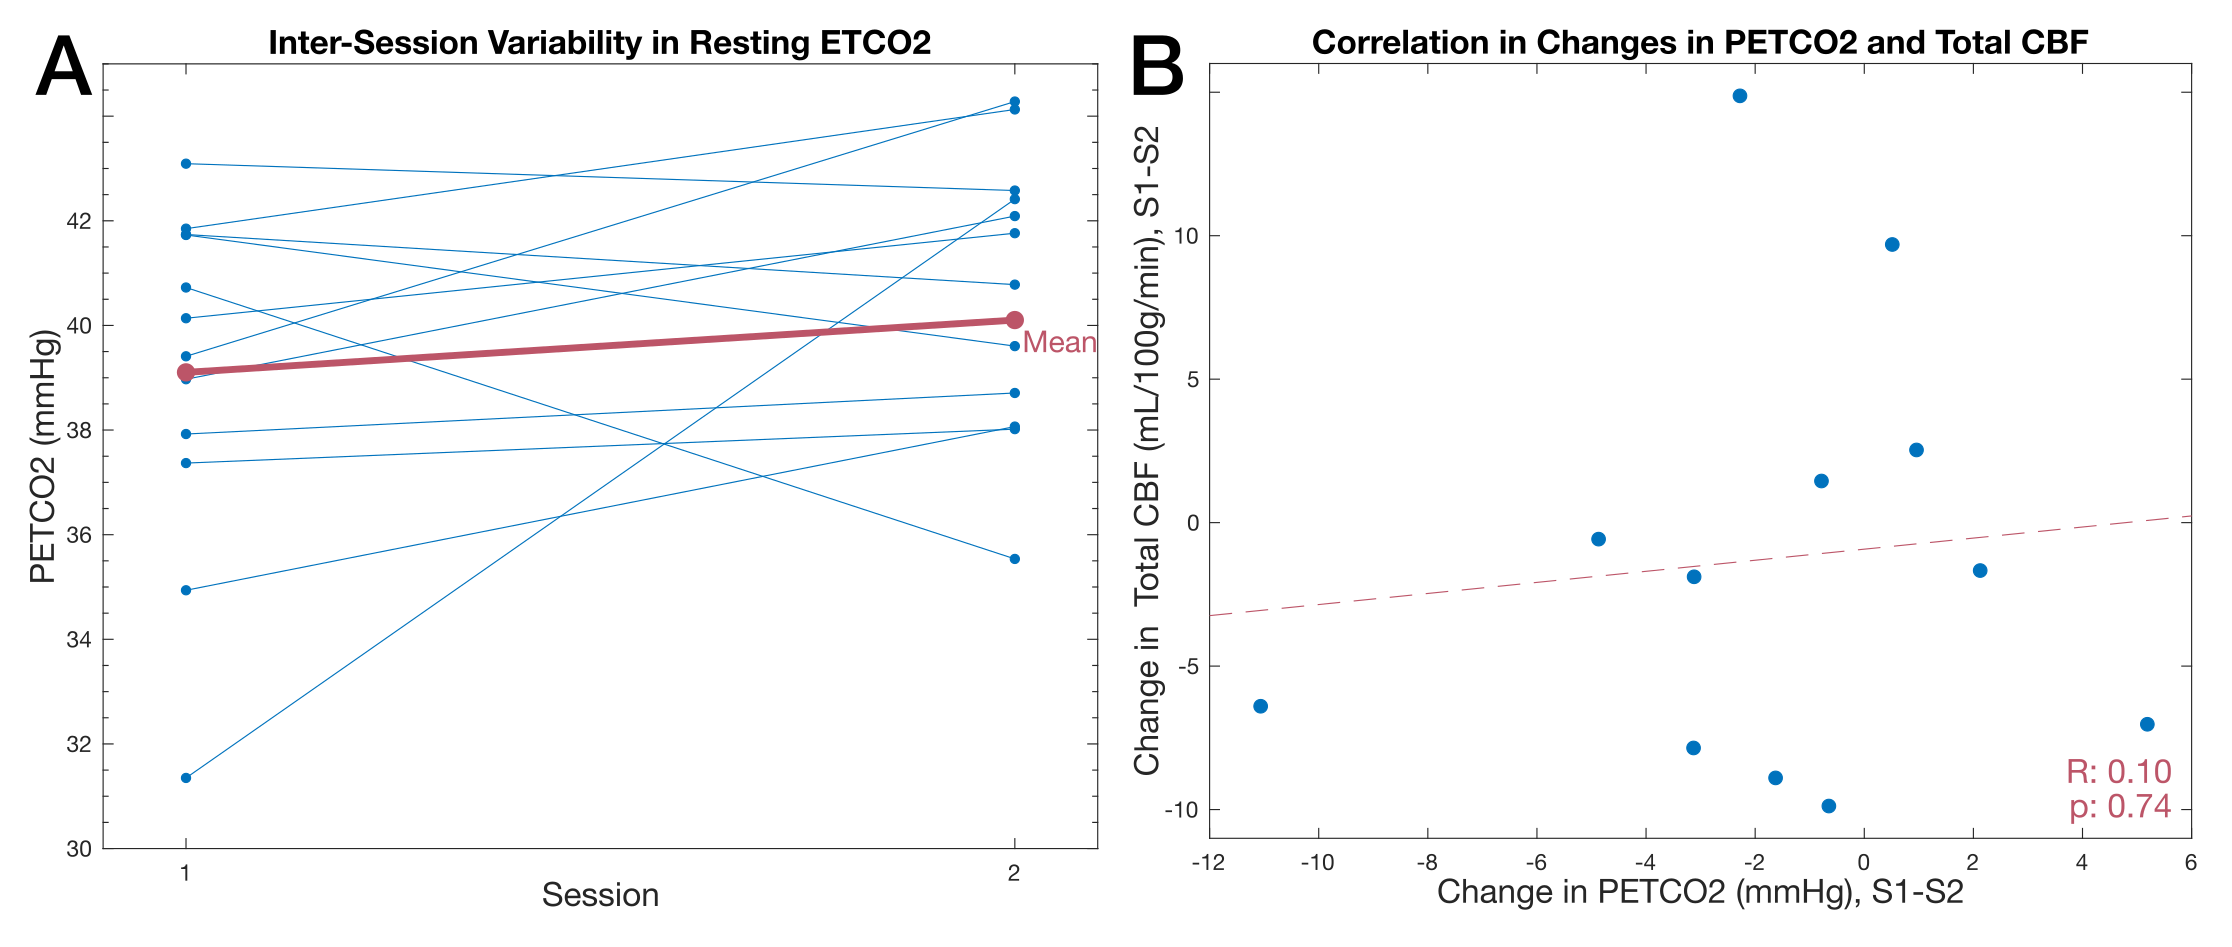
Figure 4. Relationship between PETCO2 and total CBF (A) Difference in achieved PETCO2 between each session (blue), and the difference in the group mean achieved PETCO2 for each session (S1: 39.1±3.3mmHg; S2: 40.6±2.7mmHg) (red). (B) Correlation between inter-session PETCO2 and intersession total CBF with fitted regression line (red). PETCO2:end-tidal partial pressure of CO2; CBF: cerebral blood flow; S1: Session1; S2: Session2.
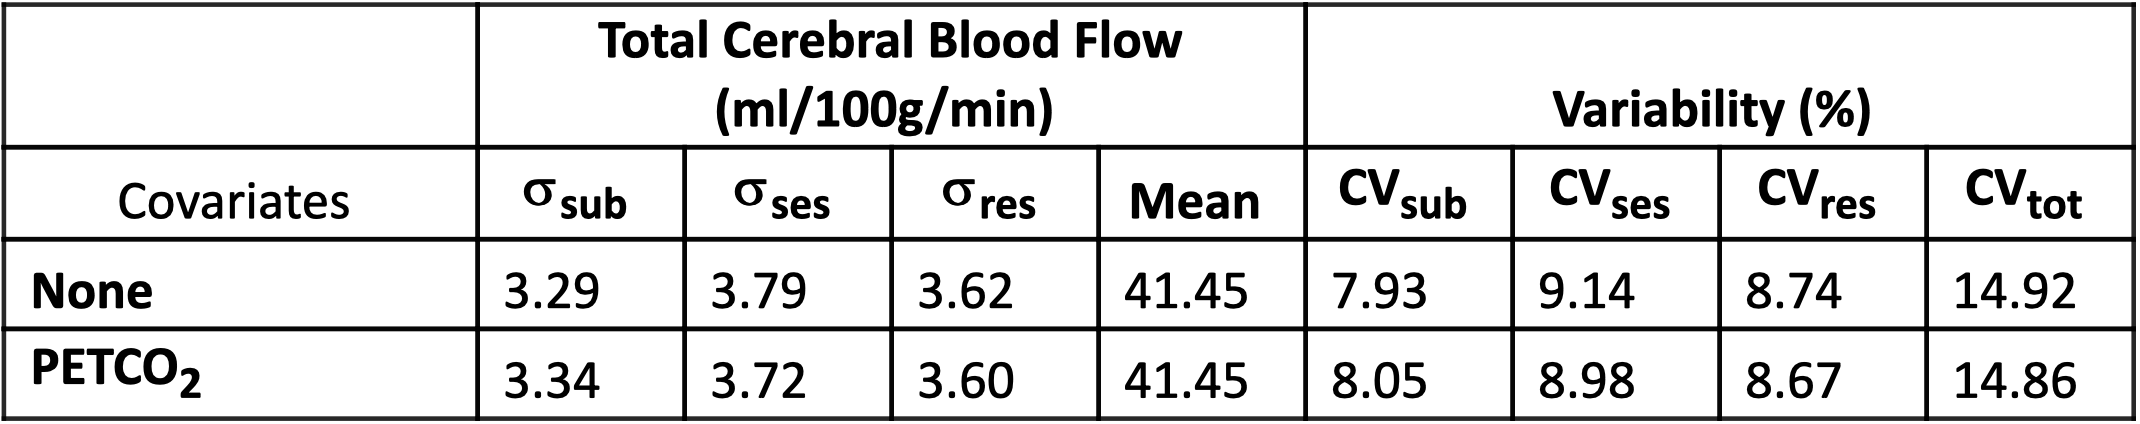
Table 1. Summary of Linear Mixed Models Standard deviations of variability between subjects (σsub), between sessions (σses), and from residual effects (σres) and the corresponding coefficients of variation for models described by Equations 1 and 2.
DOI: https://doi.org/10.58530/2023/2475