2473
Microstructural and microvascular alterations in the non-NPSLE patients: a DKI and 3D pCASL study1Longyan First Hospital Affiliated to Fujian Medical University, Longyan, China, 2Philips Healthcare, Shanghai, China
Synopsis
Keywords: Blood vessels, Brain, non-neuropsychiatric systemic lupus erythematosus
DKI and 3D pCASL were employed to investigate whether white/gray matter microstructure and cerebral microcirculation were altered in patients suffering from non-neuropsychiatric systemic lupus erythematosus (SLE). MK, MKT and CBF values were obtained from 25 brain areas, including gray and white matter. We demonstrated decreased MK, MKT, and elevated CBF in some regions in SLE compared to controls. This study suggested that the brain lesions existed in SLE, DKI and pCASL might be useful for depicting SLE brain early damages, and MK seems to be more sensitive and helpful.Introduction
Systemic lupus erythematosus (SLE) is a chronic recurrent female-predominant autoimmune connective tissue disease that affects many organ systems[1]. SLE-related brain lesions have been shown by many fMRI studies. Diffusional Kurtosis Imaging (DKI) and 3D pseudo-continuous Arterial Spin Labeling (pCASL) are accurate and noninvasive imaging methods that have been variously employed in many diseases. In order to explore cerebral microstructure and microcirculation changes in SLE, DKI and pCASL were adopted in 25 brain regions, including the frontal lobe, temporal lobe, occipital lobe, parietal lobe, splenium of corpus callosum(SCC), centrum semiovale (SOC), thalamus, head of caudate nucleus, lenticular nucleus(LN), by analyzing MK, MKT[2] (mean of kurtosis tensor) and CBF.Methods
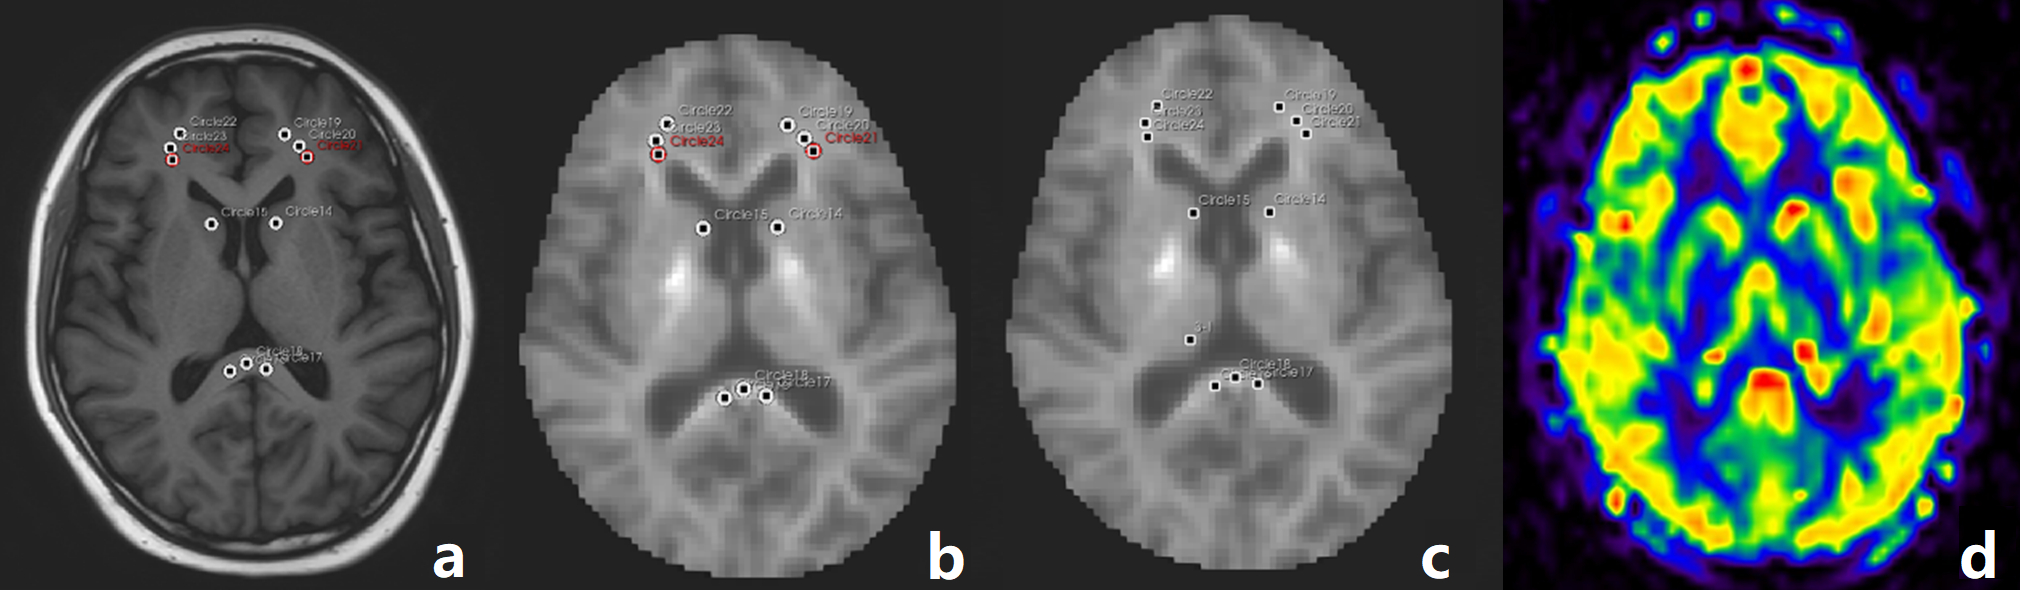
We recruited 32 non-NPSLE patients and 20 healthy controls. All the volunteers were scanned with a 3.0 T MR scanner (Ingenia CX, Philips Healthcare, Best, the Netherlands) with a 16-channel head coil. T1WI, FLAIR, 3D pCASL and DKI images were acquired. For the 3D pCASL images, a GraSE sequence was used, with TSE factor = 32, EPI factor = 15. FOV = 240*240*84 mm3, acquisition voxel size = 3.75*3.75*6 mm3, post labeling delay =1800 ms. Total acquisition time: 2min 36s. For the DKI images, TR/TE = 5709/99 ms, FOV = 222*222 mm2, voxel size = 2.7*2.7 mm2, slice thickness = 2.7 mm, 45 slices. 3 b-values (0, 1000, and 2000 s/mm2) with 32 directions, SENSE factor = 2. Total acquisition time: 8 min 33 s. The DKI images were processed with an in-house developed software ISMS (IntelliSpace Medicina Scientia) based on the open-source tool DIPY (https://dipy.org) to get the parameter maps (including MK and MKT). The pCASL images were processed with IntelliSpace Portal (v9, Philips Healthcare, Best, the Netherlands). Representative images are shown in Figure1. The SPSS 23.0 statistical software package was used for all statistical analyses. All data were presented as mean±standard deviation. Spearman and Pearson correlation analysis were used. A p-value >0.05 was considered statistically significant.Results
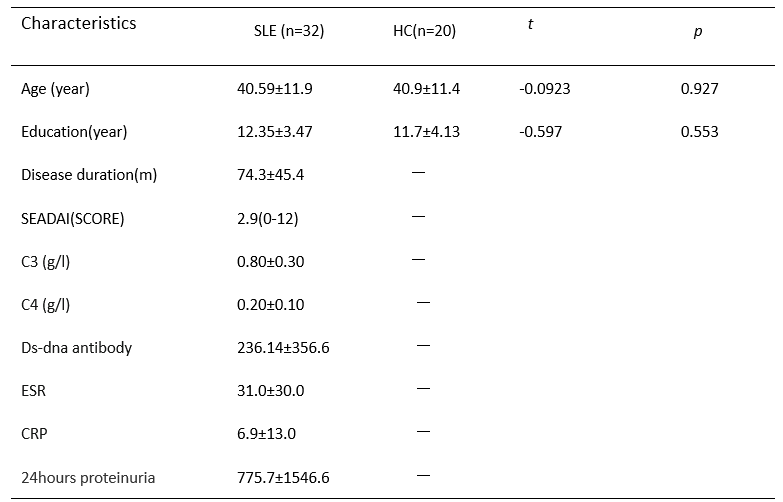
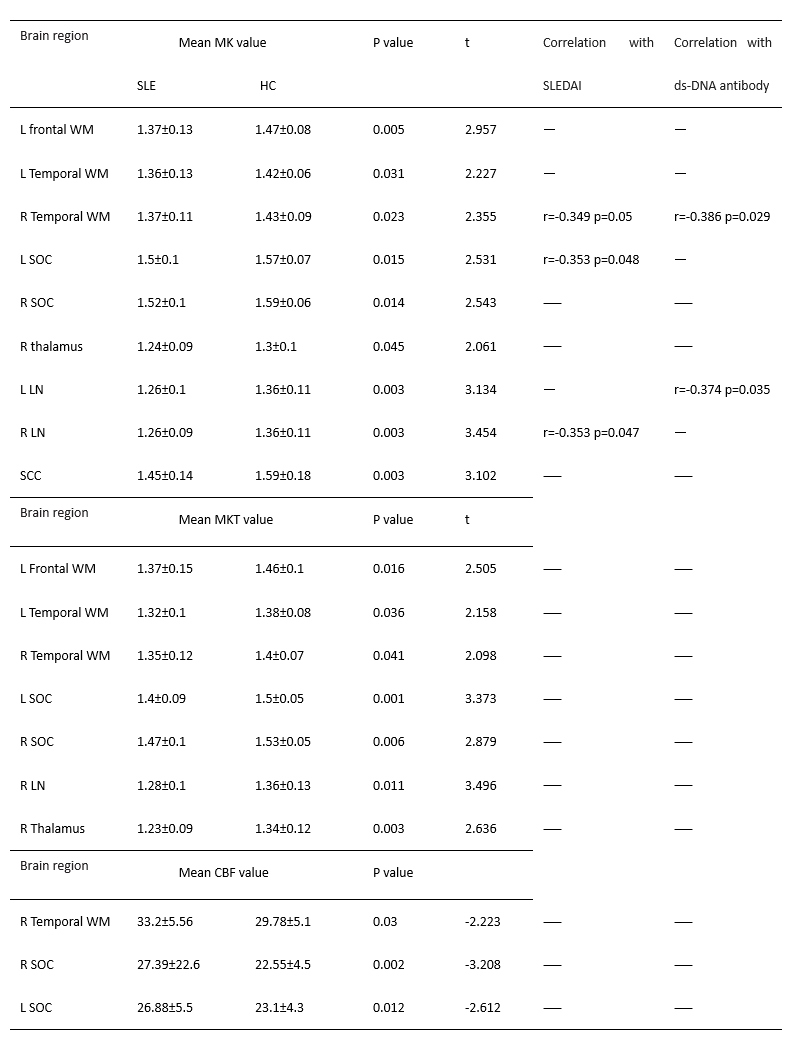
Thirty-two SLE patients and twenty healthy controls (HCs) were enrolled in this study, and the general demographic characteristics and clinical data are shown in Table 1. Compare with healthy control, SLE subjects indicated a tendency of lower MK and MKT values in all WM ROIs, and the decreases were all statistically significant in the left frontal lobe, the bilateral temporal and SOC, moreover the MK value was decreased in the right thalamus, bilateral LN and SCC, the MKT values were decreased in the right thalamus and right LN. CBF values were significantly elevated in the right temporal and the bilateral SOC; but there was no differences in CBF values in all GM regions. Abnormal MK and MKT showed weak correlations with clinical information including SLEDAI scores and ds-DNA antibody and showed no significant correlation with other clinical indices. (Table 2)Discussion
We found MK decreased in the thalamus and LN, which was in accordance with the study by Zhang[3]. MK and MKT imply the complexity of tissue microstructure, both values decreased in some regions. Compared with MKT, MK showed more regional brain changes, implying MK was more sensitive to microstructural changes. The reduction of microstructural complexity may be associated with the degradation process caused by variations in axon and myelin and neuronal contraction[4-6]. CBF value increased in the right temporal and bilateral centrum semiovale and showed a tendency to increase in white matter, which was consistent with Gasparovic[7]. Zhuo et al demonstrated an elevated CBF in normal SLE GM and a decreased CBF in NPSLE patient, suggesting the perfusion alterations was a dynamic development process[8]. It has been considered that neuronal injury and metabolic dysfunction contributed to small vessel inflammation in the brain which lead to vasculopathy and caused focal hypoperfusion [9-10]. We assumed that abnormal perfusion may be attributed to compensation for injury or ischemia. A negative correlation was observed between MK and SLEDAI scores, ds-DNA antibody indicated high disease activity and the antibody titer probably aggravates brain lesions.Conclusion
Abnormal microstructural and microvascular damages were detected in non-NPSLE patients by DKI and pCASL. And MK alteration seems to be more sensitive and helpful in depicting SLE patients without central nervous system symptoms.Acknowledgements
This study was supported by Startup Found for scientific research, Fujian Medical University (Grant number2019QH1210).References
[1]. Ercan, E., Magro-Checa, C., Valabregue, R., Branzoli, F., Wood, E. T., Steup-Beekman, G. M., et al. (2016). Glial and axonal changes in systemic lupus erythematosus measured with diffusion of intracellular metabolites. Brain, 139(5), 1447–1457. doi: 10.1093/brain/aww031. Epub 2016 Mar 11. PMID: 26969685; PMCID: PMC5006250.
[2]. Hansen B, Lund TE, Sangill R, Jespersen SN. Experimentally and computationally fast method for estimation of a mean kurtosis. Magn Reson Med. 2013 Jun;69(6):1754-60. doi: 10.1002/mrm.24743. Epub 2013 Apr 15. Erratum in: Magn Reson Med. 2014 Jun;71(6):2250. PMID: 23589312.
[3]. Zhang Z, Wang Y, Shen Z, Yang Z, Li L, Chen D, Yan G, Cheng X, Shen Y, Tang X, Hu W, Wu R. The Neurochemical and Microstructural Changes in the Brain of Systemic Lupus Erythematosus Patients: A Multimodal MRI Study. Sci Rep. 2016 Jan 13;6:19026. doi: 10.1038/srep19026. PMID: 26758023; PMCID: PMC4725825.
[4]. Zhang H, Li Q, Liu L, Qu X, Wang Q, Yang B, Xian J. Altered Microstructure of Cerebral Gray Matter in Neuromyelitis Optica Spectrum Disorder-Optic Neuritis: A DKI Study. Front Neurosci. 2021 Dec 20;15:738913. doi: 10.3389/fnins.2021.738913. PMID: 34987355; PMCID: PMC8720872.
[5]. Bester M, Jensen JH, Babb JS, Tabesh A, Miles L, Herbert J, Grossman RI, Inglese M. Non-Gaussian diffusion MRI of gray matter is associated with cognitive impairment in multiple sclerosis. Mult Scler. 2015 Jun;21(7):935-44. doi: 10.1177/1352458514556295. Epub 2014 Nov 12. PMID: 25392318; PMCID: PMC4429046.
[6]. Steven, A. J., Zhuo, J. & Melhem, E. R. Diffusion kurtosis imaging: an emerging technique for evaluating the microstructural environment of the brain. Am J Roentgenol. 202, W26–W33 (2014)
[7]. Gasparovic, C. M., Roldan, C. A., Sibbitt, W. L. J., Qualls, C. R., Mullins, P. G., Sharrar, J. M., … Bockholt, H. J. (2010). Elevated cerebral blood flow and volume in systemic lupus measured by dynamic susceptibility contrast magnetic resonance imaging. The Journal of Rheumatology, 37(9), 1834–1843. https://doi.org/10.3899/jrheum.091276
[8]. Zhuo Z, Su L, Duan Y, Huang J, Qiu X, Haller S, Li H, Zeng X, Liu Y. Different patterns of cerebral perfusion in SLE patients with and without neuropsychiatric manifestations. Hum Brain Mapp. 2020 Feb 15;41(3):755-766. doi: 10.1002/hbm.24837. Epub 2019 Oct 24. PMID: 31650651; PMCID: PMC7268026.
[9]. Emmer BJ, Veer IM, Steup-Beekman GM, Huizinga TW, van der Grond J, van Buchem MA. Tract-based spatial statistics on diffusion tensor imaging in systemic lupus erythematosus reveals localized involvement of white matter tracts. Arthritis Rheum. 2010 Dec;62(12):3716-21. doi: 10.1002/art.27717. PMID: 20722009.
[10]. Jung RE, Caprihan A, Chavez RS, Flores RA, Sharrar J, Qualls CR, Sibbitt W, Roldan CA. Diffusion tensor imaging in neuropsychiatric systemic lupus erythematosus. BMC Neurol. 2010 Jul 28;10:65. doi: 10.1186/1471-2377-10-65. PMID: 20667115; PMCID: PMC2919505.
[11]. Schmidt-Wilcke T, Cagnoli P, Wang P, Schultz T, Lotz A, Mccune WJ, Sundgren PC. Diminished white matter integrity in patients with systemic lupus erythematosus. Neuroimage Clin. 2014 Jul 10;5:291-7. doi: 10.1016/j.nicl.2014.07.001. PMID: 25161895; PMCID: PMC4141982.
Figures