2469
Automated Deep Learning Segmentation of Human Knee Cartilage from 3T MRI with Boundary Information1Department of Bioengineering, Imperial College London, London, United Kingdom
Synopsis
Keywords: Osteoarthritis, Segmentation
Knee Osteoarthritis (OA) is serious and prevalent today. Image segmentation of high-resolution MRI scans measuring cartilage volume and thickness is useful to track knee OA progression in the early stages and avoid joint replacement. In this work, we developed a cheap and efficient automated technique based on U-Net for knee cartilage segmentation, paying more attention to boundary information. Our model outperforms many existing models for segmentation of the femoral cartilage and performs as well as other techniques for other cartilage compartments. The boundary loss appears to improve cartilage segmentation for the edge slices with smaller cartilage volume.Introduction
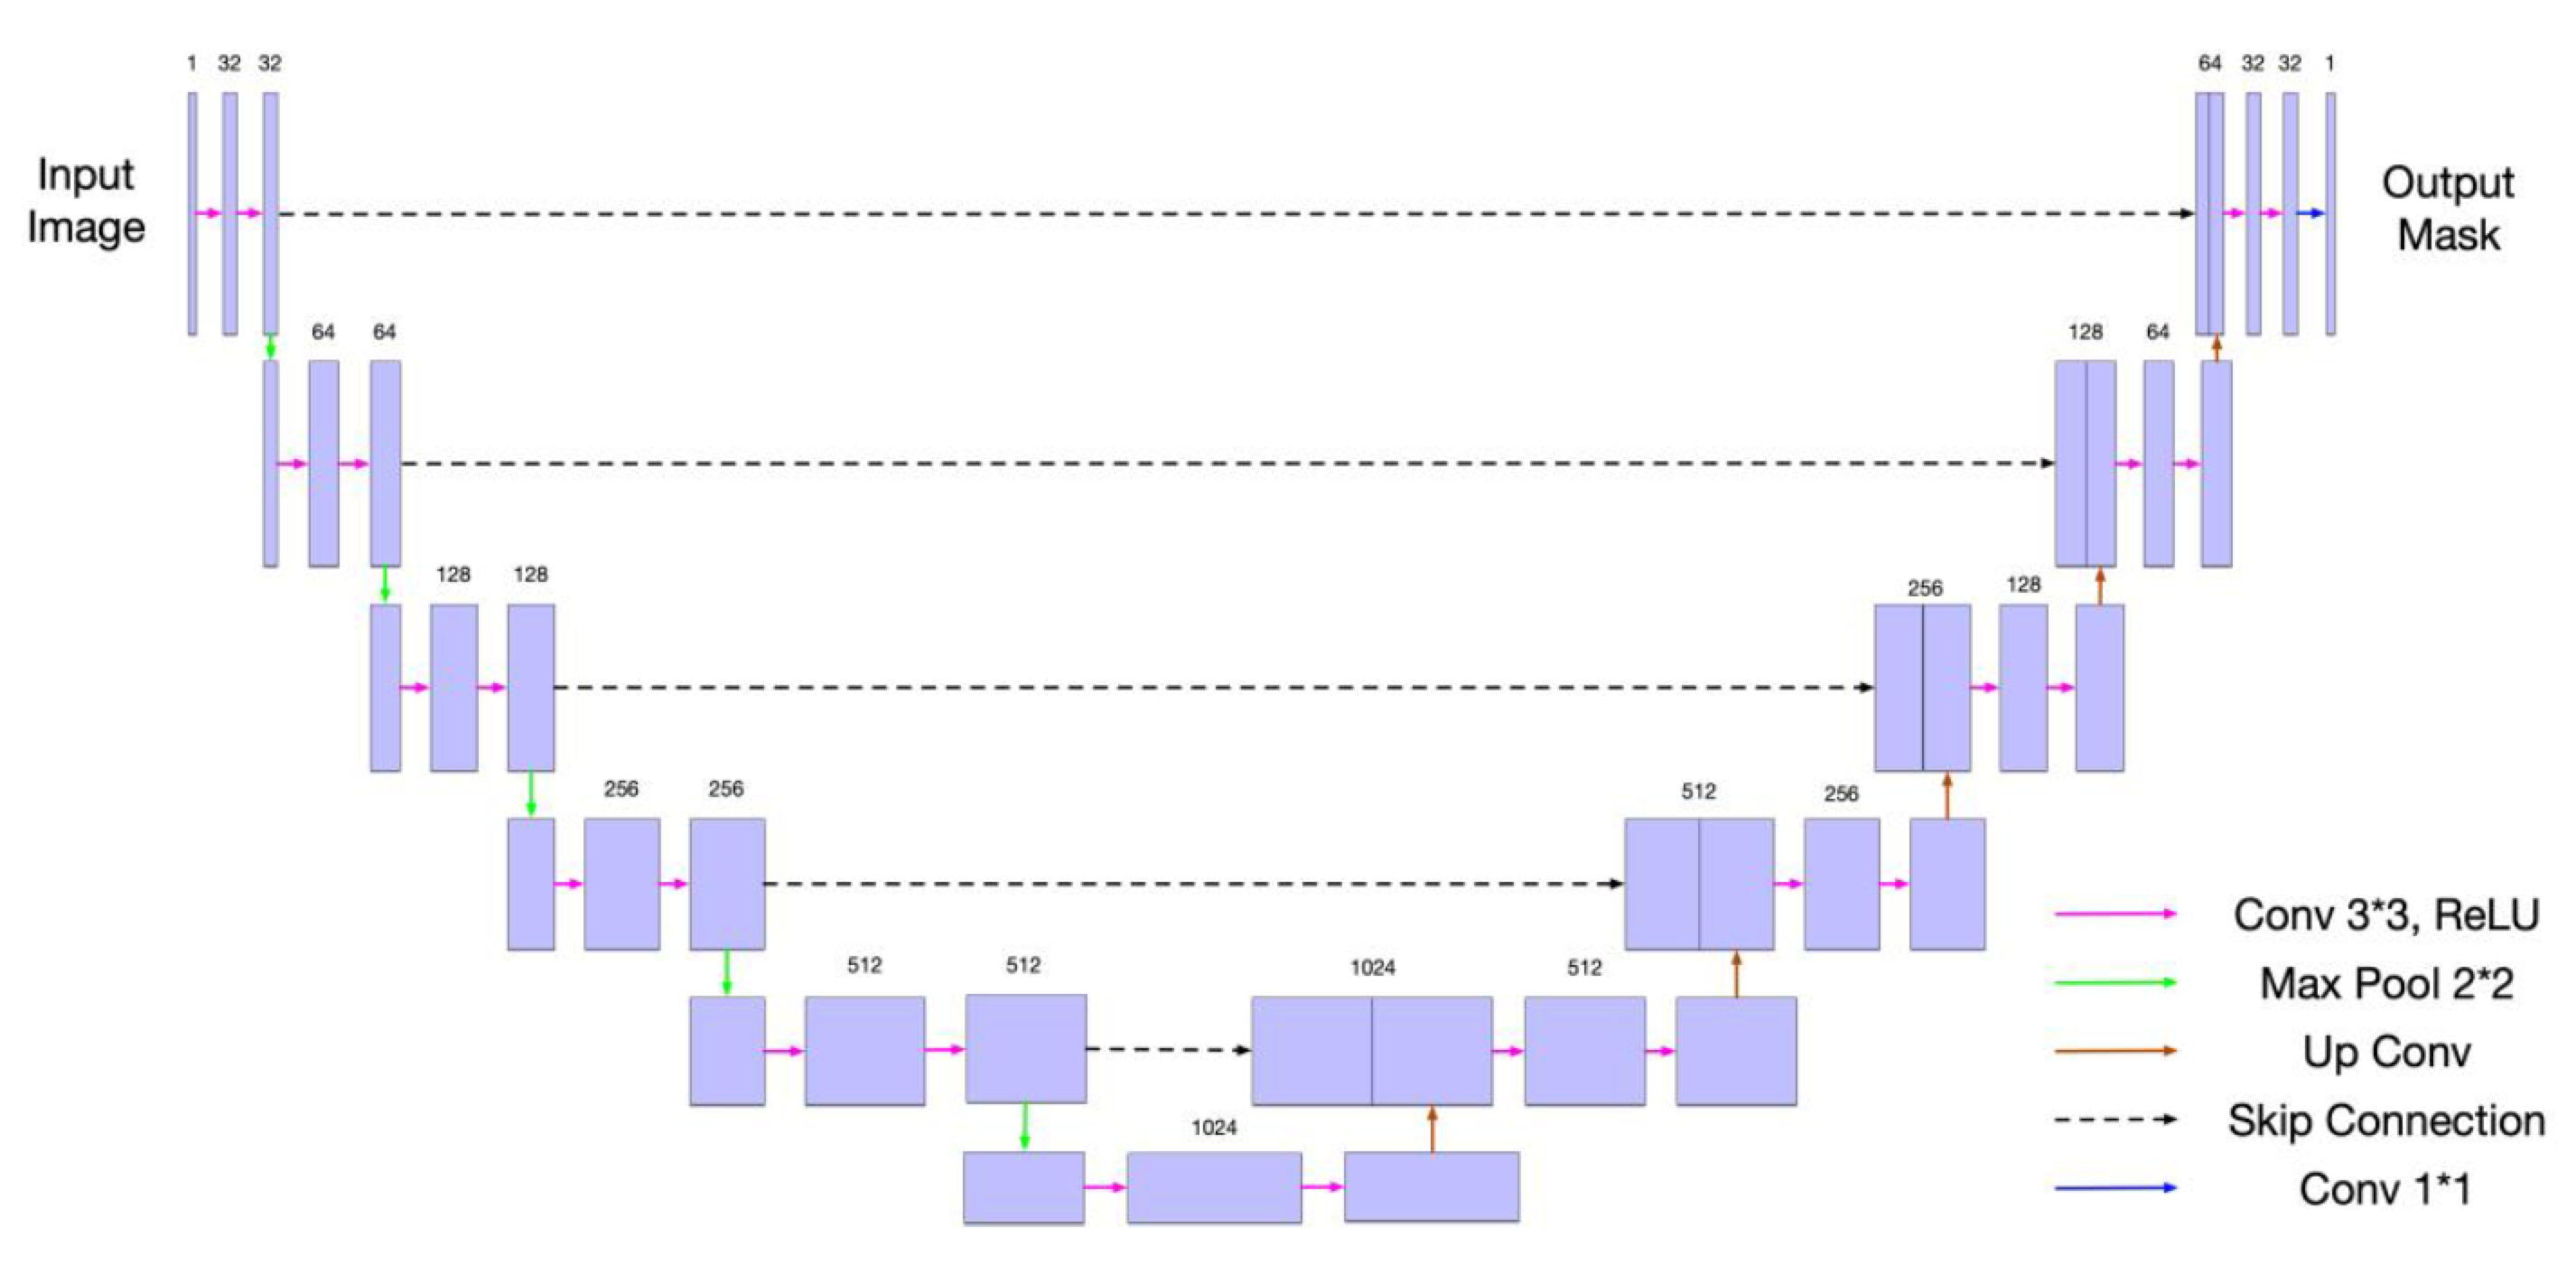
Knee Osteoarthritis (OA) is a serious health problem and imposes a large burden on the health system [1][2]. Currently the gold-standard approach for OA detection is radiography, but this detects OA in the late stages [3][4]. Often the clinical treatment endpoint for OA is joint replacement, which is highly invasive and prone to degradation over time. Image segmentation of 3D scans is useful to measure the cartilage volume and thickness and track progression in the early stages of OA [5]. Image segmentations have traditionally been done manually, which is costly and time consuming. Deep learning models [6-11] have recently demonstrated good results for automated knee cartilage segmentation, and the U-Net architecture [12] is widely used. We employed a 2D U-Net (shown in Figure 1) as the basic architecture for our network with input 2D slices in the sagittal plane because our preliminary results show the sagittal plane obtained the best segmentation results among all planes. We noted that there were usually mistakes in the boundary region of the cartilage mask. To reduce these mistakes, we added a boundary loss onto the 2D U-Net. Dice Similarity Coefficient (DSC) [13] was used as the evaluation metric in the experiments. The higher the DSC, the better the segmentation results.Method
Binary Cross-Entropy loss [14] and Dice Loss (calculated by 1-DSC) used in our model have been widely used for binary classification tasks. We tried to incorporate boundary information in the cartilage by applying a boundary loss to improve the results. Kervadec et al. first applied boundary loss for brain lesion segmentation tasks [15]. We incorporated this boundary loss in our model as follows: $$L_B=\int_{\Delta S} \phi_G (q)p(q)dq, \tag{1}$$ where $$$q$$$ is a voxel within the region between the two boundaries ($$$\Delta S$$$), $$$\phi_G$$$ denotes the signed distance map of boundary $$$\partial G$$$: $$$\phi_G (q)=-D_G (q)$$$ if $$$q$$$ is inside region $$$G$$$, otherwise $$$\phi_G (q)=D_G (q)$$$ ($$$D_G$$$ demonstrates the Euclidean distance between point $$$q$$$ and its nearest point $$$z_{\partial G}(q)$$$ on contour $$$\partial G$$$: $$$D_G= \Vert q-z_{\partial G}(q) \Vert_2$$$), and $$$p(q)$$$ is the output probability of the model. To show the difference between the prediction and the true label $$$g(q)$$$, this boundary loss can be more accurately written as: $$L_B=\int_{\Delta S} D_G(q)\left|p(q)-g(q)\right|dq. \tag{2}$$The IWOAI challenge dataset composed of 88 subjects with Kellgren-Lawrence grade OA between 1 to 4 scanned at two timepoints (baseline, 1 year) by 3T MRI was used in this project (176 in total, 120 for training, 28 for validation, and 28 for testing) [16]. To increase the amount of data, we performed data augmentation, including slight rotation to the knee and randomly cropping those 384x384 rotated slices down to 300x300. In this way, the human knee was moved off the original location on the slice plane to be consistent with slight locational variation in MRI scanning. We also removed the edge slices containing no cartilage masks from the training dataset.
Results
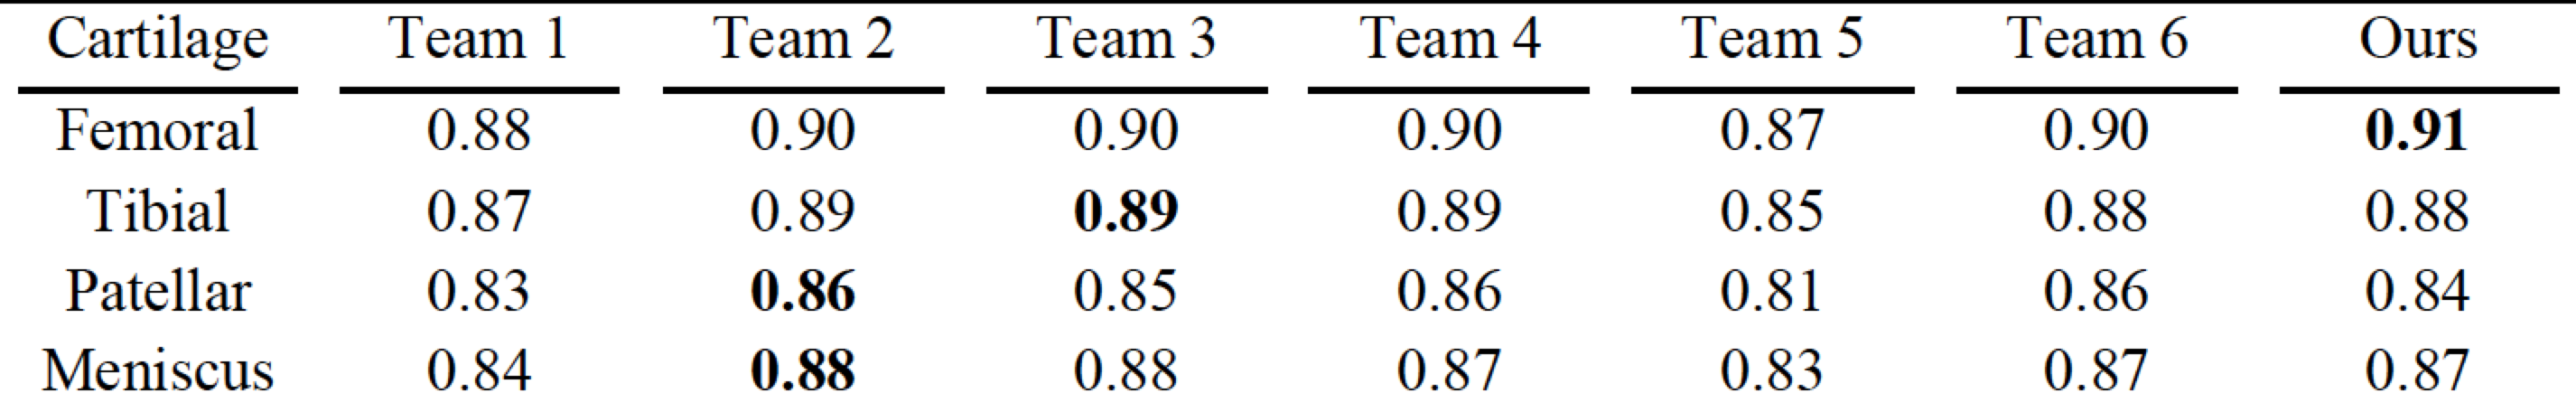
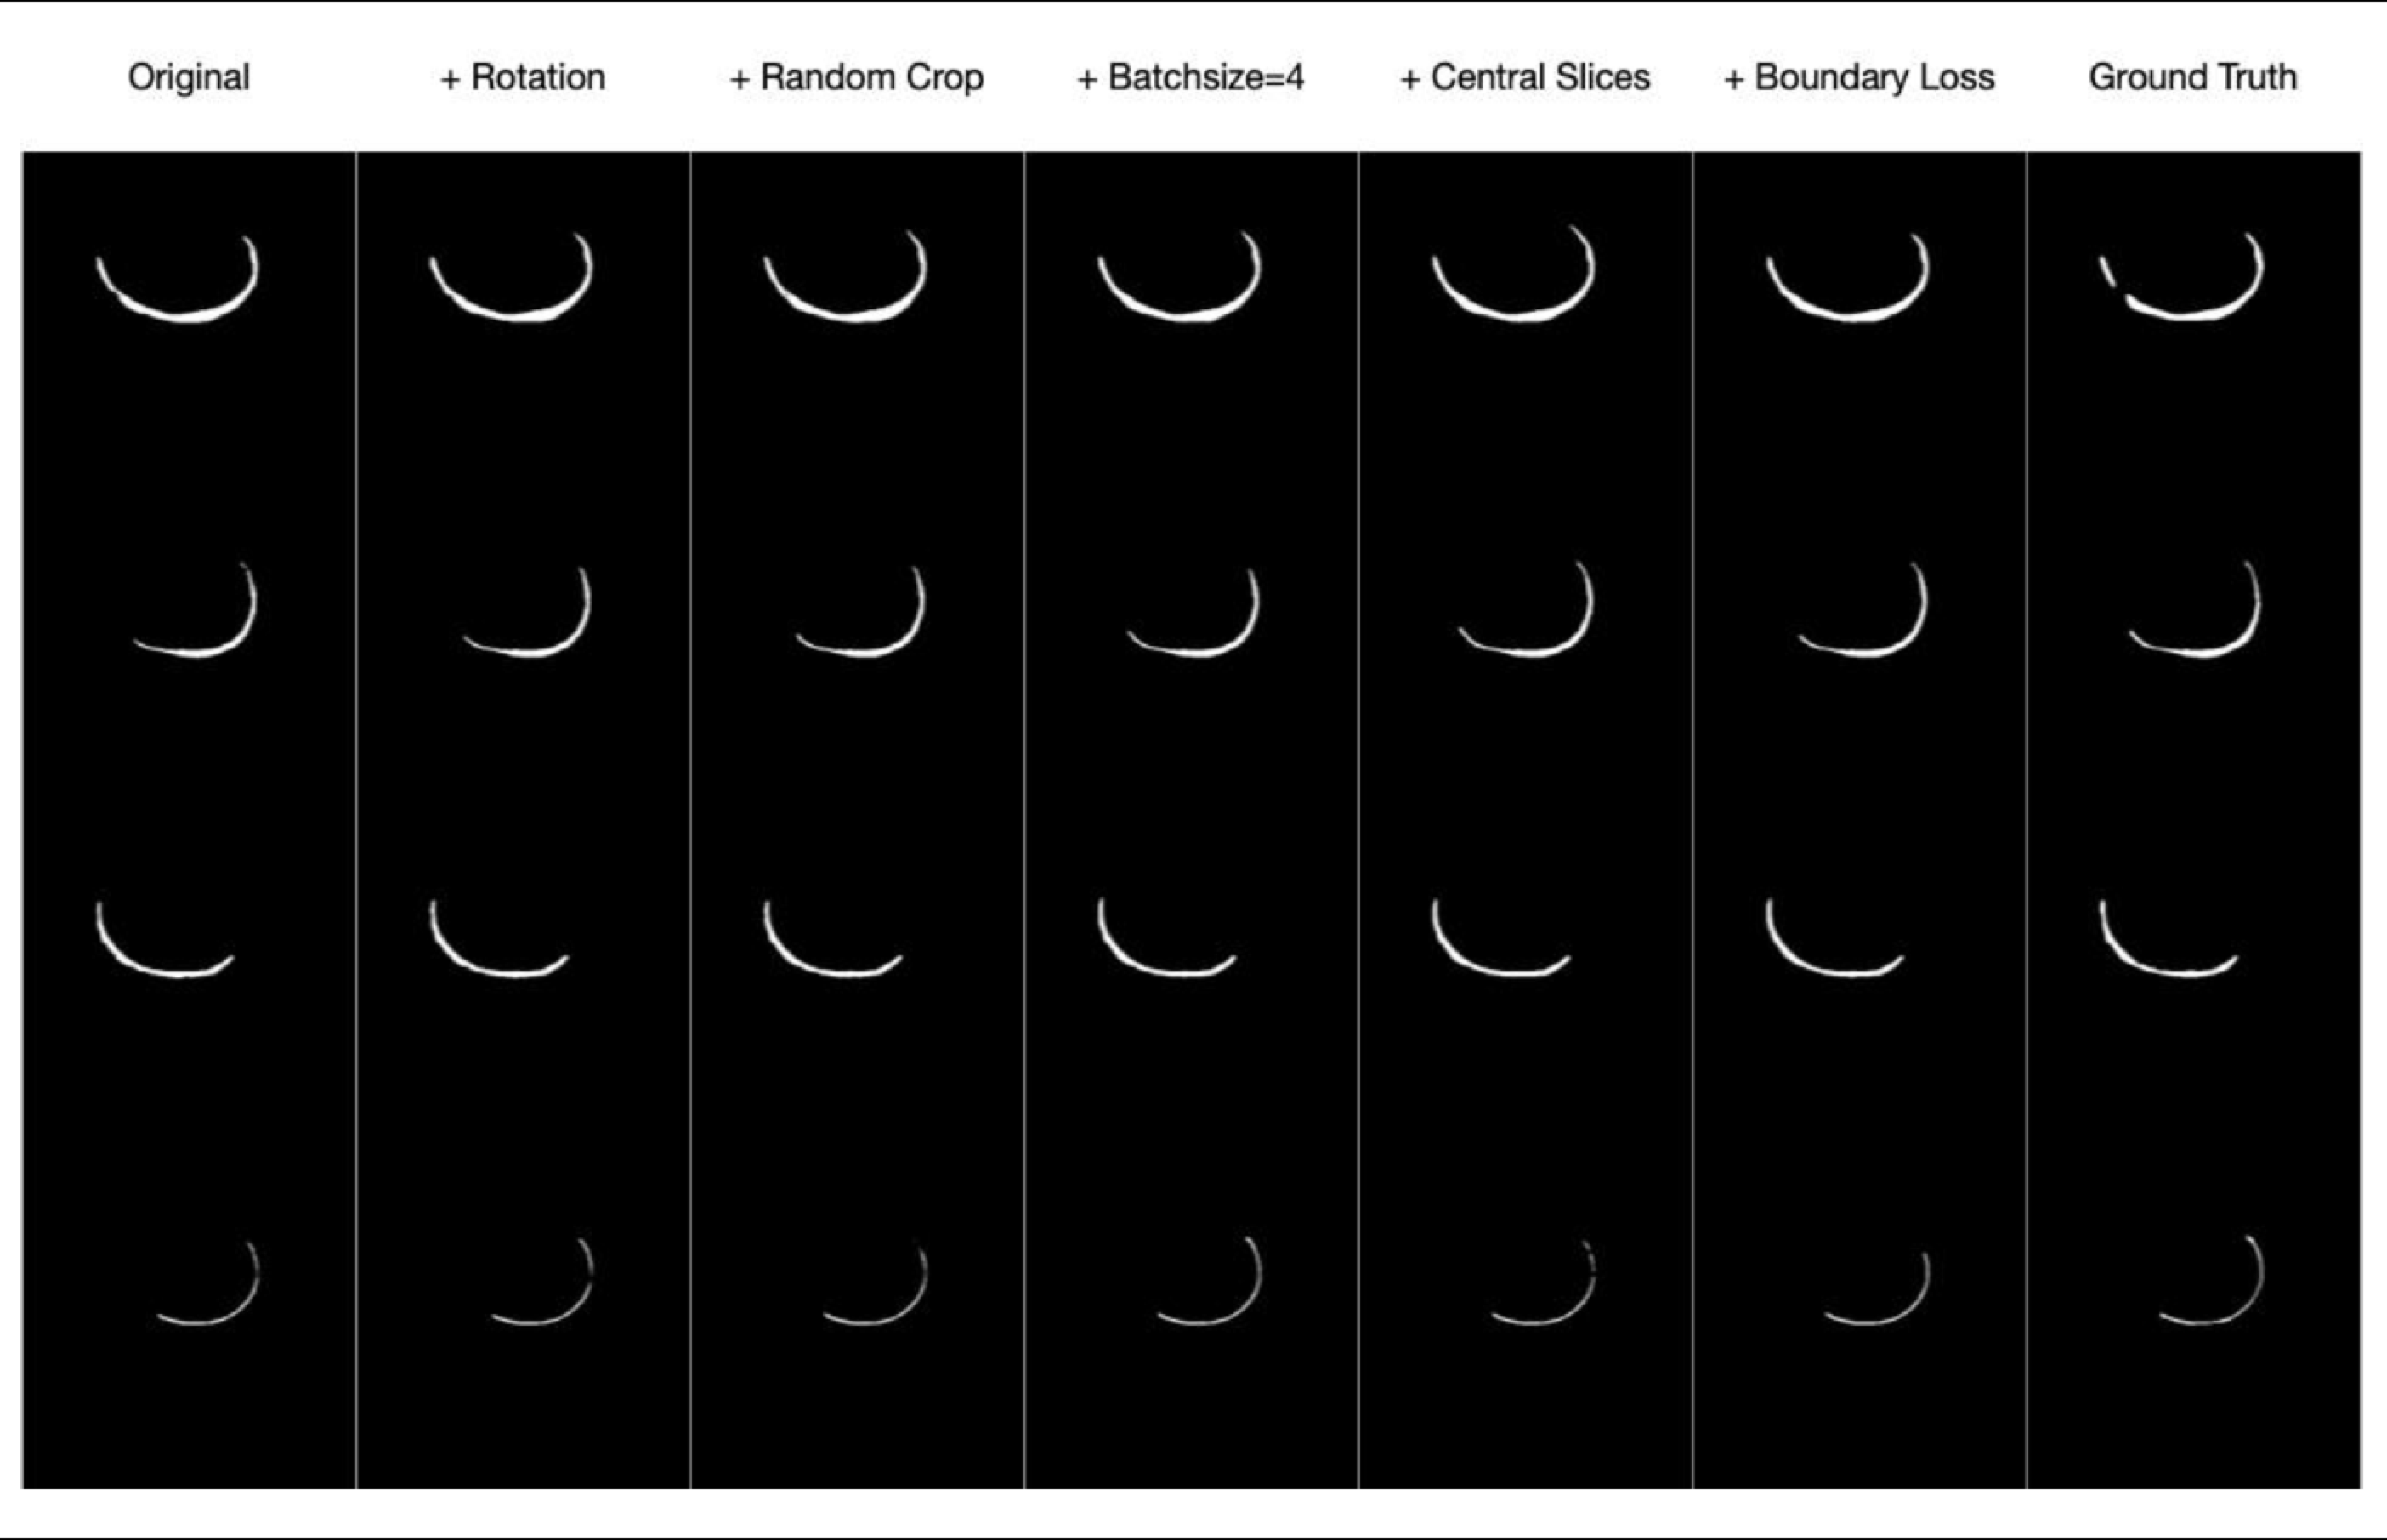
We compared our results with other models trained with the IWOAI dataset and published as part of the IWOAI Knee Segmentation Challenge described in [16]. We can see from the quantitative comparisons in Table 1 that our model outperforms the others on femoral cartilage segmentation and performs as well as other models (although not the best) while segmenting other cartilage compartments.We implemented multiple modifications to a basic U-Net architecture, as illustrated in Table 2 and Figure 2. We also explored the effect of boundary loss on each 2D sagittal slice with the evaluation calculated by average 2D DSC (Table 3). Although the segmentation results were improved with these modifications, training only on central slices can worsen the result of segmentation while using 2D DSC as the evaluation metric. The boundary loss can compensate for this negative effect.
Discussion
Our model is able to outperform the other networks (Table 1) in [16] while training on femoral cartilage as shown by the higher DSC (0.91). When training on other cartilage compartments, our model performs as well as the others, but not the best. This is probably because we have made all the modifications while training on femoral cartilage at first, or the cropping region for other cartilages may not be chosen as the best.Data augmentation approaches can improve the performance (higher DSC from 0.847 to 0.908 as shown in Table 2) at each of the modification steps. As Table 3 shows, however, the quantitative result of 2D DSC while training only on central slices becomes lower (0.911 to 0.898). Given that the slices with smaller cartilage areas account for more of the 2D DSC than 3D DSC because of different calculations, we can attribute this worse result to the lower performance on edge slice segmentation. The boundary loss compensates for this (0.907), which suggests that this loss function may help with edge slice segmentation. Figure 2 shows the same results qualitatively.
Conclusion
We demonstrated that a U-Net model which incorporates boundary information can automatically perform image segmentation tasks with comparable or better accuracy than other published automated methods, especially when segmenting edge slices. Better automated techniques for segmentation will be useful for clinical studies that assess OA progression from cartilage volume and thickness.Acknowledgements
I would like to sincerely give my thanks to all the following people:
My supervisor Dr Neal K Bangerter for providing much support and useful suggestions for the whole project.
Dr Peter J Lally for taking his time to give lots of great feedbacks to my writing work.
All other members in Dr Bangerter’s group for dealing with technical issues in the project.
Also, all the staff of Research Computing Service at Imperial College London for providing training resources for the project.
References
[1] Jin, Z., Wang, D., Zhang, H., Liang, J., Feng, X., Zhao, J., & Sun, L. (2020). Incidence trend of five common musculoskeletal disorders from 1990 to 2017 at the global, regional and national level: Results from the global burden of disease study 2017. Annals of the Rheumatic Diseases, 79(8), 1014–1022. https://doi.org/10.1136/annrheumdis-2020-217050
[2] David Zelman. (2021, June 14). Osteoarthritis of the knee (degenerative arthritis of the knee). WedMD.
[3] Kellgren, J. H., & Lawrence, J. S. (1958). Osteo-arthrosis and disk degeneration in an urban population. Annals of the Rheumatic Diseases, 17(4), 388.
[4] Guermazi, A., Roemer, F. W., Burstein, D., & Hayashi, D. (2011). Why radiography should no longer be considered a surrogate outcome measure for longitudinal assessment of cartilage in knee osteoarthritis. Arthritis research & therapy, 13(6), 1-11.
[5] Chaudhari, A. S., Kogan, F., Pedoia, V., Majumdar, S., Gold, G. E., & Hargreaves, B. A. (2020). Rapid knee MRI acquisition and analysis techniques for imaging osteoarthritis. Journal of Magnetic Resonance Imaging, 52(5), 1321-1339.
[6] Norman, B., Pedoia, V., & Majumdar, S. (2018). Use of 2D U-Net convolutional neural networks for automated cartilage and meniscus segmentation of knee MR imaging data to determine relaxometry and morphometry. Radiology, 288(1), 177-185.
[7] Folkesson, J., Dam, E. B., Olsen, O. F., Pettersen, P. C., & Christiansen, C. (2006). Segmenting articular cartilage automatically using a voxel classification approach. IEEE transactions on medical imaging, 26(1), 106-115.
[8] Prasoon, A., Igel, C., Loog, M., Lauze, F., Dam, E., & Nielsen, M. (2012, February). Cascaded classifier for large-scale data applied to automatic segmentation of articular cartilage. In Medical Imaging 2012: Image Processing (Vol. 8314, p. 83144V). International Society for Optics and Photonics.
[9] Koo, S., Hargreaves, B. A., Andriacchi, T. P., & Gold, G. (2008). Automatic segmentation of articular cartilage from MRI: a multi-contrast and multi-dimensional approach. In Proc. Intl. Soc. Mag. Reson. Med (Vol. 16, p. 2546).
[10] Prasoon, A., Petersen, K., Igel, C., Lauze, F., Dam, E., & Nielsen, M. (2013, September). Deep feature learning for knee cartilage segmentation using a triplanar convolutional neural network. In International conference on medical image computing and computer-assisted intervention (pp. 246-253). Springer, Berlin, Heidelberg.
[11] Kervadec, H., Bouchtiba, J., Desrosiers, C., Granger, E., Dolz, J., & Ayed, I. B. (2019, May). Boundary loss for highly unbalanced segmentation. In International conference on medical imaging with deep learning (pp. 285-296). PMLR.
[12] Ronneberger, O., Fischer, P., & Brox, T. (2015, October). U-net: Convolutional networks for biomedical image segmentation. In International Conference on Medical image computing and computer-assisted intervention (pp. 234-241). Springer, Cham.
[13] Dice, L. R. (1945). Measures of the amount of ecologic association between species. Ecology, 26(3), 297-302.
[14] Ruby, U., & Yendapalli, V. (2020). Binary cross entropy with deep learning technique for image classification. Int. J. Adv. Trends Comput. Sci. Eng, 9(10).
[15] Kervadec, H., Bouchtiba, J., Desrosiers, C., Granger, E., Dolz, J., & Ayed, I. B. (2019, May). Boundary loss for highly unbalanced segmentation. In International conference on medical imaging with deep learning (pp. 285-296). PMLR.
[16] Desai, A. D., Caliva, F., Iriondo, C., Khosravan, N., Mortazi, A., Jambawalikar, S., Torigian, D., Ellermann, J., Akcakaya, M., Bagci, U., Tibrewala, R., Flament, I., O`Brien, M., Majumdar, S., Perslev, M., Pai, A., Igel, C., Dam, E. B., Gaj, S., … Chaudhari, A. S. (2020). The International Workshop on Osteoarthritis Imaging Knee MRI Segmentation Challenge: A Multi-Institute Evaluation and Analysis Framework on a Standardized Dataset. http://arxiv.org/abs/2004.14003
Figures