2468
Generalizability of nnU-Net for automatic segmentation of knee MRI1Department of Radiology & Nuclear Medicine, Erasmus MC University Medical Center, Rotterdam, Netherlands, 2Department of Radiology, University of Wisconsin-Madison, Madison, WI, United States, 3Department of General Practice, Erasmus MC University Medical Center, Rotterdam, Netherlands
Synopsis
Keywords: Osteoarthritis, Segmentation
To investigate the generalizability of deep learning segmentation models, three different nnU-Nets (2D, 3D, and ensemble) were trained on the OAI dataset and tested on a different dataset. In addition to the nnU-Nets trained on the original OAI data, the style of the test set was transferred to the training set using a CycleGAN method and the nnU-Nets were trained again. Depending on the tissue, the 3D nnU-Net or the ensemble trained on the original or stylized training data had the highest segmentation accuracy in the test set. The results indicate that nnU-Net may generalize well to independent datasets.Introduction
An accurate segmentation is a vital part of a post-processing pipeline to extract quantitative imaging biomarkers for assessment of musculoskeletal diseases such as osteoarthritis on knee MRI. Deep learning-based methods are increasingly used for automatic segmentation of articular cartilage and bone1,2. nnU-Net is a deep learning-based segmentation method that automatically configures itself for specific tasks and has shown to perform well on many segmentation problems3. Deep learning segmentation methods trained on the double-echo steady-state (DESS) MRI scans of the Osteoarthritis Initiative (OAI)4 are commonly used in musculoskeletal research, due to the public availability of the annotated MRI scans. However, the generalizability of deep learning methods for knee MRI segmentation on independent datasets with varying MRI vendors, sequences, and study populations has not yet been widely assessed. Therefore, the aim of this study was to investigate the generalizability of OAI trained nnU-Net models on a dataset that was acquired with a different MRI scanner and sequence and has a different study population than OAI.Methods
The OAI dataset4 was used for training and validation of the nnU-Net models in this study. 3D DESS MRIs with manual segmentations of femoral and tibial bone and cartilage of 507 knees (OAI ZIB dataset2) were utilized. The OAI ZIB dataset consisted of 507 participants (48% female) with a mean age of 61.9 (SD: 9.3) years and a mean BMI of 29.3 (SD: 4.5) kg/m2. The knees were scanned using 3-T scanners (Magnetom Trio, Siemens Medical Solutions) with a DESS sequence (field of view: 14 cm, in-plane resolution: 0.36 mm x 0.36 mm, slice thickness: 0.7 mm, echo time: 5 ms, repetition time: 16 ms, and 160 slices).Manual segmentations of femoral and tibial bone and cartilage of five knees from the TripleP study5 were used as a test set in this study. The test set consisted of five participants (80% female) with a mean age of 23.2 (SD: 5.9) years and a mean BMI of 24.7 (SD: 4.1) kg/m2. The knees in the test set were scanned using a 3-T scanner (Discovery MR750, GE Healthcare) with a 3D spoiled gradient recalled echo (SPGR) sequence (field of view: 15 cm, in-plane resolution: 0.29 mm x 0.29 mm, slice thickness: 0.5 mm, echo time: 5.4 ms, repetition time: 17 ms, and 216 slices).
Three different nnU-Net configurations, a 2D nnU-Net, a 3D nnU-Net, and an ensemble of those two, were trained on the OAI ZIB data using 5-fold cross-validation. The 5 models resulting from training on 5 individual folds were subsequently used as an ensemble to segment the knees in the test set. As there was a distributional shift between training and test images, a Cycle-Consistent Adversarial Network (CycleGAN)6 was used to transfer the style of the test set to the training set and the three aforementioned nnU-Net models were trained again. In addition, the style of the training set was transferred to the test set and the performance of three baseline nnU-Nets were tested on the stylized test set. The CycleGAN was trained using randomly selected 5000 OAI ZIB slices and 5000 test set slices.
To assess the accuracy of the automatic segmentation, the Dice similarity coefficient (DSC) and average symmetric surface distance (ASSD) were determined.
Results
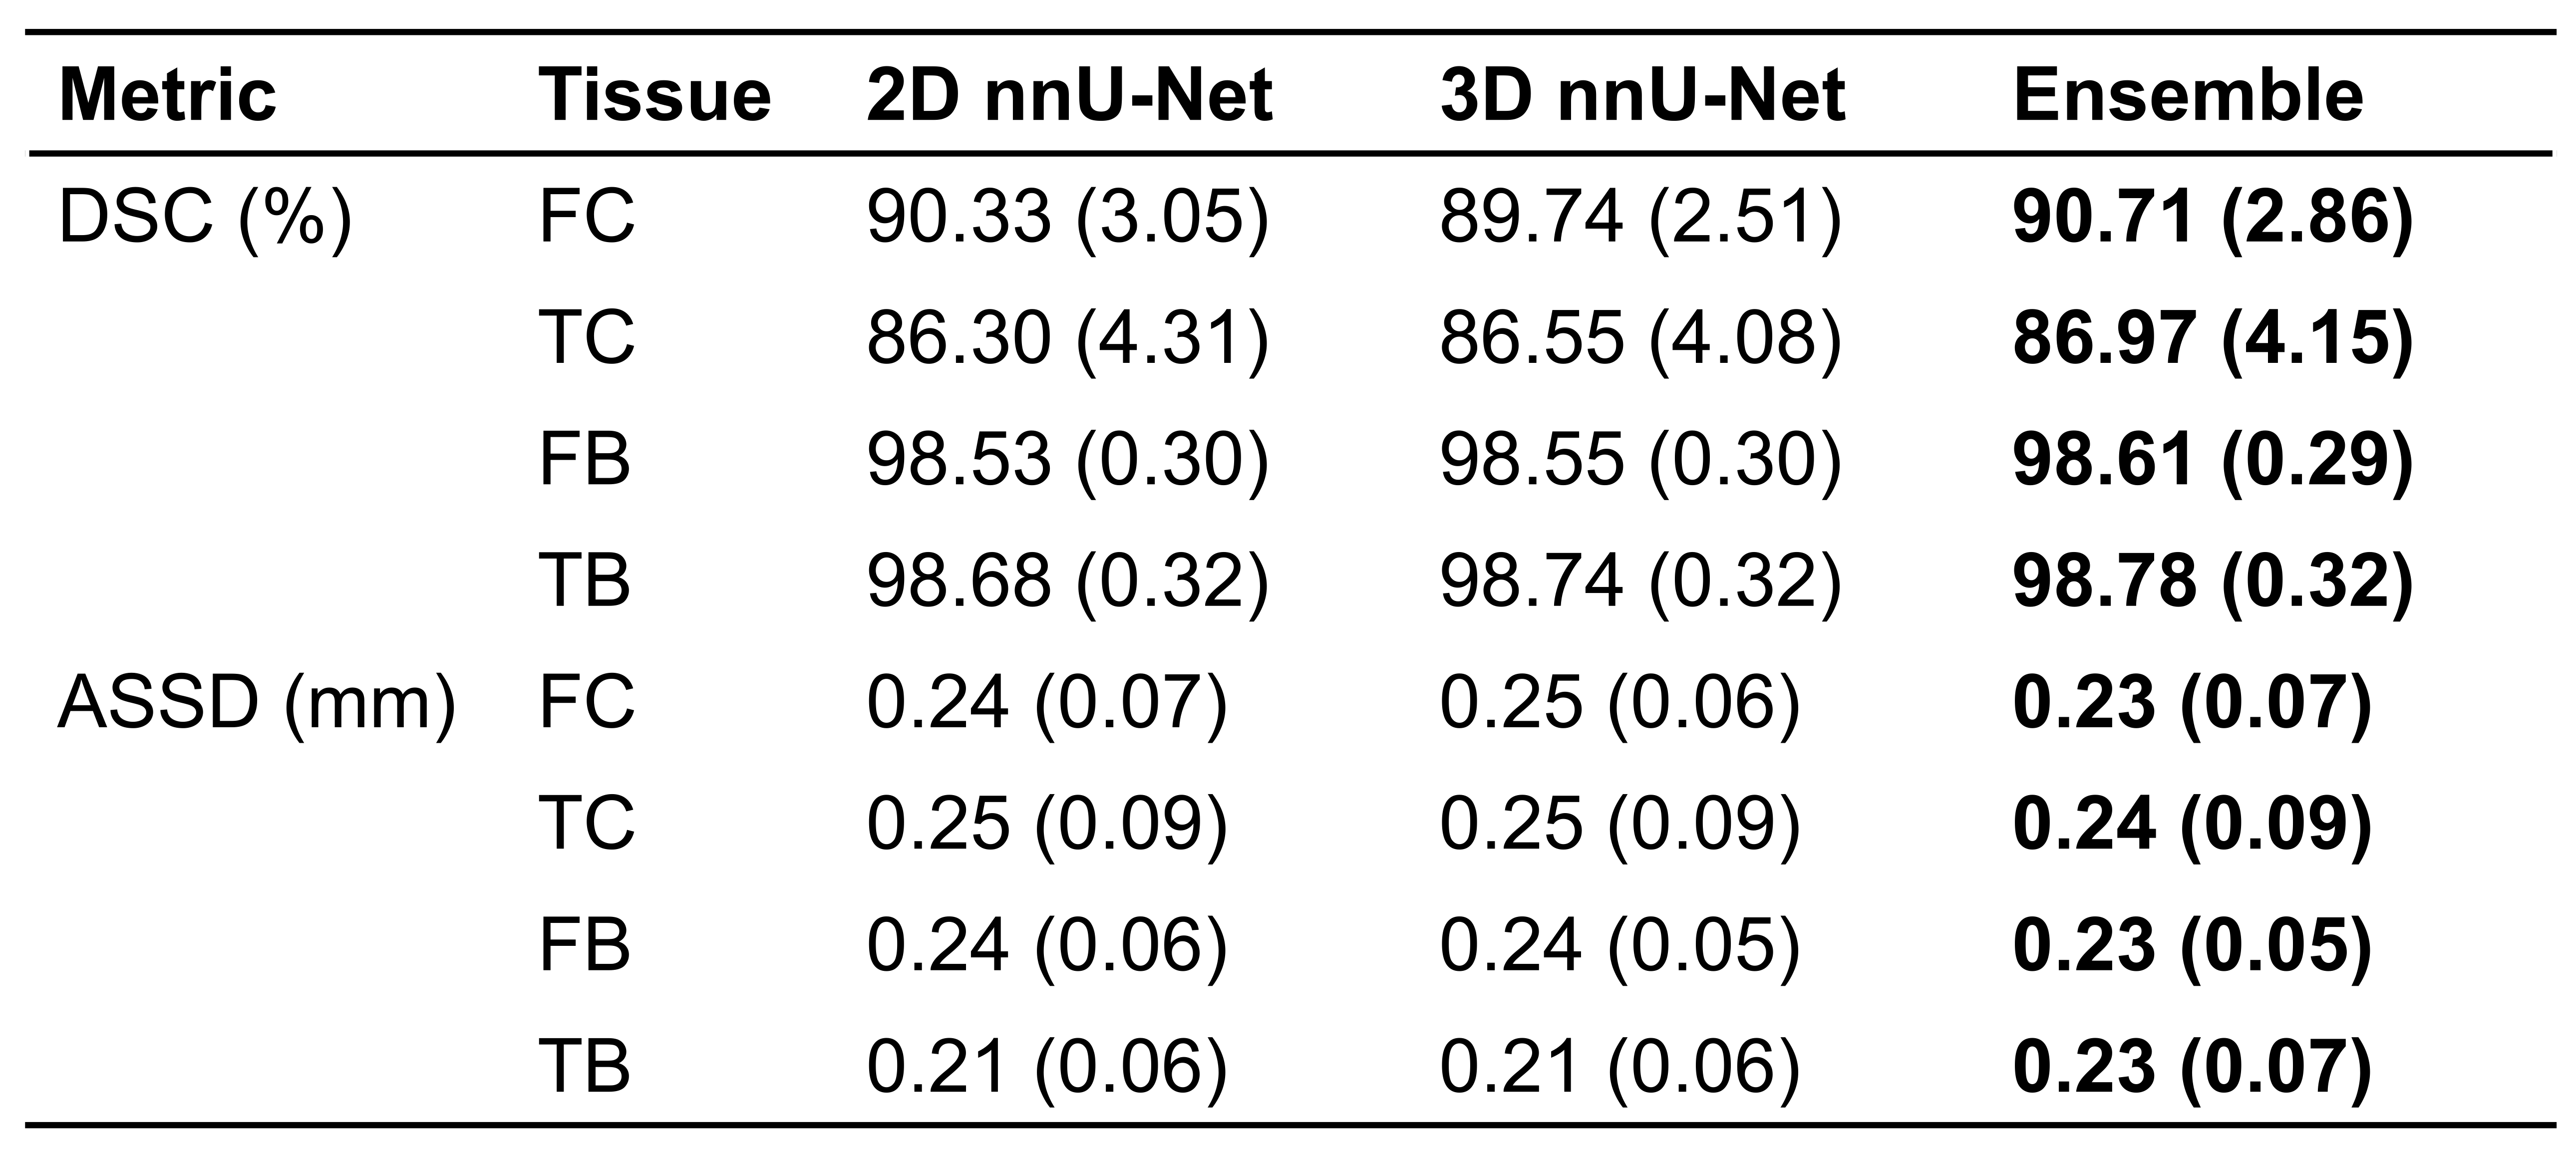
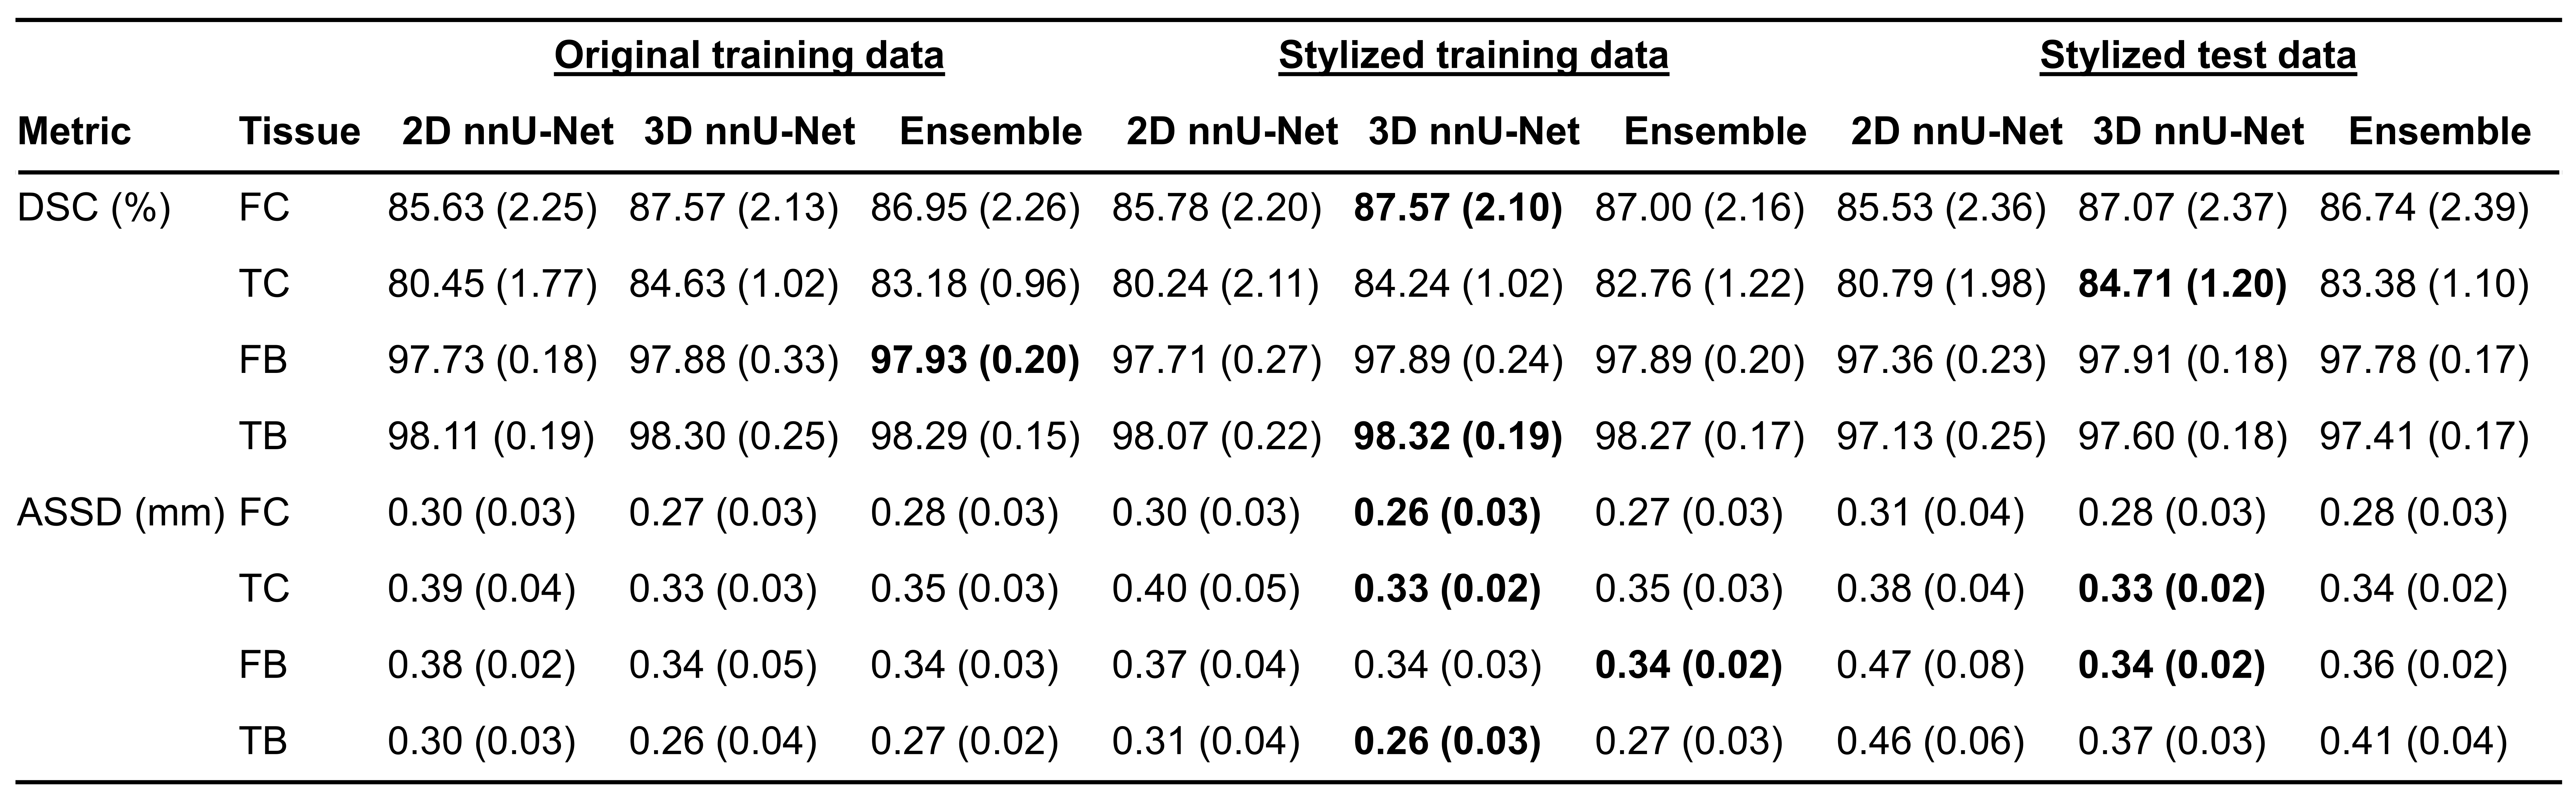
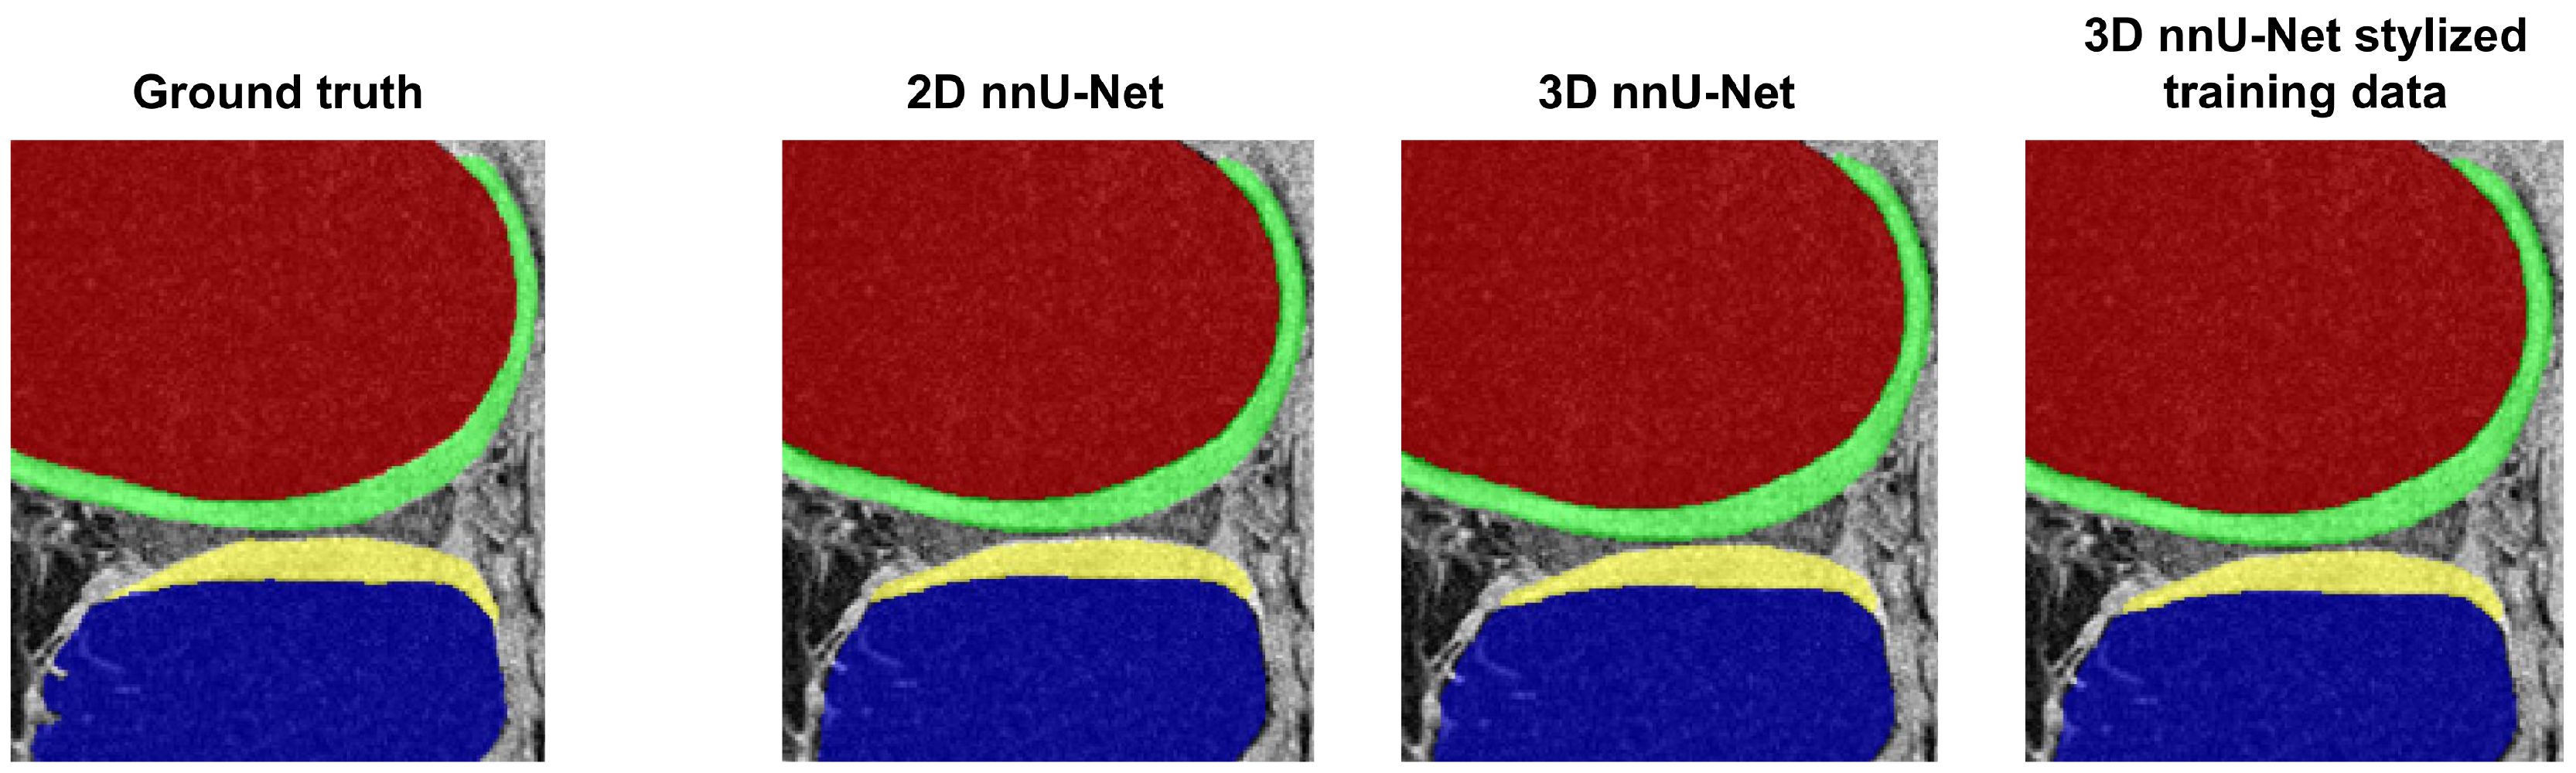
In the validation set, the ensemble nnU-Net had the highest DSC and lowest ASSD for each tissue (DSC range: 87.0 – 98.8, ASSD range: 0.20 – 0.24) (Table 1).In the test set, the highest DSC for segmentation of each tissue varied from 84.7% to 98.3% and lowest ASSD varied from 0.26 mm to 0.34 mm (Table 2). The ensemble nnU-Net had the highest DSC for segmentation of the femoral bone (97.9%), the 3D nnU-Net trained on the stylized training set had the highest DSC for segmentation of the tibial bone (87.6%) and the femoral cartilage (87.6%), and the 3D nnU-Net tested on the stylized test set had the highest DSC for segmentation of the tibial cartilage (84.7%). Examples of automatically segmented tissues on the test set using the 2D nnU-Net and the 3D nnU-Net trained on the original data and the 3D nnU-Net trained on the stylized training data are shown in Figure 1.
Discussion
The ensemble nnU-Net model had the highest segmentation accuracy in the OAI validation set. Depending on the tissue, the 3D nnU-Net or the ensemble trained on the original or stylized OAI training data had the highest segmentation accuracy in the external test set. Based on the metrics and visual evaluation, the 2D nnU-Nets seem to undersegment parts of the tibial cartilage. Compared to previous studies, equally good or better segmentation performance was obtained with the nnU-Nets1,4. The results on the test set suggest that the 3D nnU-Net trained on the stylized training data has the highest accuracy in segmentation of the most of the studied tissues. However, the differences in the segmentation accuracy were small especially between the 3D nnU-Nets.Conclusion
The results of this study indicate that nnU-Net generalizes to an independent dataset that was acquired with a different MRI scanner and sequence and has a different study population than the training dataset.Acknowledgements
No acknowledgement found.References
[1] Desai AD, Caliva F, Iriondo C, et al. The International Workshop on Osteoarthritis Imaging Knee MRI Segmentation Challenge: A Multi-Institute Evaluation and Analysis Framework on a Standardized Dataset. Radiol Artif Intell. 2021;3(3):e200078.
[2] Ambellan F, Tack A, Ehlke M, Zachow S. Automated segmentation of knee bone and cartilage combining statistical shape knowledge and convolutional neural networks: Data from the osteoarthritis initiative. Med Image Anal. 2019;52:109-118.
[3] Isensee F, Jaeger PF, Kohl SAA, Petersen J, Maier-Hein KH. nnU-Net: a self-configuring method for deep learning-based biomedical image segmentation. Nat Methods. 2021;18(2):203-211.
[4] Peterfy CG, Schneider E, Nevitt M. The osteoarthritis initiative: report on the design rationale for the magnetic resonance imaging protocol for the knee. Osteoarthritis Cartilage. 2008;16(12):1433-1441.
[5] van der Heijden RA, Oei EH, Bron EE, et al. No Difference on Quantitative Magnetic Resonance Imaging in Patellofemoral Cartilage Composition Between Patients With Patellofemoral Pain and Healthy Controls. Am J Sports Med. 2016;44(5):1172-8
[6] J-Y Zhu, T Park, P Isola, AA Efros. Unpaired Image-to-Image Translation using Cycle-Consistent Adversarial Networks. In: Proc. IEEE Int. Conf. Comput. Vis. (ICCV). 2017:2223-2232.
Figures