2467
QRAPMASTER for Quantitative evaluation of knee cartilage: ready for clinical daily practice?1The First Hospital of Jilin University, Changchun, China, 2Radiology, The First Hospital of Jilin University, Changchun, China, 3MR Scientific Marketing, Diagnostic Imaging, Siemens Healthineers Ltd, Beijing, China, 4Radiology, The First Hospital of Jilin University, changchun, China
Synopsis
Keywords: Cartilage, MSK
Quantitative MRI assigns absolute quantification of T1,T2 and PD based on tissue characteristics, such as the T2 metric values a surrogate marker for cartilage collagen integrity. The QRAPMASTER technology enables inline generation of quantitative T1maps and T2 maps and scans of high image quality, representing a promising synthetic MRI option that appears clinically feasible and may eventually facilitate the time neutral acquisition of quantitative T1 maps, T2 maps in the knee MRI.Introduction
Knee pain affects approximately 25 % of adults, limits function and mobility, and impairs life quality (1). Based on the structural and contrast abnormalities of MR images, many diseases can be diagnosed, such as ligament fibers rupture, meniscal tissue tear, and articular cartilage substance defects (2). However, specific states of disease, such as early articular cartilage degeneration and healing after cartilage restoration, may escape detection with morphologic MRI.T1 and T2 relaxation times are physiological tissue property which reflect cartilage collagen integrity(3,4). “Quantification of Relaxation Times and Proton Density by Multi echo acquisition of a saturation-recovery using Turbo spin-Echo Readout” (QRAPMASTER) is a novel method, which generates multiple contrast images and absolute quantification of relaxation time within a single scan. QRAPMASTER collects four reverse times and two echoes to obtain the T1map, T2 map and PD map(5). An important feature of QRAPMASTER method is that T1 and T2 maps are measured independently at the same location, so there is no error propagation between them, and registration is not required. In addition, based on these quantization parameters, it can generate many contrasts, such as T1WI, T2WI, PDWI, etc. The concomitant T1, PD and T2 maps are generated by inversion recovery methods with different inversion times and multi echo spin echo methods with different TE fitting, respectively. The purpose of this study was to characterize articular cartilage using T1 and T2 maps generated from QRAPMASTER based on multiple-dynamic multiple echo (MDME) sequence in a clinical setting.Methods
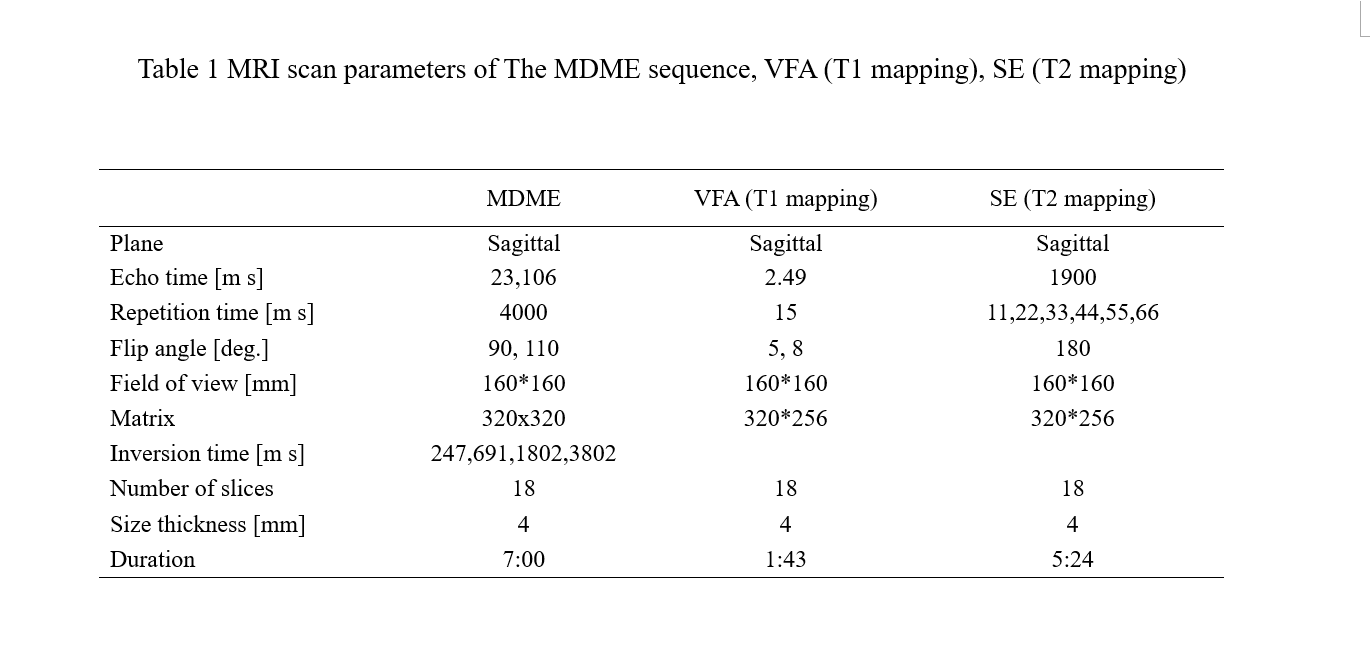
The study was approved by the local IRB, and written informed consent was obtained from all subjects. A total of 10 volunteers were examined on a 3T MRI scanner (MAGNETOM Vida, Siemens Healthcare, Erlangen, Germany) with a dedicated knee coil. Reference scanning including sagittal 2D T1WI, B1 inhomogeneity-corrected variable flip angle (VFA) T1mapping and spin echo T2mapping were performed with the detail imaging parameters as shown in Table1. Quantitative image analysis (reference scan VBF T1mapping and SE T2mapping vs synthetic T1, T2mapping) was performed by three radiologists with more than 5 years of experience. ROIs were placed on muscle (gastrocnemius muscle), fat pad, and cartilage. Based on the ROIs, value of T1/T2mapping, signal-to-noise ratio (SNR) and contrast-to-noise ratio (CNR) were analyzed for objective evaluation. All numerical values were reported as the mean ± SD. We used a paired t-test to compare the value, SNR, and CNR with the common and synthetic sequences. Statistical significance was defined as a p-value less than 0.05.Results
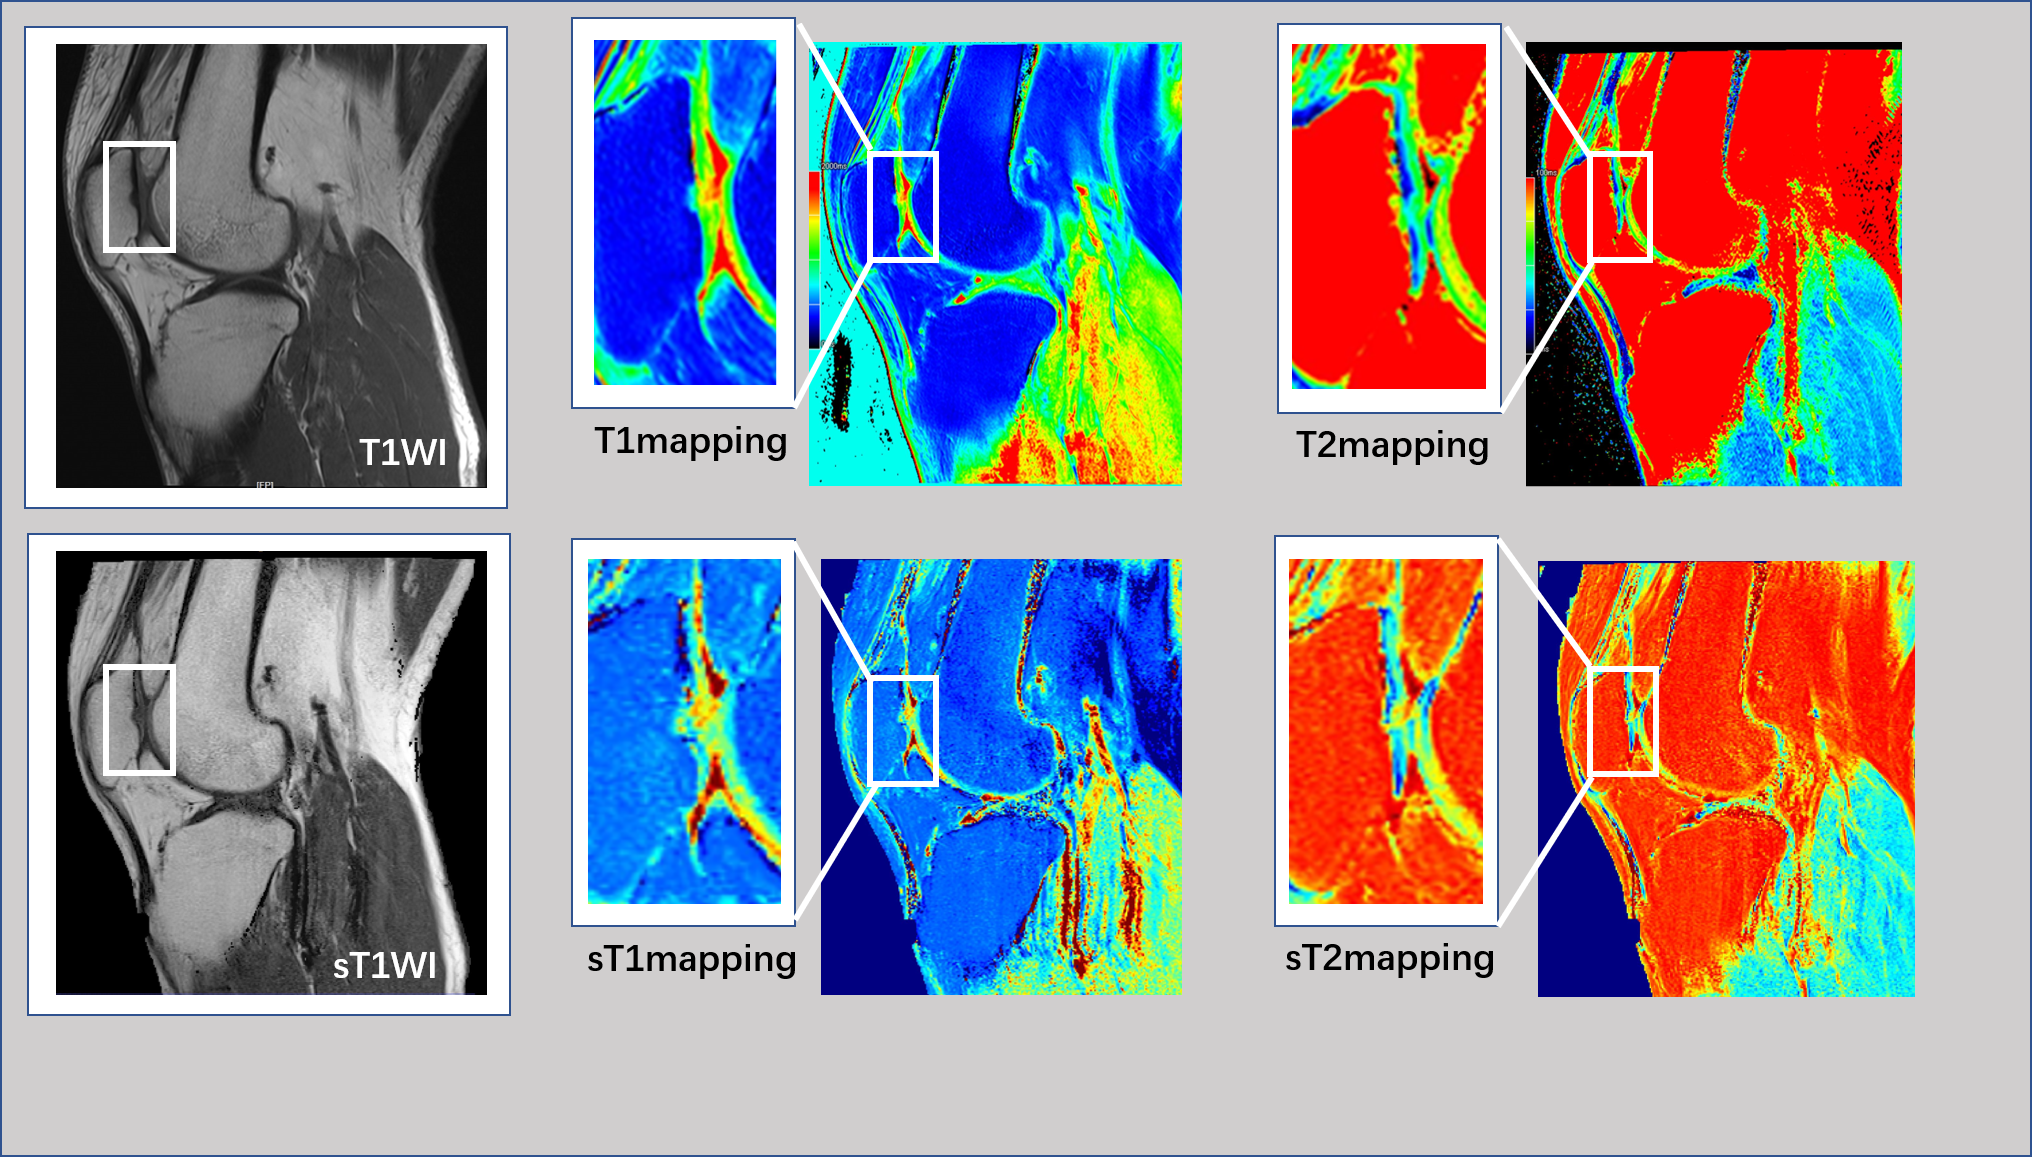
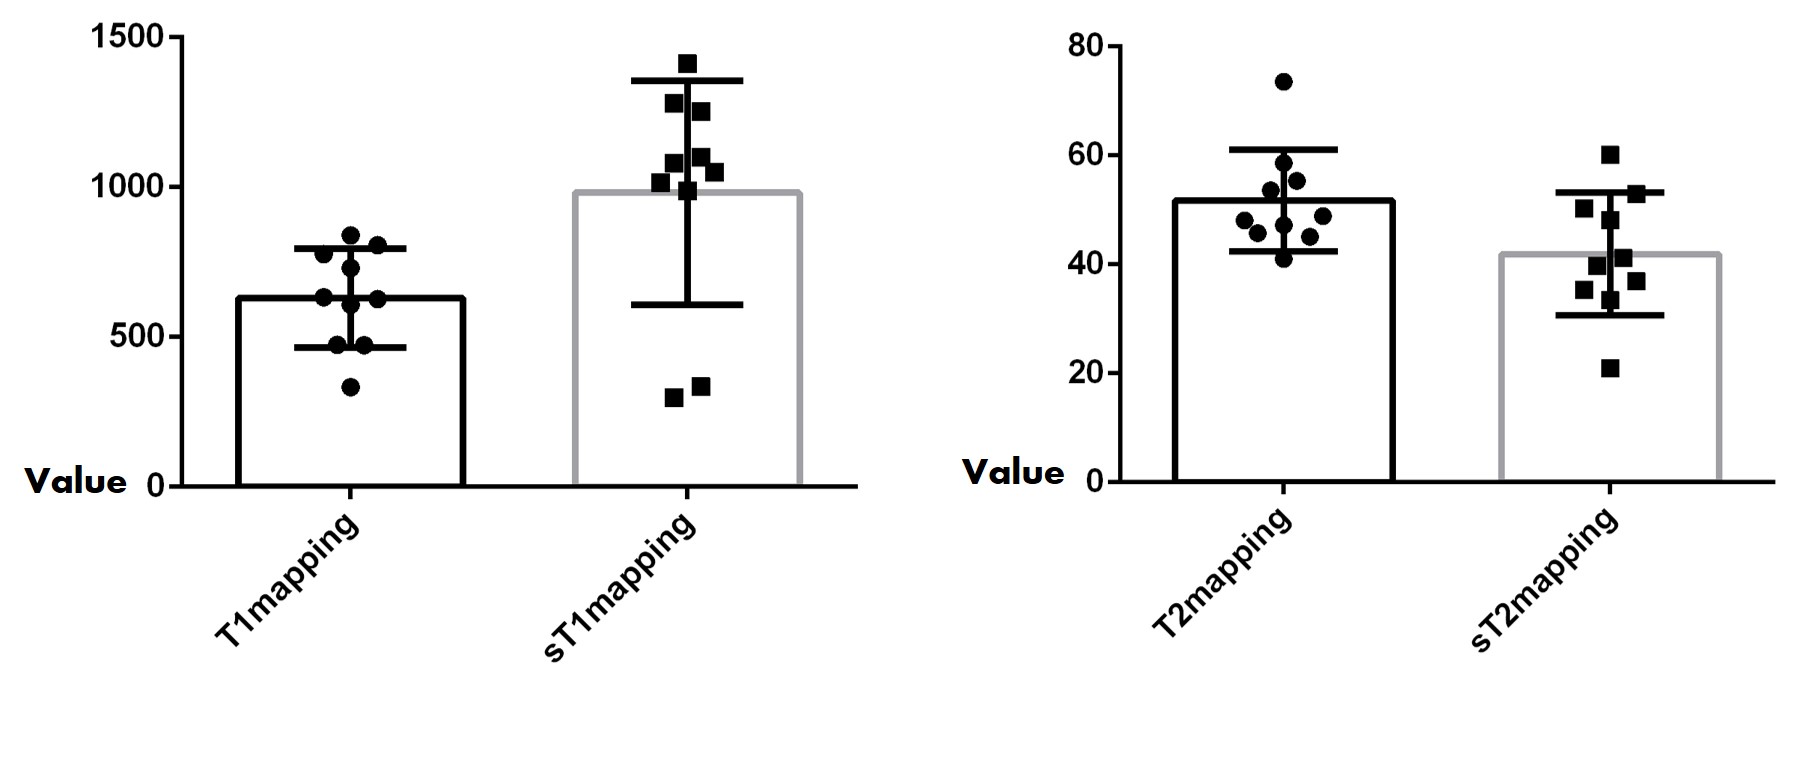
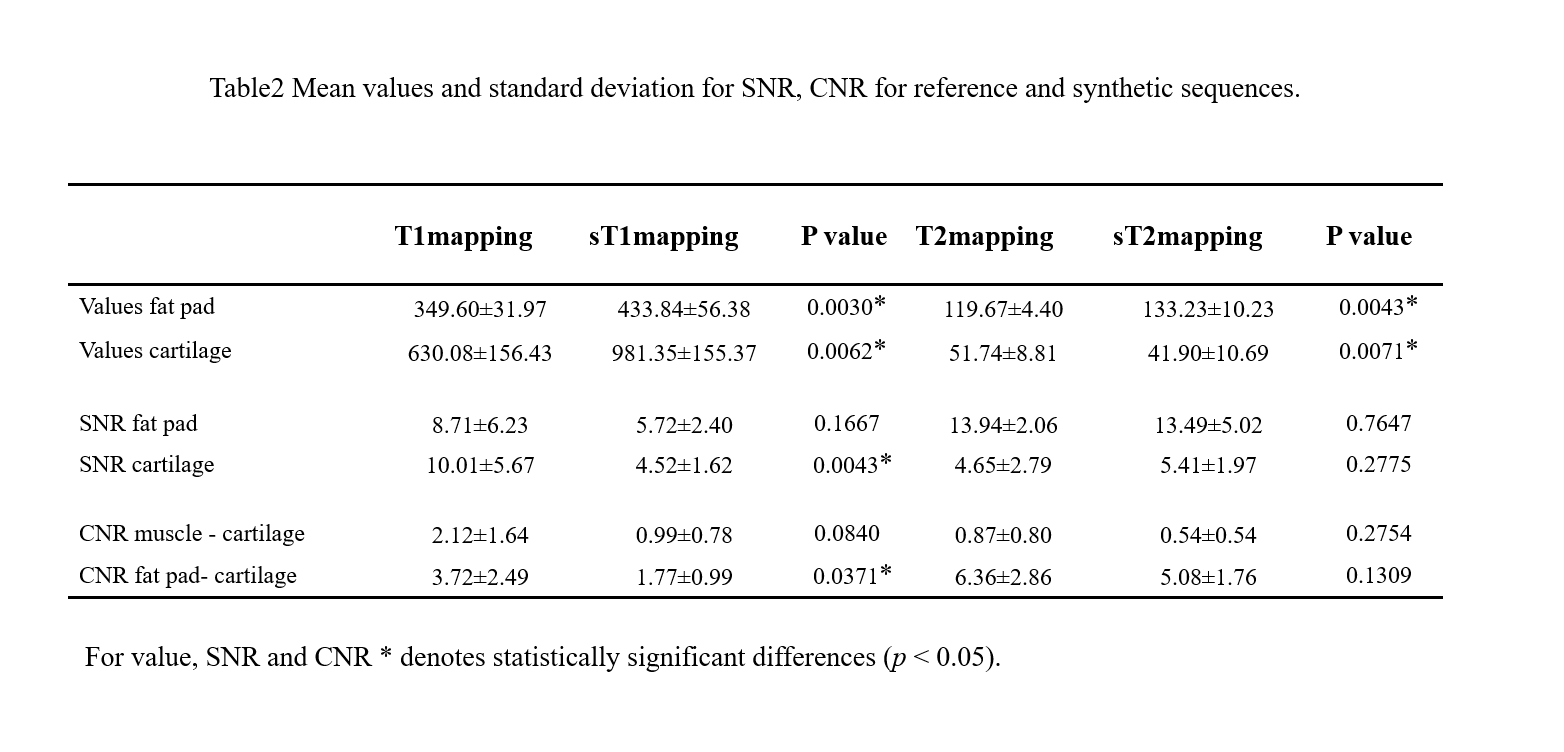
The total scan time for each knee T1WI, T1mapping, T2mapping was around 10mins. and the scan time of MDME was around 7mins. Figure 1 showed a 29 female volunteer, there was no morphological changes in the patellar cartilage, but suspicious subchondral edema could be found in T1WI. Both T1\T2 mapping and synthetic T1\T2 mapping have higher specificity in the identification of early cartilage degeneration. The T2 relaxation time color maps showed blue (deep layer) and green (shallow layer) color scale, and the local deep area showed patchy green color scale instead. The difference in subjective evaluation of image resolution between them could be accepted. The articular cartilage in MDME sequence were displayed as well as in reference sequence. The quantitative image analysis results for the different anatomical locations are shown in Table 2. The T1 and T2 relaxation times of fat pad and cartilage were significantly different between two methods (reference scan VFA\SE sequence and QRAPMASTER)(6), and these values were within the results reported in the previous literatures. No difference was found for the SNR of fat tissue in two T1\T2 mapping. The SNR for cartilage in T1mapping was 10.01±5.67, which is significantly different from synthetic T1mapping. The CNR (muscle-cartilage) of synthetic T1mapping and T2mapping, CNR (fat pad-cartilage) of synthetic T2mapping did not demonstrate significantly reduced compared to the reference sequence. Figure 2 showed metric values of T1/T2mapping comparable to that of the conventional method, and there was significant difference between the quantitative value in cartilage of knee.Discussion
The QRAPMASTER based on MDME showed image quality comparable to that of the reference method, especially for cartilage in T2mapping, which took obviously shorter scan time(5). These quantitative imaging analyze the cartilage mainly by providing information regarding water content, collagen integrity, and proteoglycan content. The small structures such as cartilage in knee MRI were also demonstrated well in synthetic images. However, the synthetic images became very noisy and the values of fat pat and cartilage in quantitative sequence were significantly different. The above results suggests that the MDME scan may be useful for getting a high-quality quantitative image to improve diagnostic confident and save 33% of scanning time, and it is essential to enable this new technology to be implemented in clinical routine, especially the evaluation of cartilage. The initial results, which need to be further validated in a larger patient cohort, demonstrated the ability of T1WI and T2WI metric values to characterize articular cartilage and other knee normal structures.Conclusion
QRAPMASTER for quantitative evaluation of knee cartilage may decrease up to 33% scan time, demonstrated the ability of T1 and T2 metric values to characterize articular cartilage in knee MRI.Acknowledgements
none.References
1. Taylor NJRdcoNA. Nonsurgical Management of Osteoarthritis Knee Pain in the Older Adult: An Update. 2018;44(3):513-524.
2. Cheng Q, Zhao FC. Comparison of 1.5- and 3.0-T magnetic resonance imaging for evaluating lesions of the knee: A systematic review and meta-analysis (PRISMA-compliant article). Medicine 2018;97(38):e12401.
3. Colotti R, Omoumi P, Bonanno G, Ledoux JB, van Heeswijk RB. Isotropic three-dimensional T(2) mapping of knee cartilage: Development and validation. Journal of magnetic resonance imaging : JMRI 2018;47(2):362-371.
4. Roux M, Hilbert T, Hussami M, Becce F, Kober T, Omoumi P. MRI T2 Mapping of the Knee Providing Synthetic Morphologic Images: Comparison to Conventional Turbo Spin-Echo MRI. Radiology 2019;293(3):620-630.
5. Warntjes JB, Leinhard OD, West J, Lundberg P. Rapid magnetic resonance quantification on the brain: Optimization for clinical usage. Magnetic resonance in medicine 2008;60(2):320-329.
6. Bojorquez JZ, Bricq S, Acquitter C, Brunotte F, Walker PM, Lalande A. What are normal relaxation times of tissues at 3 T? Magnetic resonance imaging 2017;35:69-80.
Figures