2466
Bi-exponential 3D UTE-T1rho relaxation mapping of ex-vivo human knee patellar tendon at 3T1Department of Radiology, University of California, San Diego, USA, San Diego, CA, United States, 2GE Healthcare, San Diego, USA, San Diego, CA, United States, 3Veterans Affairs San Diego Helath Care system, San Diego, USA, San Diego, CA, United States, 4Veterans Affairs San Diego Health Care System, San Diego, CA, USA, San Diego, CA, United States, 5Department of Bioengineering, University of California, San Diego, USA, San Diego, CA, United States
Synopsis
Keywords: Tendon/Ligament, Tendon/Ligament, UTE, MRI
UTE sequences have been previously used to image short T2 tissues. T1ρ has shown promising results in assessing macromolecules and has been proposed as a potential biomarker for tissue degeneration. In this study, we aimed to demonstrate bi-exponential relaxation of the patellar tendon at 3T, using the 3D ultrashort echo time T1ρ (UTE-T1ρ) sequence. Five ex-vivo knee joints were scanned, and we were able to demonstrate better fitting with a bi-component model and better discern the long and short relaxation components of the tissue, along with their respective fractions
Introduction
Spin lattice relaxation in the rotating frame(T1ρ) is sensitive to low-frequency motional processes (100 Hz to a few kHz) in biological tissues. It provides information on the composition of macromolecules and proton exchange between water and macromolecules. Studies have shown that a change in the composition of the extracellular matrix, like a decrease in proteoglycan content and an increase in water content, leads to increased T1ρ relaxation times(1,2).With UTE imaging of short T2 tissues like tendons, ligaments, and cortical bone, we can detect and spatially encode signals which are otherwise not detected by conventional MRI sequences (3). Studies on patellar tendons have demonstrated two distinct components, bound water, and free water, using T2 and T2* bicomponent analysis (4,5,6). Single exponential models are not able to discern short and long relaxation components. By performing bicomponent analysis, we are able to determine their respective fractions and relaxation times. In this study, we aimed to investigate bicomponent T1ρ relaxation of the patellar tendon using a 3D UTE-based T1ρ (UTE-T1ρ) sequence.Methods
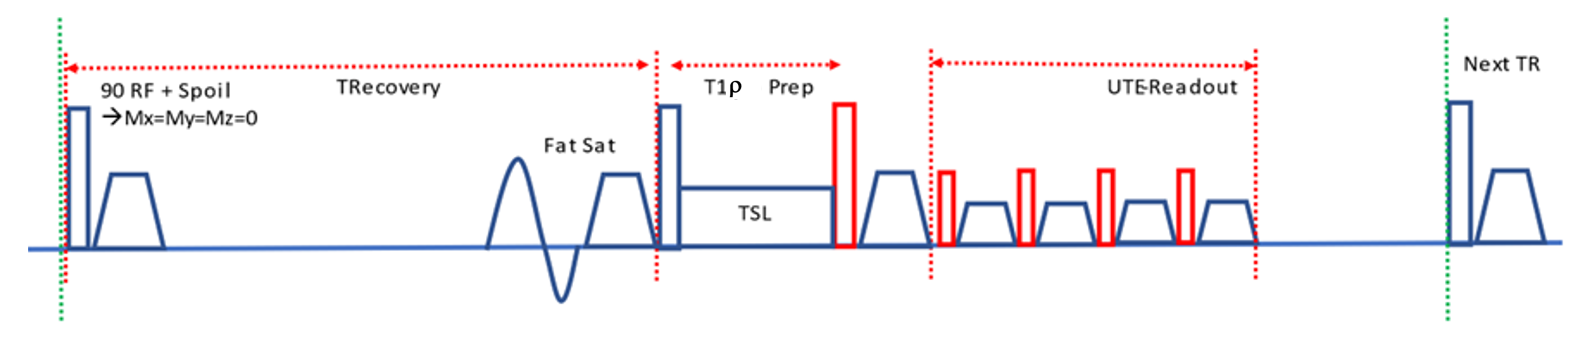
The pulse sequences, as shown in Figure 1, include a magnetization reset module, which consists of a 90° RF pulse, followed by a spoiler gradient, which ensures that the net magnetization vector is near zero (complete spoiling). This is followed by a fat saturation pulse and the T1ρ preparation, which involves a 90° excitation pulse followed by a spin lock pulse applied along the transverse magnetization vector for a duration of spin-locking time (TSL), and finally, another 90° pulse to return the magnetization vector along the z-axis. Next, the UTE multi-spoke imaging sequence acquires the same k-space line twice to compensate for T1 recovery in the acquisition train with RF amplitudes shown in red (positive and negative).Five donor knee specimens, of ages: 66y, 62y, 38y, 67y, and 69y were scanned. Knee 1 and knee 3 were female, and the rest were male. The knee specimens, initially frozen at -80°F, were thawed for ~60 hours and scanned on a 3T GE scanner (MR750).
The monoexponential UTE-T1ρ relaxation was estimated by fitting the signal intensities of each pixel at different spin-lock durations to:
S=A.e^(-TSL⁄T1ρ)
where S is the signal intensity, and A is the amplitude.
The bi-exponential relaxation components were estimated using;
S=As.e^(-TSL⁄T1ρs)+Al.e^(-TSL⁄T1ρl)
where As is the amplitude of the short component and Al is the amplitude of the long component. UTE T1ρs and T1ρl are the relaxation times for the short and long components, respectively. Both mono- and bi-exponential fitting were programmed in MATLAB, and the Levenberg-Marquardt algorithm was used to solve the nonlinear minimization of the equations.
The acquisition parameters were as follows: acquisition matrix = 256×256, Field of view (FOV) = 16×16cm2, slice thickness = 3 mm, bandwidth = 125 kHz, TE = 32 us, magnetization recovery time = 250 ms, spin-lock amplitude = 500 Hz, 12 different spin lock times (TSLs) including 0.5/2/4/6/8/10/15/25/35/45/55/65 ms
Results and discussion
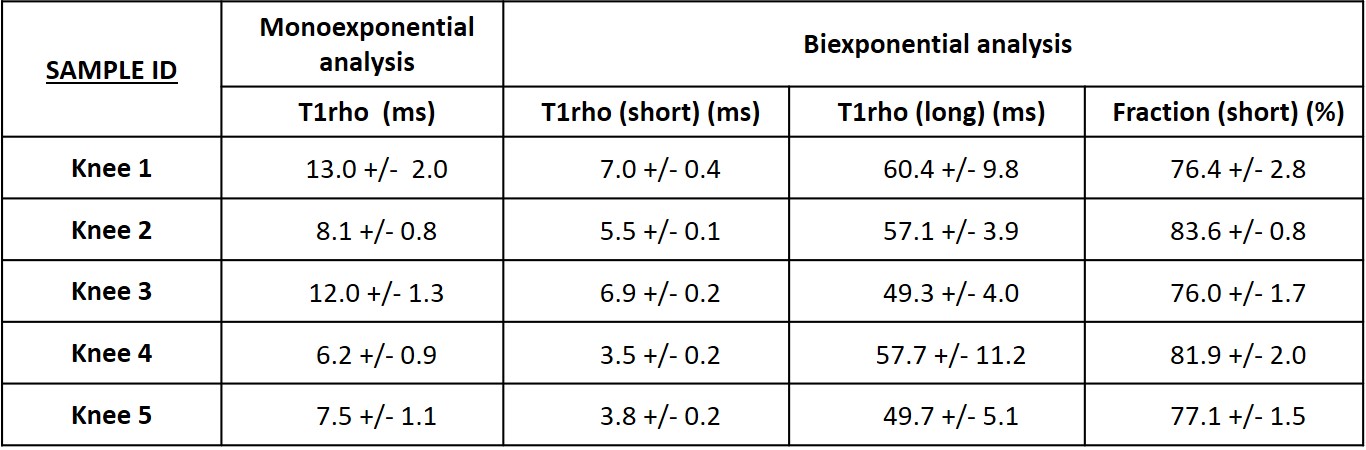
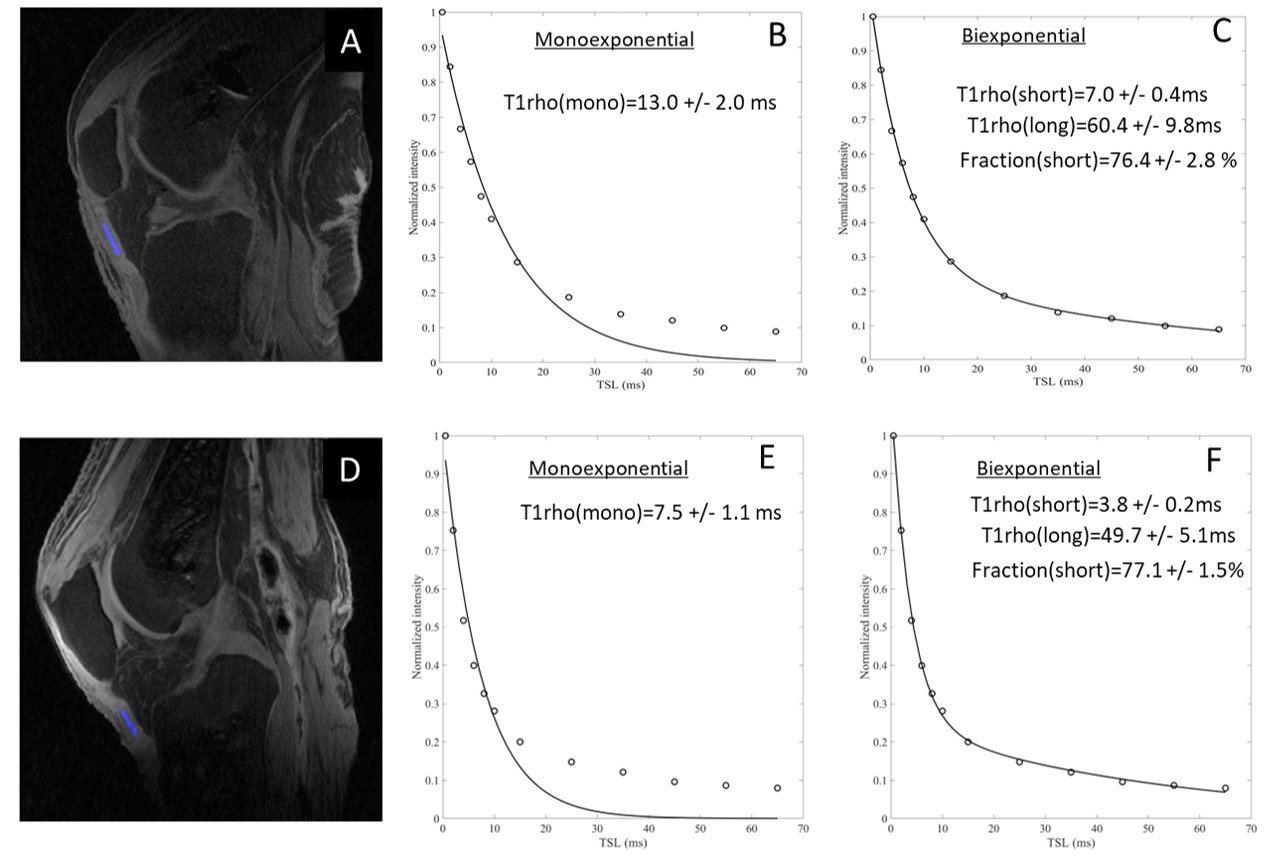
Table 1 shows the observed UTE-T1ρ mono and bi-exponential values. The mean monoexponential and bi-exponential short and long times were estimated to be 9.4±2.7ms, 5.3±1.5ms, and 54.8±4.5ms, respectively. The dominant fast relaxation fraction was estimated to be 79±3.1%. Kijowski et al used a 3D UTE-based T2* sequence and determined the fraction of short components to be 79.5% in healthy controls (6). Chang et al found a short T2* fraction of 79.2% and Jin Liu et al reported a short T2* fraction of 80.5 % in ex-vivo tendon samples, similar to the results of this study (4,7).The fitting curves for the mono- and bi-exponential analyses are shown in Figure 2, where a bi-component signal model has superior curve fitting compared to a single-component model. Similar findings were observed in other studies conducted on tendons (4,6,7).
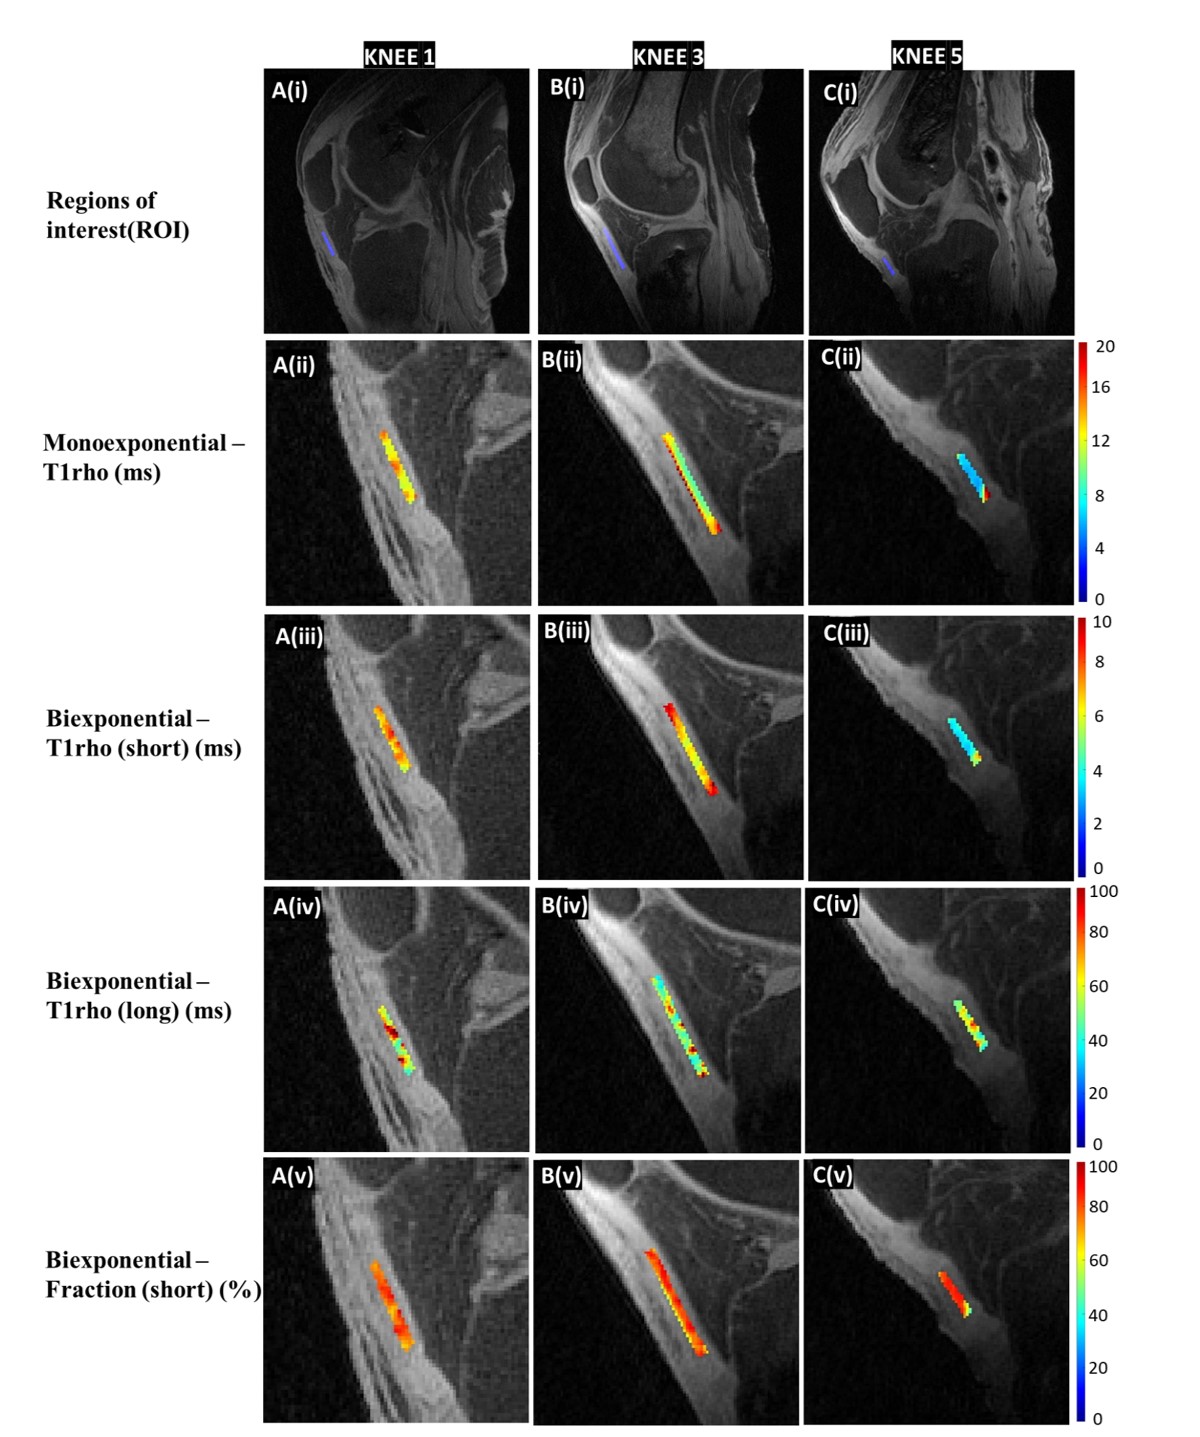
Figure 3 shows the color maps for mono and bi-exponential analyses. Our results show that using the 3D UTE-T1ρ sequence, we are able to map short and long water components, including their UTE-T1ρ relaxation times and relative fractions in short T2 tissues like the patellar tendon. The short UTE-T1ρ signal is usually derived from water bound to collagen, and the long component is derived from free water. The short UTE-T1ρ relaxation time and short fraction hence could be used as biomarkers for early degeneration associated with injury of the collagen matrix.
Conclusion
The 3D UTE T1ρ sequence was able to map short and long water components in tendons, and could potentially be used as a biomarker for early detection of tendon degeneration in clinical practice.Acknowledgements
The authors acknowledge grant support from the National Institutes of Health (R01AR062581, R01AR068987, R01AR075825, R01AR079484, and R21AR075851), VA Clinical Science and Rehabilitation Research and Development Services (Merit Awards I01CX001388), and GE Healthcare.
References
1. Akella, S.V., Reddy Regatte, R., Gougoutas, A.J., Borthakur, A., Shapiro, E.M., Kneeland, J.B., Leigh, J.S. and Reddy, R. (2001), Proteoglycan-induced changes in T1ρ-relaxation of articular cartilage at 4T. Magn. Reson. Med., 46: 419-423. https://doi.org/10.1002/mrm.1208
2. Watts, R., Andrews, T., Hipko, S., Gonyea, J.V. and Filippi, C.G. (2014), In vivo whole-brain T1-rho mapping across adulthood: Normative values and age dependence. J. Magn. Reson. Imaging, 40: 376-382. https://doi.org/10.1002/jmri.24358
3. Robson, Matthew D. PhD; Gatehouse, Peter D. DPhil; Bydder, Mark PhD; Bydder, Graeme M. MB, ChB. Magnetic Resonance: An Introduction to Ultrashort TE (UTE) Imaging. Journal of Computer Assisted Tomography: November 2003 - Volume 27 - Issue 6 - p 825-846
4. Chang EY, Du J, Statum S, Pauli C, Chung CB. Quantitative bi-component T2* analysis of histologically normal Achilles tendons. Muscles Ligaments Tendons J. 2015;5(2):58-62. Published 2015 Jul 3.
5. Chang, E.Y., Du, J., Iwasaki, K., Biswas, R., Statum, S., He, Q., Bae, W.C. and Chung, C.B. (2015), Single- and Bi-component T2* analysis of tendon before and during tensile loading, using UTE sequences. J. Magn. Reson. Imaging, 42: 114-120. https://doi.org/10.1002/jmri.24758
6. Kijowski, R., Wilson, J.J. and Liu, F. (2017), Bicomponent ultrashort echo time analysis for assessment of patients with patellar tendinopathy. J. Magn. Reson. Imaging, 46: 1441-1447. https://doi.org/10.1002/jmri.25689
7. Liu J, Nazaran A, Ma Y, et al. Single- and Bicomponent Analyses of T2⁎ Relaxation in Knee Tendon and Ligament by Using 3D Ultrashort Echo Time Cones (UTE Cones) Magnetic Resonance Imaging. Biomed Res Int. 2019;2019:8597423. doi:10.1155/2019/8597423
Figures