2465
Scan-Rescan Repeatability of 10-Minutes Long MAPSS Sequence for Simultaneous MR T2 and T1ρ Mapping of Cartilage and Meniscus at 7 Tesla1Program of Advanced Musculoskeletal Imaging (PAMI), Cleveland Clinic, Cleveland, OH, United States, 2Department of Biomedical Engineering, Lerner Research Institute, Cleveland Clinic, Cleveland, OH, United States, 3Department of Diagnostic Radiology, Imaging Institute, Cleveland Clinic, Cleveland, OH, United States
Synopsis
Keywords: Cartilage, Relaxometry, Meniscus
The aim of this study was to evaluate the in vivo scan-rescan repeatability of T2 and T1ρ quantification in knee cartilage and meniscus of patients with knee pain at 7 Tesla. Four subjects were scanned-rescanned on the same day using the 10-minutes-long MAPSS sequence for simultaneous T2 and T1ρ mapping. Coefficients of variation and Bland-Altman plots showed excellent scan-rescan repeatability of in vivo T2 and T1ρ quantification in cartilage and meniscus at 7 Tesla. Our results indicate that fast T2 and T1ρ mapping with four echo and four spin-lock times remains sensitive to cartilage degeneration.Purpose
Cartilage and meniscus degeneration are characteristic manifestations of knee osteoarthritis (OA). Although T2 and T1ρ mapping are the most established quantitative MRI techniques for the early in vivo detection of cartilage [1] and meniscus [2] damage, their clinical application is often limited by suboptimal reproducibility and long scan times. However, the benefit of signal-to-noise ratio gain combined with accelerated imaging methods at 7T [3] provides an opportunity for the development of fast and reproducible T2 and T1ρ mapping techniques for the knee joint.The goal of this study was to evaluate the in vivo scan-rescan repeatability of T2 and T1ρ quantification in knee cartilage and meniscus of subjects with knee pain at 7T using the 10-minutes-long MAPSS sequence that allows simultaneous T2 and T1ρ mapping.
Methods
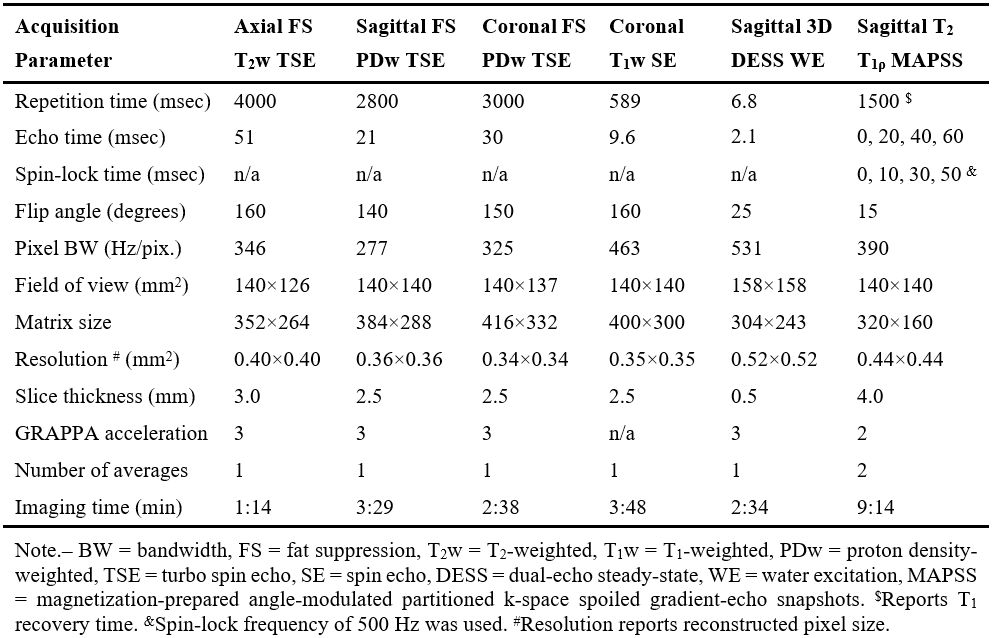
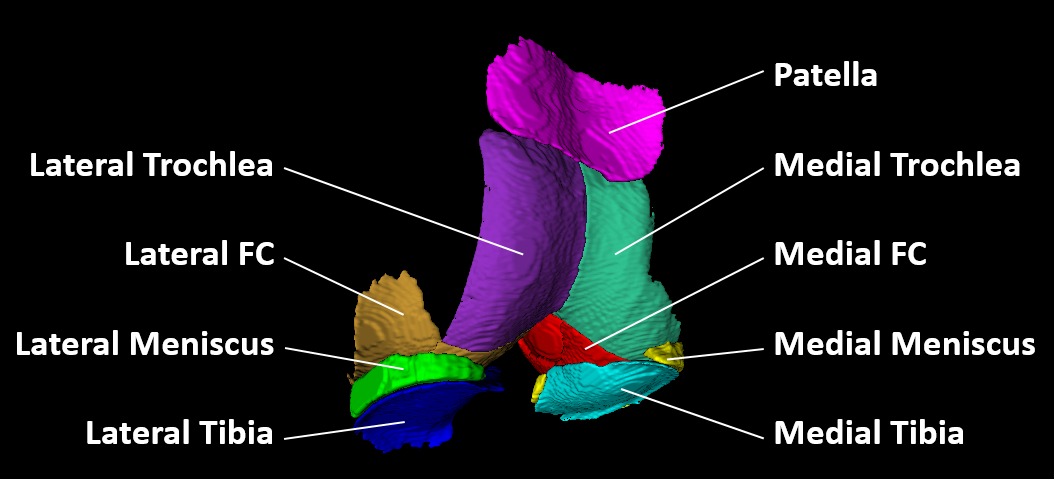
This ongoing, IRB-approved, study evaluates the in vivo reproducibility of T2 and T1ρ quantification in knee cartilage and menisci. Four subjects with knee pain (age range, 18-53 years; BMI range, 21.6-34.5 kg/m2; 3 women) were scanned and rescanned on the same day at 7T. After first scan, subject left the MRI room for a 5-10 minutes break, returned, and was repositioned for the rescan. All subjects were imaged at 7T MRI (Terra, Siemens, Erlangen, Germany) using a birdcage transmit / 28-channel receive phased-array knee coil (Quality Electrodynamics, Mayfield Village, OH). The protocol included proton density-, T1-, and T2-weighted turbo-spin echo sequences with and without fat suppression for the clinical evaluation of knee joint. All chondral lesions were classified according to the ICRS grading system [4]. 3D dual-echo steady-state (DESS) sequence with water excitation was acquired for cartilage and meniscus segmentations. Finally, the 3D magnetization-prepared angle-modulated partitioned k-space spoiled gradient-echo snapshots (MAPSS) sequence was used for the simultaneous acquisition of four T2-weighted (echo times: 0/20/40/60 ms) and four T1ρ-weighted images (spin-lock times: 0/10/30/50 ms, spin-lock frequency: 500 Hz) [5]. To reduce artifacts, T1ρ preparation robust to B0 and B1 inhomogeneity [6] and T2 preparation with MLEV 16 refocusing train of composite inversion pulses [7] were used. Acquisition parameters are detailed in Figure 1.The high resolution DESS, T2- and T1ρ-weighted images were rigidly registered to the first echo of the T2-weighted images. A total of nine cartilage and meniscus compartments were segmented on DESS images (Figure 2): medial/lateral femoral condyle (MFC/LFC), medial/lateral trochlea (MTro/LTro), medial/lateral tibia (MTib/LTib), patella (Pat), and medial/lateral meniscus (MMen/LMen). The automatic segmentation using an in-house deep learning algorithm [8] was followed by the manual corrections of segmentations, and subdivision of the femoral cartilage into MFC, LFC, MTro, LTro performed in ITK-SNAP. T2 and T1ρ parametric maps were calculated voxel-wise by fitting a mono-exponential decay to the data using a two-parametric least-square fitting routine. The corresponding goodness-of-fit (R2) maps were also calculated. Only the first three echo/spin-lock times were used to map meniscus, which exhibits shorter T2 and T1ρ than cartilage. Segmented regions were transformed and overlaid onto the parameter maps to obtain mean T1ρ and T2 values for each compartment. Voxels with T2> 130 ms, T1ρ> 150 ms, or R2< 0.9 were excluded from analysis.
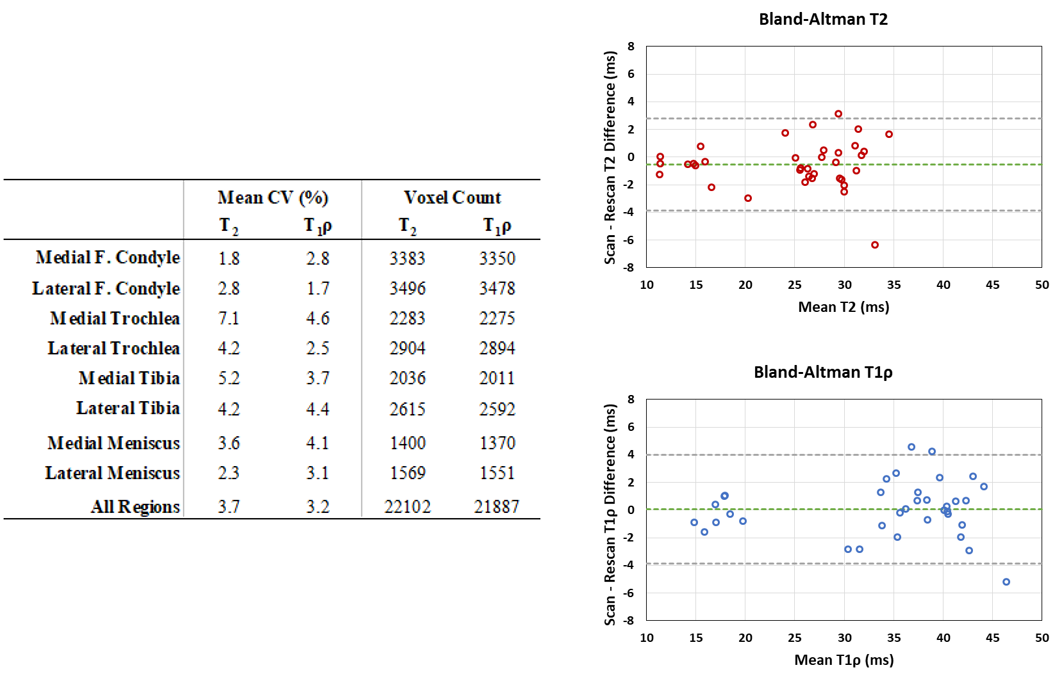
Scan-rescan repeatability of T2 and T1ρ was evaluated by calculating coefficients of variation (CVs) between the two MRI measurements in each compartment. Bland-Altman plots were used to evaluate agreement of scan-rescan measurements.
Results
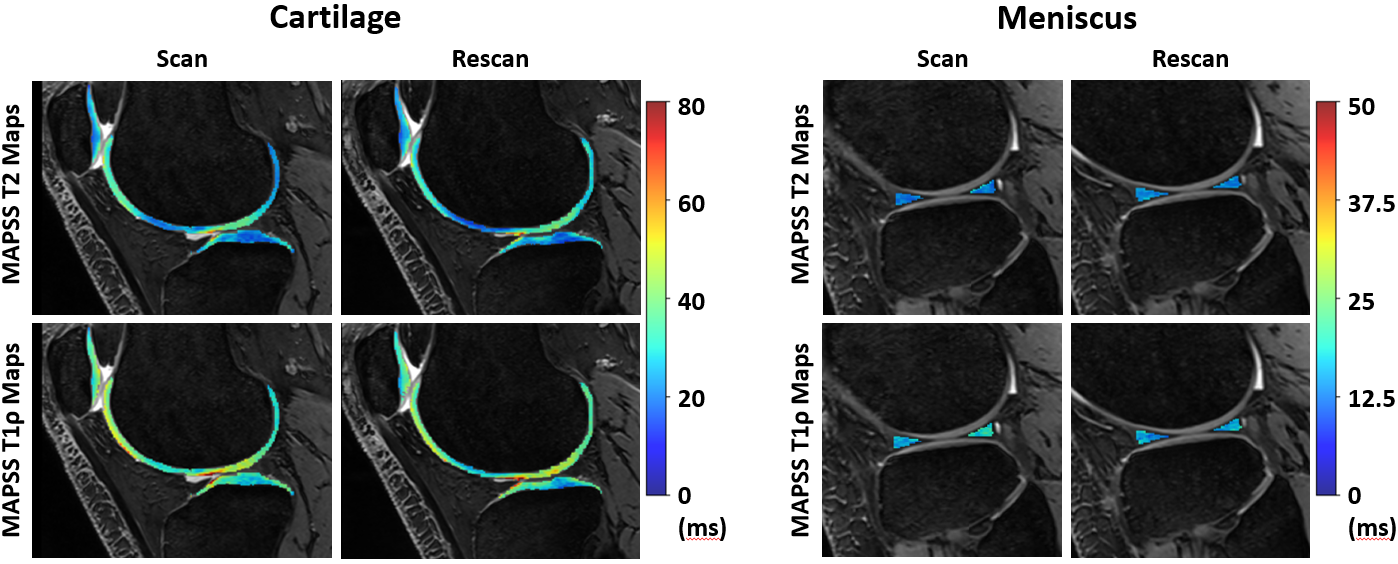
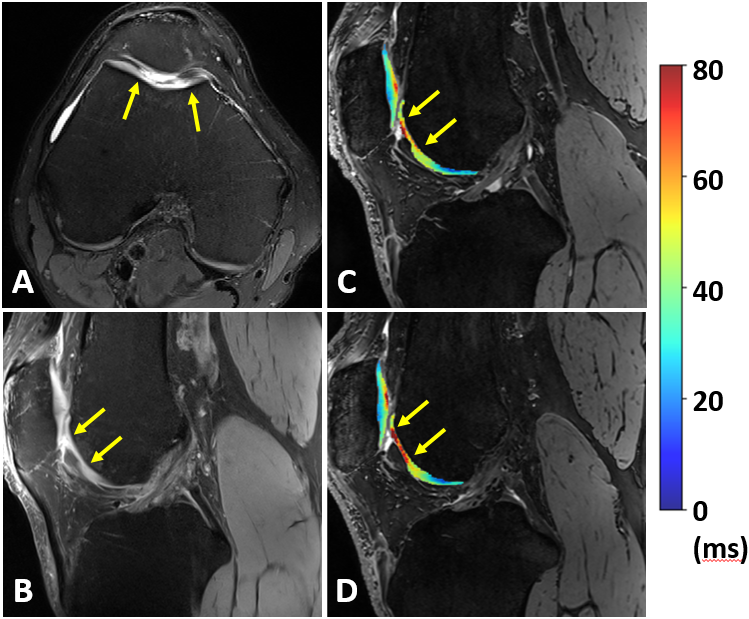
Examples of scan-rescan in vivo T2 and T1ρ maps in cartilage and meniscus overlaid on the corresponding DESS images are shown in Figure 3. We found excellent scan-rescan repeatability of in vivo T2 and T1ρ quantification in cartilage and meniscus with the overall mean CVs of 3.7% and 3.2%, respectively (Table in Figure 4). Among all evaluated regions, the highest CVs of 7.1% and 4.6% were found in the MTro for T2 and T1ρ, respectively. Despite shorter T2 and T1ρ, meniscal regions showed similar CV range (2.3-4.1%) compared to cartilage regions. Bland-Altman plots showed high scan-rescan repeatability for T2 and T1ρ with the majority of scan-rescan differences within the limits of agreement and clustered around the mean of scan-rescan difference which was close to zero (Figure 4).Despite short acquisition of MAPSS sequence, the T2 and T1ρ maps remain sensitive to cartilage degeneration as demonstrated by the increased T2 and T1ρ values in the region of grade III cartilage defect (Figure 5). Three of four subjects showed multiple grade I-IV cartilage defects in the patellofemoral and tibial compartments, as well as increased signal in meniscus, osteophytes, and bone marrow edema-like lesions.
Discussion
MAPSS sequence for simultaneous T2 and T1ρ mapping with a total scan time of less than 10 minutes and robustness to B0 and B1 inhomogeneities showed excellent in vivo scan-rescan repeatability of T2 and T1ρ quantification in cartilage and meniscus of subjects with knee pain at 7T. Our results indicate that fast T2 and T1ρ mapping with MAPSS using four echo/spin-lock times remains sensitive to cartilage degeneration. The CVs found in this study are similar to previously reported CVs of 1.4-4.1% for T2 and 1.6-3.9% for T1ρ mapping of cartilage in volunteers with MAPSS at 3T [9].Conclusion
Short clinical protocol followed by the MAPSS sequence for T2 and T1ρ mapping have great potential for in vivo evaluation of knee joint degeneration and regeneration.Acknowledgements
No acknowledgement found.References
[1] Atkinson HF, et al. MRI T2 and T1ρ relaxation in patients at risk for knee osteoarthritis: a systematic review and metaanalysis. BMC Musculoskelet Disord. 2019; 20(1): 182.
[2] Eijgenraam SM, et al. T2 mapping ofthe meniscus is a biomarker for early osteoarthritis. Eur Radiol. 2019; 29(10): 5664-5672.
[3] Guerin The ultimate signal-to-noise ratio in realistic body models. Magn Reson Med. 2017; 78: 1969-1980.
[4] Hjelle K, et al. Articular cartilage defects in 1,000 knee arthroscopies. Arthroscopy. 2002; 18(7): 730-734.
[5] Li X, et al. Simultaneous Acquisition of T1ρ and T2 Quantification in Knee Cartilage: Repeatability and Diurnal Variation. J Magn Reson Imaging. 2014; 39: 1287–1293.
[6] Kim J, et al., MR T1ρ preparations: B1 and B0 inhomogeneity response on 3T and 7T systems. Proc Intl Soc Mag Reson Med. 2021; 29: 3312.
[7] Foltz W, et al., T2 accuracy on a whole‐body imager. Magn Reson Med. 1997; 38(5): 759-768.
[8] Gaj S, et al. Automated cartilage and meniscus segmentation of knee MRI with conditional generative adversarial networks. Magn Reson Med. 2019; 84(1): 437-449.
[9] Kim J, et al. Multi-vendor multi-site T1ρ and T2 quantification of knee cartilage. Osteoarthritis and Cartilage. 2020; 28: 1539-1550.
Figures