2461
Water content and T2 changes in ex vivo bovine knee cartilage under compressive strain1UBC MRI Research Centre, Radiology, University of British Columbia, Vancouver, BC, Canada, 2Centre for Hip Health and Mobility, Vancouver, BC, Canada, 3School of Biomedical Engineering, University of British Columbia, Vancouver, BC, Canada, 4Orthopaedics, University of British Columbia, Vancouver, BC, Canada
Synopsis
Keywords: Cartilage, Osteoarthritis, Strain
We present a novel approach to cartilage multi-echo data where T2 reflects focal changes in strain along the cartilage depth, and the signal amplitude reflects a measure of water content which presents a simpler pattern of change that reflects strain. Ex vivo bovine knee samples were scanned at 9.4T while under load, with high resolution along the cartilage depth to allow direct measurement of strain. Changes in water content were found to be more spatially uniform than the complex depth dependence shown by T2, and showed a high degree of correlation to whole-cartilage averages of bulk strain.Introduction
Mapping of transverse relaxation time (T2) has been investigated as a surrogate measure of strain in articular cartilage. This mapping may allow for the indirect detection of abnormal tissue load response that has been implicated in the onset or progression of osteoarthritis1,2. Cartilage T2 depends on a complex combination of proton density, compartmental differences in water mobility, and collagen fibril orientation that varies between the different zonal layers3. The resultant depth dependence may complicate the detection of strain-related changes, especially at clinically feasible resolutions where partial volume artifact across the cartilage depth becomes significant. This work explores the T2 response to strain at high resolution in ex vivo bovine knee cartilage samples at 9.4T, and extracts a water content metric which shows a simpler pattern of change that reflects strain.Methods
Five previously frozen medial femoral and tibial osteochondral block pairs were submerged in phosphate-buffered saline (PBS) within a uniaxial compressive loading actuator4. Specimens were scanned in a 9.4 Tesla Bruker MRI scanner using a quadrature volume RF coil (inner diameter = 72mm). Specimens were scanned uncompressed and three more times at step loads with target bulk compressive strains of 10%, 20%, and 30% with a 20-minute delay after initial load application to allow creep to occur5. MSME data were acquired (TE/TR = 9.22/4000 ms, 36 echoes, NA=3, scan time = 32 minutes, resolution = 0.0625x0.250 mm, slice thickness=1.6mm, 3 slices). Data was denoised6 and processed using NNLS with stimulated echo correction7, which produces T2 distributions that reflect both the weighted T2 average of the signal peak, and a water content metric that is calculated from the integral under the signal peak. The water content metric WC was calculated as$$WC=\frac{signal\;integral\;under\;T2\;peak}{pixelwise\;average\;of\;signal\;integral\;from\;all\;pixels\;in\;femoral\;unloaded\;cartilage\;in\;the\;same\;slice}$$
This normalization was undertaken mainly to account for signal differences between slices due to magnetization transfer effects on cartilage in the interleaved slices8. However, WC should still be considered a relative metric of water content, since it does not fully account for all other scaling factors that affect the absolute signal intensity.
Tibial and femoral cartilage within regions of contact were manually segmented. The bulk strain εbulk as well as the relative change in the MRI metric mean ΔT2 or ΔWC was calculated as follows:
$$ \epsilon_{bulk} = \frac{thickness_{compressed}-thickness_{uncompressed}}{thickness_{uncompressed}}$$
$$\Delta{metric} = \frac{metric_{compressed}-metric_{uncompressed}}{metric_{uncompressed}}$$
Results
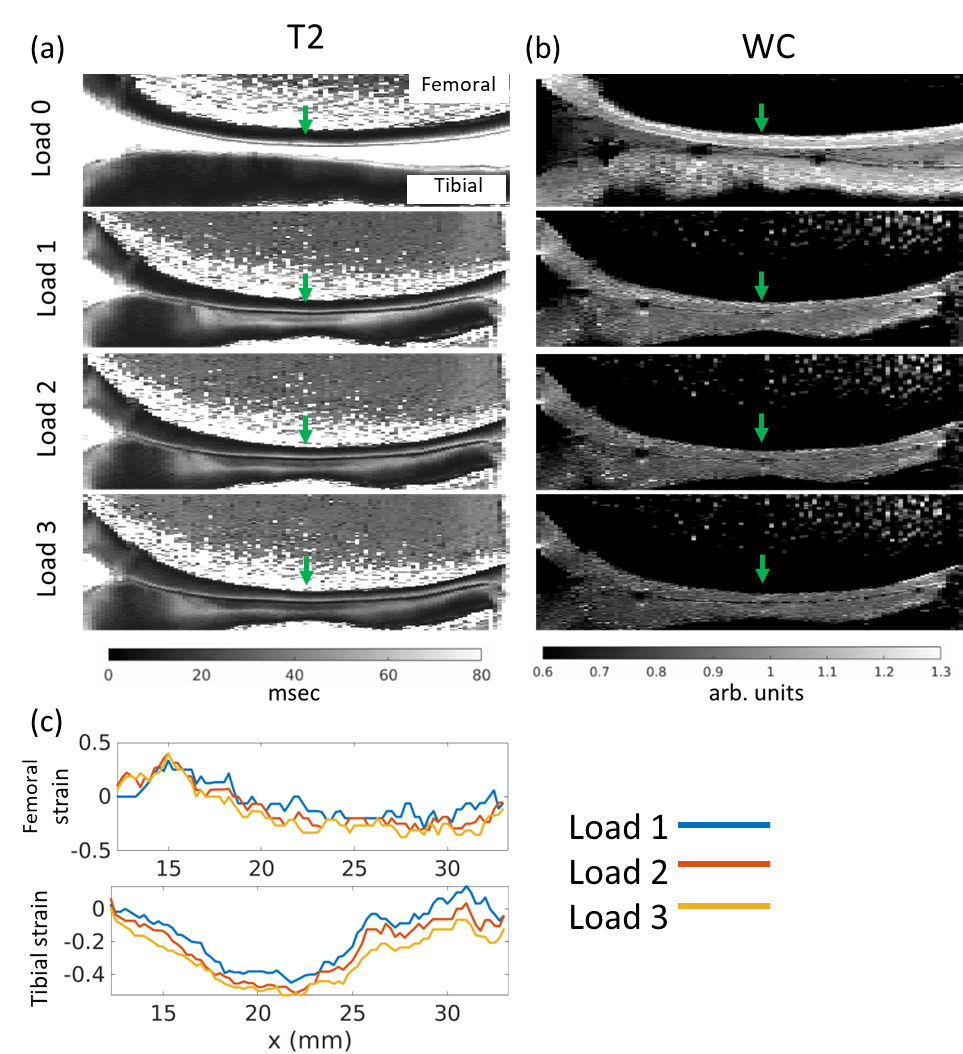
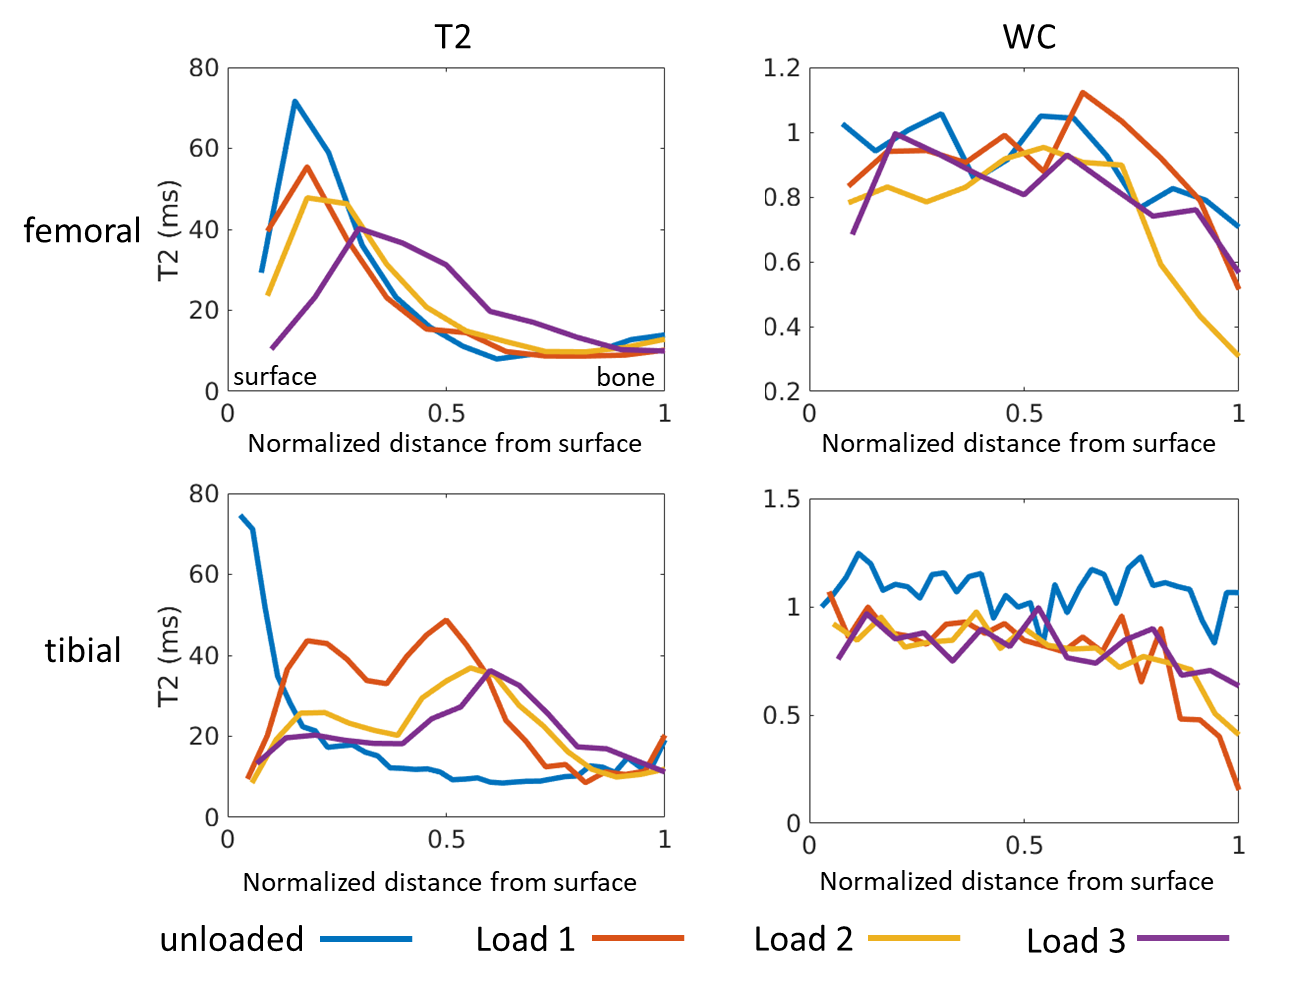
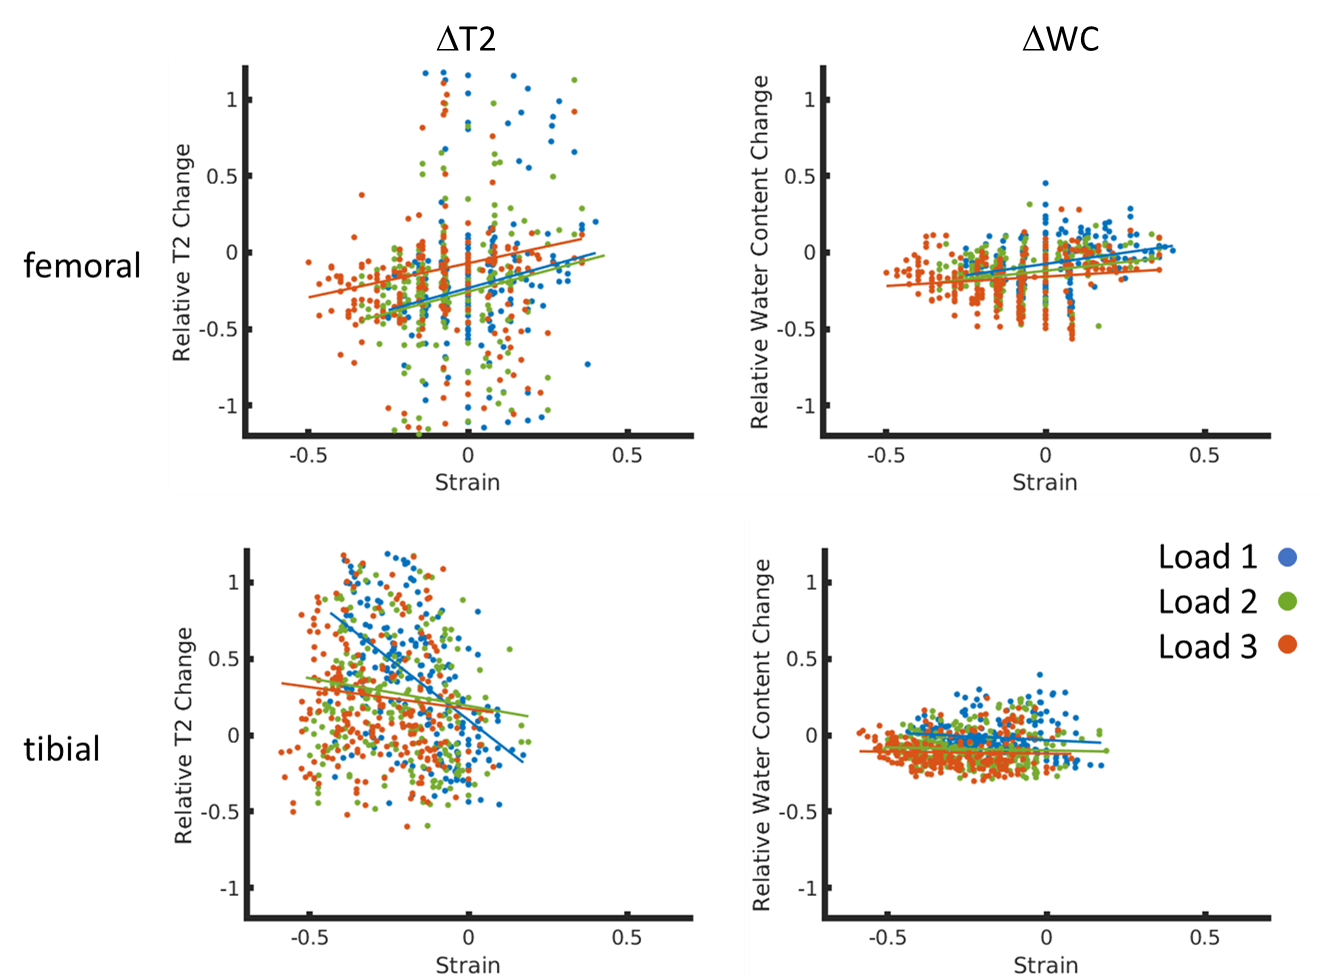
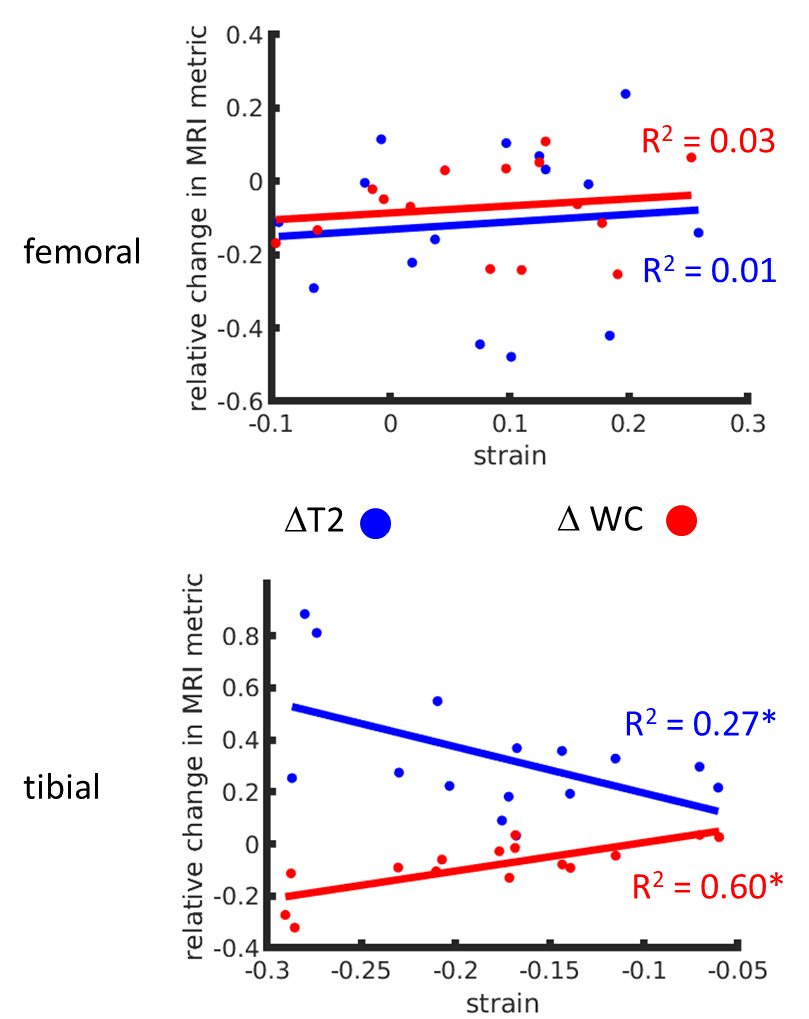
Figure 1 shows typical T2 distributions at the different load conditions (from the midpoint of tibial cartilage depth, along the column marked with the green arrow in Figure 2), showing one salient T2 component in the distribution. Sagittal unloaded T2 maps in Figure 2a show a depth dependence that roughly follows the cartilage zones as previously reported9, with an initial T2 peak near the surface which decreases with depth. Cartilage compression causes the T2 maxima to extend deeper into the cartilage in an arc that roughly follows the strain profile along the cartilage length (Figure 2c). Representative depth profiles in Figure 3a (located at the green arrows in Figure 2) show that the T2 peak decreases in value as it moves deeper into the cartilage with increasing load. Conversely, WC shows a decrease with load that is much more uniform throughout the cartilage, with a more gradual decrease with depth (Figures 2b, 3b). The scatterplot in Figure 4 shows that for one representative specimen, ΔT2 extends across a larger dynamic range but has higher variability, whereas ΔWC is relatively smaller and more independent of strain. However, when overall cartilage averages of strain and MRI metric changes from all samples were pooled together (Figure 5), ΔWC showed a higher linear correlation with strain than ΔT2 (R2 = 0.60 vs. 0.27). The grouped femoral whole-cartilage means showed no relationship between strain and changes in either MRI metric.Discussion
We observed a T2 depth dependence on strain that reproduces prior work10. Specifically, the changes under load were related to the changing orientation of collagen fibrils, therefore changing their dipolar interaction with the main magnetic field. The shape of the T2 depth profile provides much information that could be used to quantify local strain, but much of this utility is lost to partial volume artifact at low image resolutions.The spatial patterns and changes observed for the water content matches well with our expectation that water concentration in unloaded cartilage decreases monotonically with cartilage depth3, and further decreases with load as the increased hydrostatic pressure causes fluid efflux. ΔWC showed a weak dependence on columnwise strain in the individual specimen but showed a stronger inter-specimen correlation with overall strain, suggesting that ΔWC is related more to global measures of strain. The water content metric calculated in this study does not represent a true proton density because it does not account for factors such as coil sensitivity and T1. Measurement of water content would be improved by use of reference water phantoms and with more efficient pulse sequences11.
Conclusion
We have identified a novel approach to multi-echo spin-echo data analysis which uses T2 to identify focal changes in strain along the cartilage depth, while also detecting the overall whole-cartilage strain with the water content metric, in a more robust manner that may be valuable at clinical resolutions.Acknowledgements
This research is funded by the Arthritis Society (Grant # 21-0000000129), a NSERC Discovery Grant (RGPIN-2019-06347), and Michael Smith Health Research BC.References
1. Souza RB, Kumar D, Calixto N, et al: Response of knee cartilage T1rho and T2 relaxation times to in vivo mechanical loading in individuals with and without knee osteoarthritis. Osteoarthritis and Cartilage 22:1367–1376, 2014.
2. Desrochers J, Yung A, Stockton D, et al: Depth-dependent changes in cartilage T2 under compressive strain: a 7T MRI study on human knee cartilage. Osteoarthritis and Cartilage 28:1276–1285, 2020.
3. Xia Y: MRI of articular cartilage at microscopic resolution. Bone & Joint Research 2:9–17, 2013.
4. Küpper JC, Sullivan E, Coope R, et al: Design and Validation of a Cartilage Compression Actuator for Magnetic Resonance Imaging. University of British Columbia School of Biomedical Engineering Research Symposium, 2022.
5. Kempson GE, Freeman MAR, Swanson SAV: The determination of a creep modulus for articular cartilage from indentation tests on the human femoral head. Journal of Biomechanics 4:239–250, 1971.
6. Does MD, Olesen JL, Harkins KD, et al: Evaluation of principal component analysis image denoising on multi-exponential MRI relaxometry. Magnetic Resonance in Medicine 81:3503–3514, 2019.
7. Prasloski T, Mädler B, Xiang Q-S, et al: Applications of stimulated echo correction to multicomponent T2 analysis. Magnetic Resonance in Medicine 67:1803–1814, 2012.
8. Radunsky D, Blumenfeld-Katzir T, Volovyk O, et al: Analysis of magnetization transfer (MT) influence on quantitative mapping of T2 relaxation time. Magn Reson Med 82:145–158, 2019.
9. Xia Y, Moody JB, Alhadlaq H: Orientational dependence of T2 relaxation in articular cartilage: A microscopic MRI (microMRI) study. Magn Reson Med 48:460–469, 2002.
10. Alhadlaq HA, Xia Y: Modifications of orientational dependence of microscopic magnetic resonance imaging T2 anisotropy in compressed articular cartilage. Journal of Magnetic Resonance Imaging 22:665–673, 2005.
11. Mezer A, Rokem A, Berman S, et al: Evaluating quantitative proton-density-mapping methods. Hum Brain Mapp 37:3623–3635, 2016.
Figures