2459
Enabling Early Detection of Knee Osteoarthritis Using Diffusion-Relaxation Correlation Spectrum Imaging1Department of Radiology, Yueyang Hospital of Integrated Traditional Chinese and Western Medicine, Shanghai University of Traditional Chinese Medicine, Shanghai, China, 2Central Research Institue, United Imaging Healthcare, Shanghai, China
Synopsis
Keywords: Cartilage, Diffusion/other diffusion imaging techniques
Early OA is subclinical for anatomic change of cartilage, making it difficult for conventional MRI detection. This study is aimed to apply diffusion-relaxation correlation spectrum imaging (DR-CSI) to knee early-stage OA detection. DR-CSI compartment volume fractions VA, VB and VC had correlation with the modified Whole-Organ MR Imaging Scores (WORMS). VC had better ability than VA, VB, VD, T2 and ADC to discriminate early OA patients from healthy controls. The results illustrated that DR-CSI compartment volume fractions may be sensitive indicators for detecting early-stage degeneration in knee articular cartilage.Introduction
Articular cartilage is a key tissue for the early diagnosis of osteoarthritis (OA). As cartilage degenerates irreversibly, detecting and monitoring early OA has significant clinical implication. However, early OA is subclinical for anatomic change of cartilage, making it difficult for conventional MRI detection [1]. Cartilage degeneration occurs firstly at a molecular level, associating tightly with increased water content, depletion of proteoglycans, and disorganization of the collagen networks [2].Recently, an interesting approach combining the idea of compositional and multiparametric methods, named multi-dimensional correlation MRI, has been developed [3-4]. This study is aimed to apply one of the 2D-correlated MRI, diffusion-relaxation correlation spectrum imaging (DR-CSI), to knee early-stage OA detection.
Methods
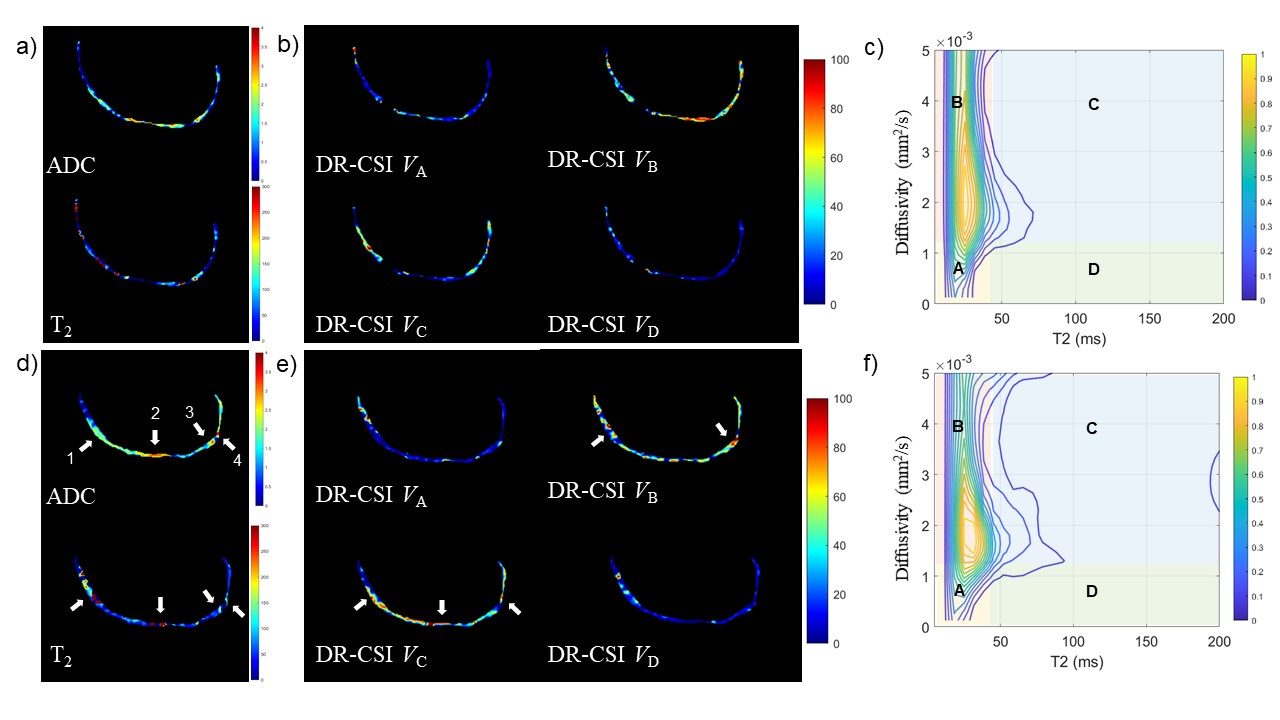
Forty early osteoarthritis (OA, Kellgren-Lawrence [KL] score 1 to 2; mean age, 58.6 years) and twenty-three healthy volunteers (mean age, 59.4 years) underwent DR-CSI scan by 3.0T MR (uMR780, United Imaging Healthcare, Shanghai, China). The structural abnormalities of articular cartilage were evaluated by the modified Whole-Organ MR Imaging Scores (WORMS).The DR-CSI measurements include spin-echo echo-planar diffusion-weighted images (SE-EP-DWI) with combinations of b-values (01, 2001, 4001, 8001, 10002, 12003 s/mm2, with the subscript denoting the number of averages) and echo times (TE = 90, 105, 120, 135 and 150 ms). DR-CSI assumes the signal to be [3] $$S(x,y,b,TE)\int\int f(x,y,D,T2){e}^{-bD}{e}^{TE/T2}\text{d}D\text{d}T2$$ where f is the spectral intensity to be fitted. Regions of interest (ROI) were manually placed on the high-resolution fat-suppressed proton-density-weighted images (PDWI) to cover the knee cartilage, and then mapped to the DWI images for DR-CSI post-processing. A spectrum segmentation was performed for quantitative analysis. All the spectra were divided into four compartments, A (slow D, short T2), B (fast D, short T2), C (fast D, long T2) and D (slow D, long T2), indicating four tissue components or compartments. The thresholds dividing these compartments (1.2 μm2/ms, 40 ms) were decided after a survey over previous studies of cartilage [5-7]. Volume fraction Vi for DR-CSI compartment i (A, B, C, D), and conventional ADC and T2 were obtained.
Vi were compared between Early OA and control group the Mann–Whitney U test or Student’s t-test where appropriate. Spearman’s correlation was used to assess the relationship between WORMS and DR-CSI Vi. Sensitivity, specificity, and positive and negative likelihood ratio (PLR, NLR) of Vi were assessed to determine the diagnostic accuracy for detection of early-stage degeneration.
Results
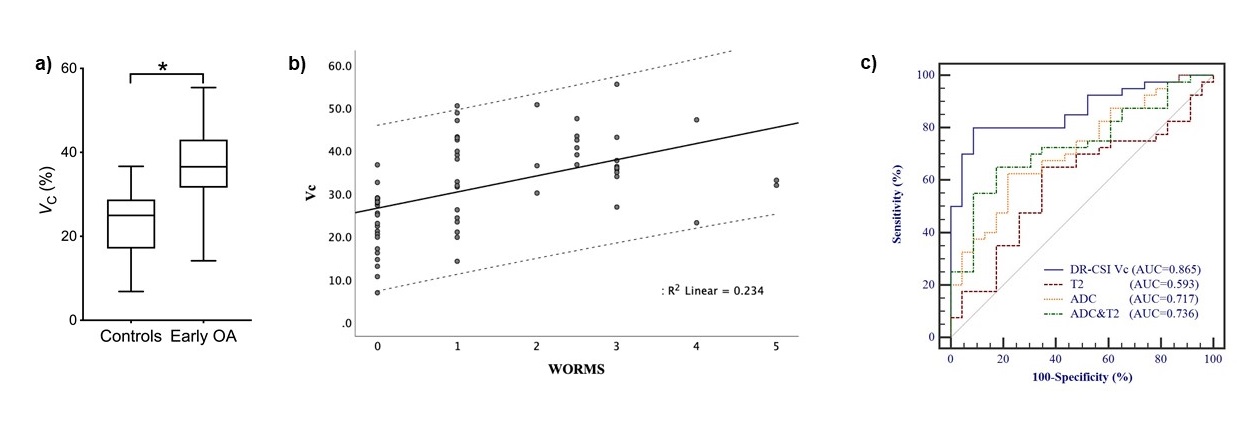
The representative volume fraction Vi for DR-CSI compartment i (A, B, C, D) maps at the knee joint (lateral cartilage) from a control subject and early OA are shown in Figure 1. Comparisons among the DR-CSI compartment volume fraction (VA, VB, VC, and VD) of the healthy controls and early OA patients are summarized in Figure 5. Early OA versus the controls had significantly higher VC (36.5% vs 23.1%), lower VA (10.2% vs 14.2%) and VB (45.6% vs 51.8%), but comparable VD (p>0.05). VA (rho=-0.463), VB (rho=-0.445) and VC (rho=0.572) had a moderate association with WORMS. No significant correlation was identified between VD and WORMS. VC had better ability than VA, VB, VD, T2 and ADC to discriminate early OA patients from healthy controls (area under the curve, 0.87). Sensitivity, specificity, PLR, and NLR of VC with cutoff value 28.9% were 80.0% (95% CI, 64.4% - 90.9%), 91.3% (72.0% - 98.9%), 9.20% (7.5% - 11.2%), and 0.22% (0.05% - 0.9%).Discussion
Our results showed that DR-CSI VC has a clear positive correlation with WORMS of articular cartilage, and could be a better marker for the diagnosis of early OA than conventional ADC and T2 value. The conclusion that cartilage tissue of OA holds more components with high diffusivity and high T2, to some extent, was in agreement with some previous reports using T2 mapping or DWI sequence alone [5,8-9]. The cartilage tissue ultrastructure deterioration leads to increased hydration and loss of collagen and proteoglycans, enhancing the water permeability and average diffusion rate of cartilage, and finally results in lift of signal contribution from high diffusivity and long T2 compartment [10].Spatial distribution of different compartments could be obtained, displayed by Vi maps, as a tool for diagnosis. Although these V maps have inherent association with ADC and T2 maps, extra information can be found. Emphasis could be put on areas with large C contribution, where cartilage degeneration might have begun.
Limitations
First, due to lack of absence of arthroscopy for the histopathological reference standard, accurate association between OA and histology is not achieved. Second, the shortest TE is 90 ms long, causing the decay of some cartilage signal.Conclusions
DR-CSI compartment volume fractions may be sensitive indicators for detecting early-stage degeneration in knee articular cartilage.Acknowledgements
We thank the participants and Ruiping Wang, PhD., Drs. Wei Fang, Ze Yuan and Weiqin Lu, for their invaluable assistance with statistical analysis, participant selection, and technical support.References
1. Roemer FW, Guermazi A, Demehri S, Wirth W, Kijowski R. Imaging in Osteoarthritis. Osteoarthritis Cartilage. 2022;30(7):913-34.
2. Hunter DJ, Bierma-Zeinstra S. Osteoarthritis. The Lancet. 2019;393(10182):1745-59.
3. Kim D, Doyle EK, Wisnowski JL, Kim JH, Haldar JP. Diffusion-relaxation correlation spectroscopic imaging: A multidimensional approach for probing microstructure. Magn Reson Med. 2017;78(6):2236-49.
4. Benjamini D, Iacono D, Komlosh ME, Perl DP, Brody DL, Basser PJ. Diffuse axonal injury has a characteristic multidimensional MRI signature in the human brain. Brain. 2021;144(3):800-16.
5. Raya JG, Horng A, Dietrich O, et al. Articular cartilage: in vivo diffusion-tensor imaging. Radiology. 2012;262(2):550-9
6. Mlynarik V, Sulzbacher I, Bittsansky M, Fuiko R, Trattnig S. Investigation of apparent diffusion constant as an indicator of early degenerative disease in articular cartilage. J Magn Reson Imaging. 2003;17(4):440-4.
7. Dunn TC, Lu Y, Jin H, Ries MD, Majumdar S. T2 relaxation time of cartilage at MR imaging: comparison with severity of knee osteoarthritis. Radiology. 2004;232(2):592-8.
8. Dunn TC, Lu Y, Jin H, Ries MD, Majumdar S. T2 relaxation time of cartilage at MR imaging: comparison with severity of knee osteoarthritis. Radiology. 2004;232(2):592-8.
9. Liebl H, Joseph G, Nevitt MC, et al. Early T2 changes predict onset of radiographic knee osteoarthritis: data from the osteoarthritis initiative. Ann Rheum Dis. 2015;74(7):1353-9.
10. Guermazi A, Alizai H, Crema MD, Trattnig S, Regatte RR, Roemer FW. Compositional MRI techniques for evaluation of cartilage degeneration in osteoarthritis. Osteoarthritis Cartilage. 2015;23(10):1639-53.
Figures