2456
Assessing the effects of spin lock time duration on T1ρ relaxation times for imaging of the articular cartilage in the knee1School of Medicine, Queen's University, Kingston, ON, Canada, 2Emory Sports Performance And Research Center, Flowery Branch, GA, United States, 3Neuroscience Graduate Program, University of Cincinnati, Cincinnati, OH, United States, 4Emory Sports Medicine Center, Atlanta, GA, United States, 5Department of Orthopaedics, Emory University School of Medicine, Atlanta, GA, United States, 6Department of Kinesiology, University of North Carolina at Greensboro, Greensboro, NC, United States, 7GE Healthcare, Atlanta, GA, United States, 8School of Biomedical Engineering, Shanghai Jiao Tong University, Shanghai, China, 9Department of Orthopaedics, Queen's University, Kingston, ON, Canada, 10The Micheli Center for Sports Injury Prevention, Waltham, MA, United States
Synopsis
Keywords: Cartilage, Quantitative Imaging, T1rho, knee
There is limited standardization of T1ρ acquisition parameters with respect to spin lock times (TSLs). Shorter TSL durations are susceptible to underestimating knee cartilage T1ρ relaxation times, warranting optimization for maximal measurement stability. Additionally, vertical estimation of T1ρ relaxation times throughout cartilage layers is limited. Here, we utilized 40 healthy knees to demonstrate enhanced T1ρ relaxation time measurement stability with maximum TSLs of 90 to 120ms compared to shorter TSL durations. Depth-specific differences in T1ρ were further compartmentalized into deep and superficial knee cartilage layers, highlighting the potential for T1ρ to indirectly and non-invasively evaluate proteoglycan content across cartilaginous layers.INTRODUCTION
Osteoarthritis (OA) is a progressive joint disease whereby co-localized intra-articular inflammation leads to the loss of intra-articular cartilage.1,2 MR-based imaging, such as T1ρ, has provided an emerging surrogate to monitor the degenerative effects of knee OA.3,4 This is because T1ρ correlates inversely with cartilaginous proteoglycan content, which, in the context of OA, decreases over time in parallel with the cartilage thinning process.5-8To date, there remains a lack of standardization for T1ρ acquisition with respect to spin lock times (TSLs), which define the duration of the magnetization relaxing under the influence of the spin-lock pulse.9,10 Shorter TSLs (i.e., up to 40ms) may inherently underestimate T1ρ relaxation times for cartilage, especially in diseased cartilaginous regions where longer relaxation times are expected.11,12 There is also limited literature reporting vertical differences in T1ρ relaxation times at 3 Tesla, despite knowledge that proteoglycan content varies across the depth of the cartilage.13,14
Here, we implemented two T1ρ acquisitions using TSL durations derived from prior literature [0-50ms] and extended TSLs with greater maximal durations [0-120ms].9,10 The purpose was to 1) compare the measurement stability between sets of T1ρ acquisitions, and 2) evaluate differences in resultant depth-specific relaxation times within the articular cartilage.
METHODS
The study was approved by the institutional review board at Emory University and data was collected at Emory Sports Performance And Research Center (SPARC; Flowery Branch, GA, USA). All participants were consented and screened for MRI safety. Twenty healthy subjects (10M/10F; 22.2 ± 3.4 years; 78.0 ± 13.0 kg; 176 ± 12 cm) with no history of knee injuries or current pain underwent sequential imaging of their left and right knees (40 total datasets).Imaging data was acquired on a 3.0 Tesla GE SIGNA Premier Scanner (General Electric; Milwaukee, Wisconsin) using an 18-channel T/R knee coil (Quality Electrodynamics, Mayfield Village, OH, USA). The imaging protocol included two sagittal T1ρ-prepared 3D MAPSS (magnetization-prepared angle-modulated partitioned-k-space SPGR) sequences with identical parameters (including a spin lock power at 500 Hz) except TSLs. The standard T1ρ (T1ρ-standard) used six TSLs (TSLstandard = 0, 10, 20, 30, 40, 50ms). The extended T1ρ version (T1ρ-extended) also used six TSLs with longer maximal durations (TSLextended = 0, 10, 30, 60, 90, 120ms). Additional parameters for both sequences included sampling resolution (0.3125 x 0.3125 x 3 mm), TR/TE (4.5 ms/minimum), flip angle (70°), acquisition/reconstruction matrices (192 x 192 / 512 x 512), number of slices (32), total scan time (7 min. 49 sec.).
Both acquisitions were processed identically to compute T1ρ relaxation times within the cartilage. First, the baseline 0-millisecond TSL echos were co-registered to an in-house atlas.15-18 Warping fields were inverted back into native space allowing for partial volume classification of the bony structures (i.e., femur, fibula, patella, and tibia) and articular cartilage (i.e., femoral condyle, lateral tibial condyle, medial tibial condyle, patellofemoral) (FIGURE 1). From there, voxelwise T1 maps were computed using:
$$S_((TSL))=S_0∙e^((-TSL⁄T1_ρ ))$$
where S represents the signal intensity, TSL corresponds to the duration of the TSL (ms), S0 is the signal intensity when TSL equals 0, and T1ρ is the constant relaxation time in the rotating frame (ms) (FIGURE 1).
To assess for depth-specific differences in T1ρ relaxation times, a 12 x 10 mm volume within the weight bearing regions of the medial and lateral tibiofemoral compartments were split into five vertical layers (FIGURE 2). This was done by dividing the orthogonal X/Y planes of the volume into five layers along Z, in attempt to align loosely with known zones of cartilage.13
Mean T1ρ relaxation times were computed for the whole volume, and each layer. Intra-subject coefficient of variation (COV) was compared across the T1ρ measurements using a ratio of the group’s mean and standard deviation.
Regional estimates between the T1ρ acquisitions were compared using Mann-Whitney U-tests. For intra-layer comparisons within T1ρ measurements, Kruskal-Wallis testing was used with post-hoc testing based on statistical significance, using an established a priori at p < 0.05.
RESULTS/DISCUSSION
Significantly higher T1ρ relaxation times were documented for T1ρ-extended (FIGURE 3). The T1ρ-extended version also demonstrated more consistent intra-subject measurements compared to T1ρ-standard (i.e., lower COVs), with no layers being particularly higher than others within each acquisition (FIGURE 4).The depth-specific differences across the layers for T1ρ (T1ρ-standard and T1ρ-extended versions) mostly compartmentalized the cartilage layers into deep (layers 1-2) and more superficial (layers 4-5) regions, with distinct significant differences in T1ρ as summarized in FIGURE 5. Our results corroborate existing literature suggesting that deeper cartilaginous layers are denser in proteoglycan content (i.e., lower T1ρ relaxation times), emphasizing the sensitive nature of T1 relaxation times as an indirect substrate for proteoglycan content.13,19,20,14
CONCLUSION
Future studies using T1ρ to evaluate knee cartilage should consider longer TSLs to reduce intra-subject variability. Our data indicate including maximum TSLs of 90 to 120ms compared to shorter TSLs (maximum of 50ms) may be more appropriate for estimation of T1ρ relaxation times, especially for degenerative diseases like OA where pathological changes have been associated with increased T1ρ relaxation times.21 Future research may also consider the present layer-based analyses within longitudinal designs and pathologic populations to advance methods towards earlier identification of OA.Acknowledgements
No acknowledgement found.References
1. Arden NK, Perry TA, Bannuru RR, et al. Non-surgical management of knee osteoarthritis: comparison of ESCEO and OARSI 2019 guidelines. Nat Rev Rheumatol. 2021;17(1):59-66.
2. Pinto Barbosa S, Marques L, Sugawara A, et al. Predictors of the Health-Related Quality of Life (HRQOL) in SF-36 in Knee Osteoarthritis Patients: A Multimodal Model With Moderators and Mediators. Cureus.2022;14(7):e27339.
3. Wei H, Dibb R, Decker K, et al. Investigating magnetic susceptibility of human knee joint at 7 Tesla. Magn Reson Med. 2017;78(5):1933-1943.
4. Wei H, Lin H, Qin L, et al. Quantitative susceptibility mapping of articular cartilage in patients with osteoarthritis at 3T. J Magn Reson Imaging. 2019;49(6):1665-1675.
5. Regatte RR, Akella SV, Wheaton AJ, et al. 3D-T1rho-relaxation mapping of articular cartilage: in vivo assessment of early degenerative changes in symptomatic osteoarthritic subjects. Acad Radiol. 2004;11(7):741-749.
6. Regatte RR, Akella SV, Lonner JH, Kneeland JB, Reddy R. T1rho relaxation mapping in human osteoarthritis (OA) cartilage: comparison of T1rho with T2. J Magn Reson Imaging. 2006;23(4):547-553.
7. Akella SV, Regatte RR, Gougoutas AJ, et al. Proteoglycan-induced changes in T1rho-relaxation of articular cartilage at 4T. Magn Reson Med. 2001;46(3):419-423.
8. Duvvuri U, Kudchodkar S, Reddy R, Leigh JS. T(1rho) relaxation can assess longitudinal proteoglycan loss from articular cartilage in vitro. Osteoarthritis Cartilage. 2002;10(11):838-844.
9. Atkinson HF, Birmingham TB, Moyer RF, et al. MRI T2 and T1rho relaxation in patients at risk for knee osteoarthritis: a systematic review and meta-analysis. BMC Musculoskelet Disord. 2019;20(1):182.
10. Zibetti MVW, Sharafi A, Regatte RR. Optimization of spin-lock times in T1rho mapping of knee cartilage: Cramer-Rao bounds versus matched sampling-fitting. Magn Reson Med. 2022;87(3):1418-1434.
11. Pfeiffer SJ, Spang J, Nissman D, et al. Gait Mechanics and T1rho MRI of Tibiofemoral Cartilage 6 Months after ACL Reconstruction. Med Sci Sports Exerc. 2019;51(4):630-639.
12. Pfeiffer SJ, Spang JT, Nissman D, et al. Association of Jump-Landing Biomechanics With Tibiofemoral Articular Cartilage Composition 12 Months After ACL Reconstruction. Orthop J Sports Med. 2021;9(7):23259671211016424.
13. Sophia Fox AJ, Bedi A, Rodeo SA. The basic science of articular cartilage: structure, composition, and function. Sports Health. 2009;1(6):461-468.
14. Eschweiler J, Horn N, Rath B, et al. The Biomechanics of Cartilage-An Overview. Life (Basel). 2021;11(4).
15. Jenkinson M, Beckmann CF, Behrens TE, Woolrich MW, Smith SM. Fsl. Neuroimage. 2012;62(2):782-790.
16. Smith SM, Jenkinson M, Woolrich MW, et al. Advances in functional and structural MR image analysis and implementation as FSL. Neuroimage. 2004;23 Suppl 1:S208-219.
17. Jenkinson M, Bannister P, Brady M, Smith S. Improved optimization for the robust and accurate linear registration and motion correction of brain images. Neuroimage. 2002;17(2):825-841.
18. Jenkinson M, Smith S. A global optimisation method for robust affine registration of brain images. Med Image Anal. 2001;5(2):143-156.
19. Singh A, Haris M, Cai K, Kogan F, Hariharan H, Reddy R. High resolution T1rho mapping of in vivo human knee cartilage at 7T. PLoS One. 2014;9(5):e97486.
20. Regatte RR, Akella SV, Borthakur A, Kneeland JB, Reddy R. Proteoglycan depletion-induced changes in transverse relaxation maps of cartilage: comparison of T2 and T1rho. Acad Radiol. 2002;9(12):1388-1394.
21. Wang YX, Zhang Q, Li X, Chen W, Ahuja A, Yuan J. T1rho magnetic resonance: basic physics principles and applications in knee and intervertebral disc imaging. Quant Imaging Med Surg. 2015;5(6):858-885.
Figures
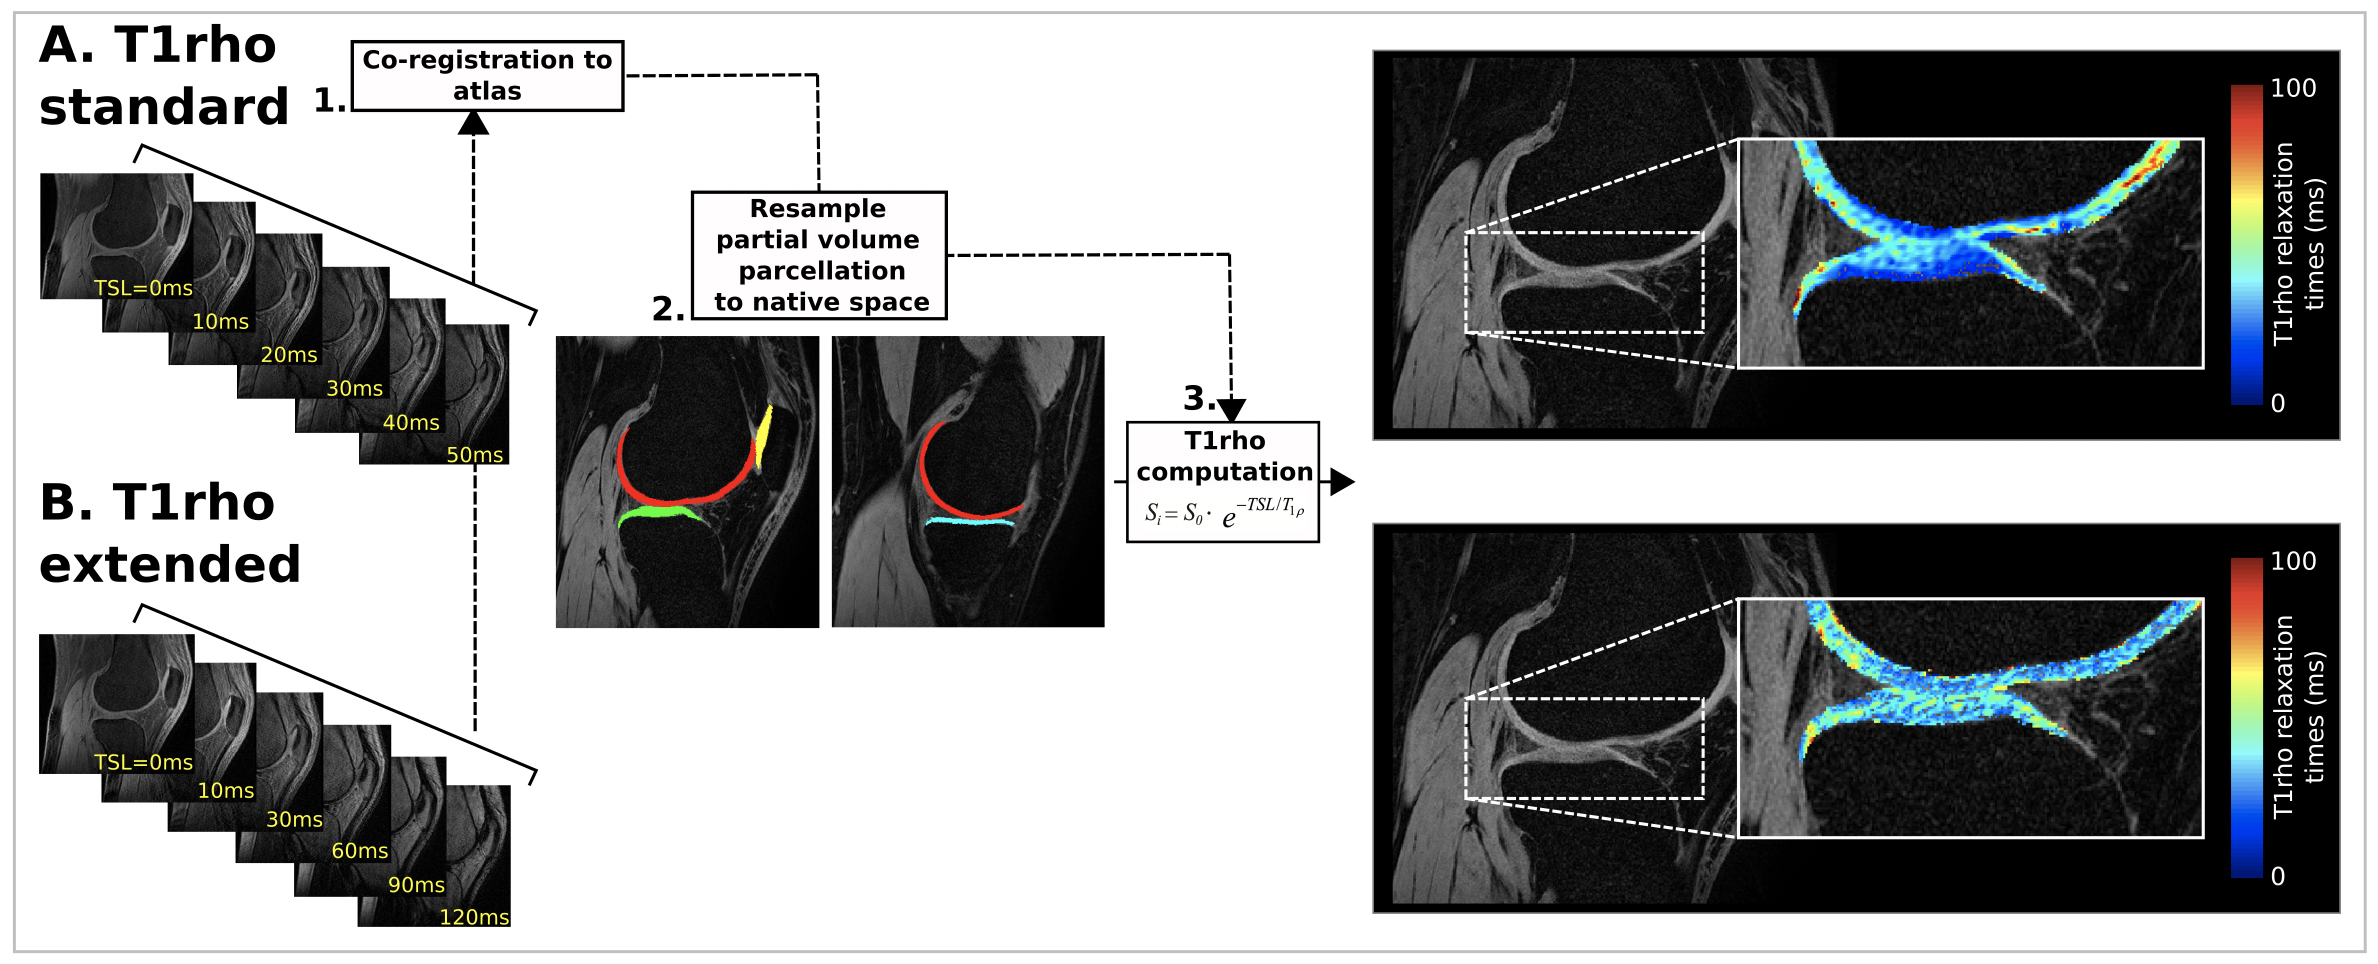
Figure 1. Schematic workflow for computation of voxelwise T1ρ relaxation times within the articular cartilage
Sample sagittal slices for each spin lock times (TSLs), for each T1ρ version (i.e., standard (A) and extended (B)), are shown on the left-hand side. Echoes were first co-registered linearly with an atlas (1) allowing for deprojection of the partial volume parcellation (2) and voxelwise computation of the T1ρ maps (3). Resultant voxelwise T1ρ maps are shown on the right-hand side, for each version (i.e., standard (A) and extended (B)).
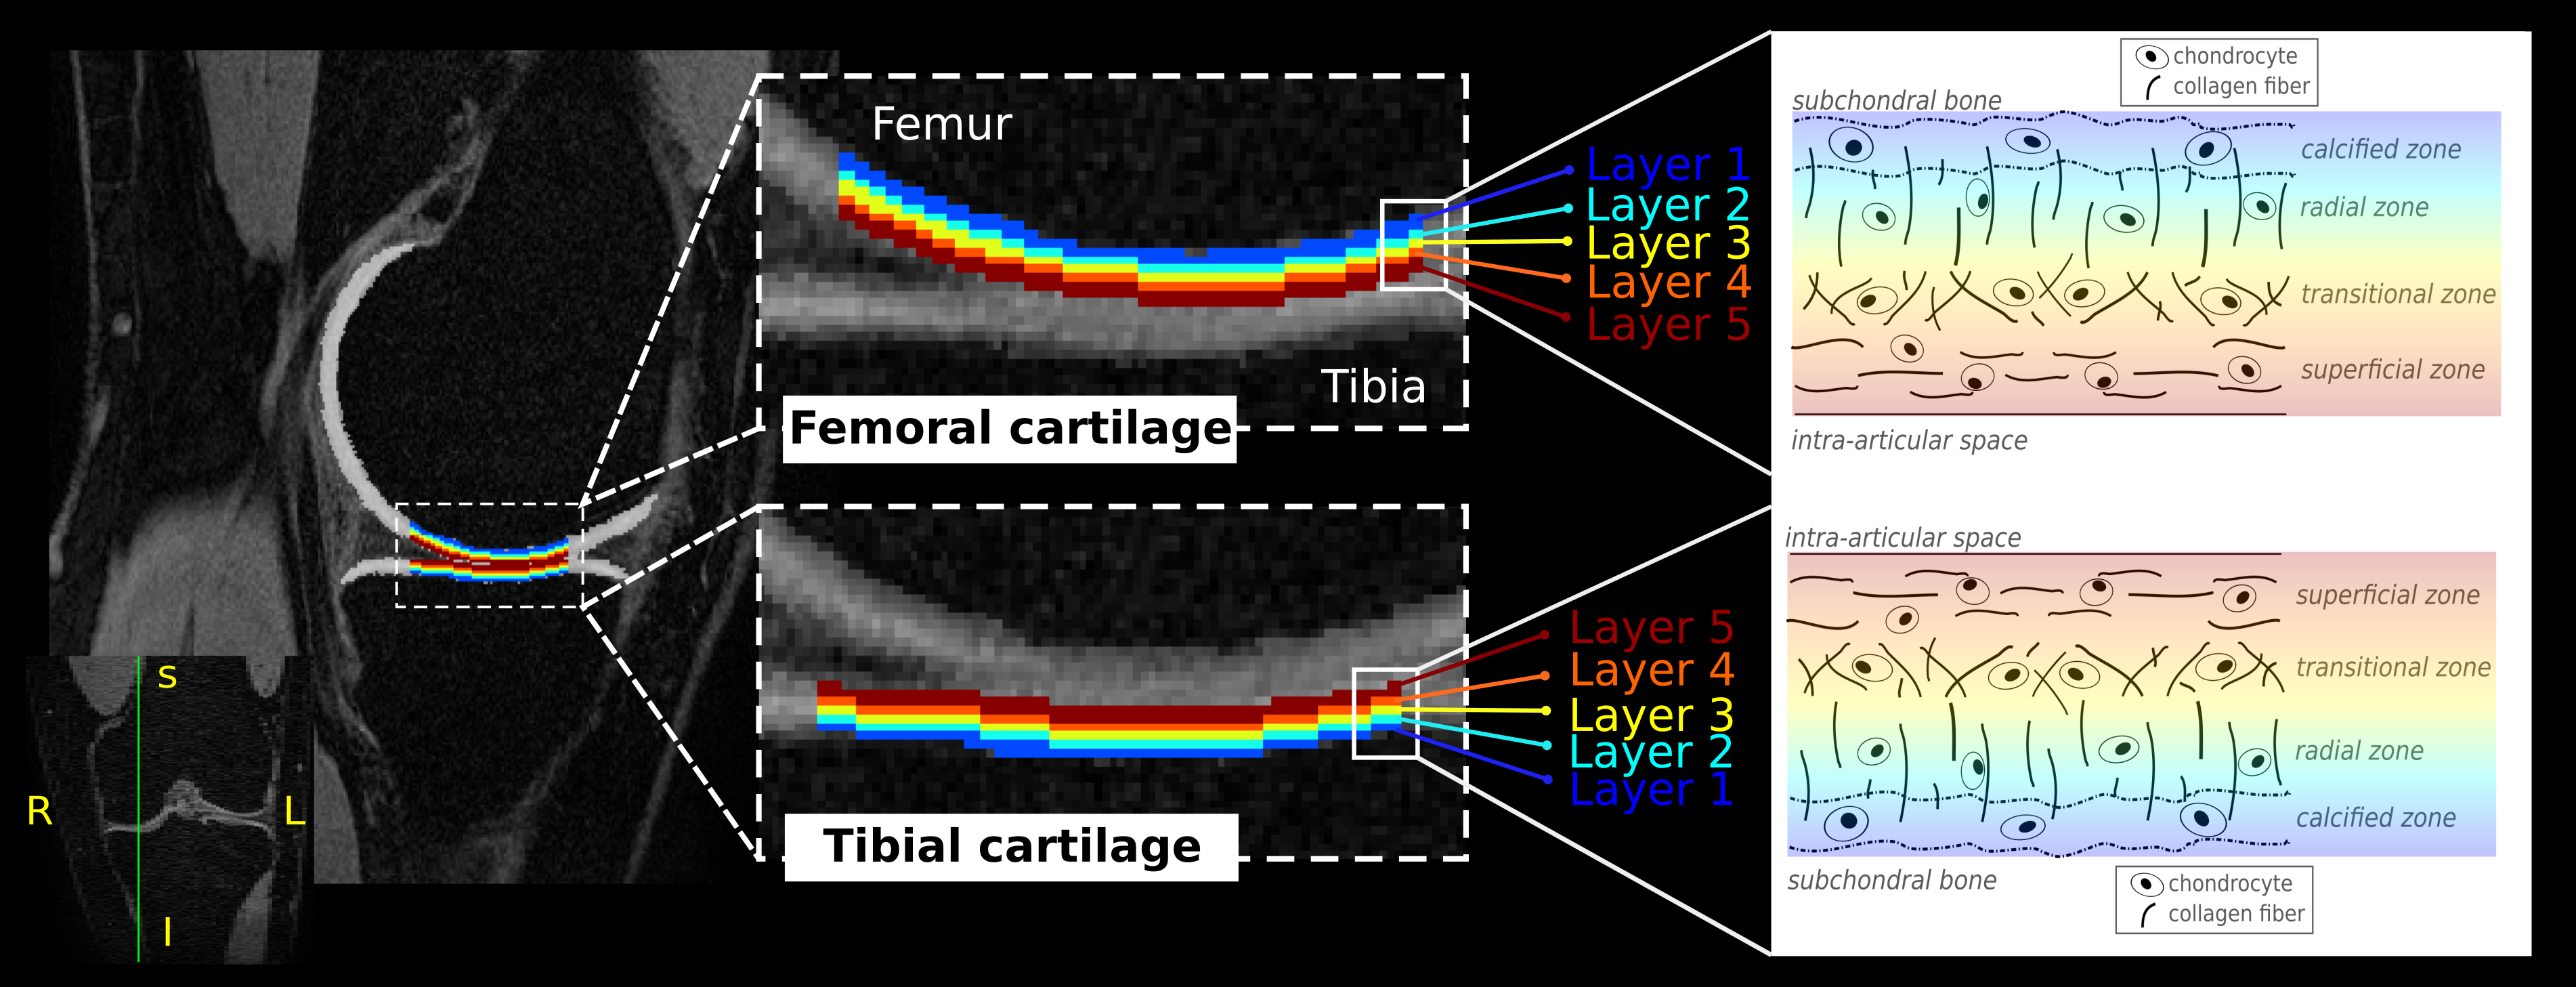
Figure 2. Layer-based segmentation of the femoral and tibial articular cartilage in the knee
An example of the femoral (top) and tibial (bottom) cartilage loading regions-of-interest is provided. Layer 1 (blue; deep) is always closest to the subchondral bone, moving toward layer 5 (red; superficial), which is closest to the intra-articular space. A structural schema of the different zones making up the cartilaginous matrix is drawn to act as a reference (right-hand side).
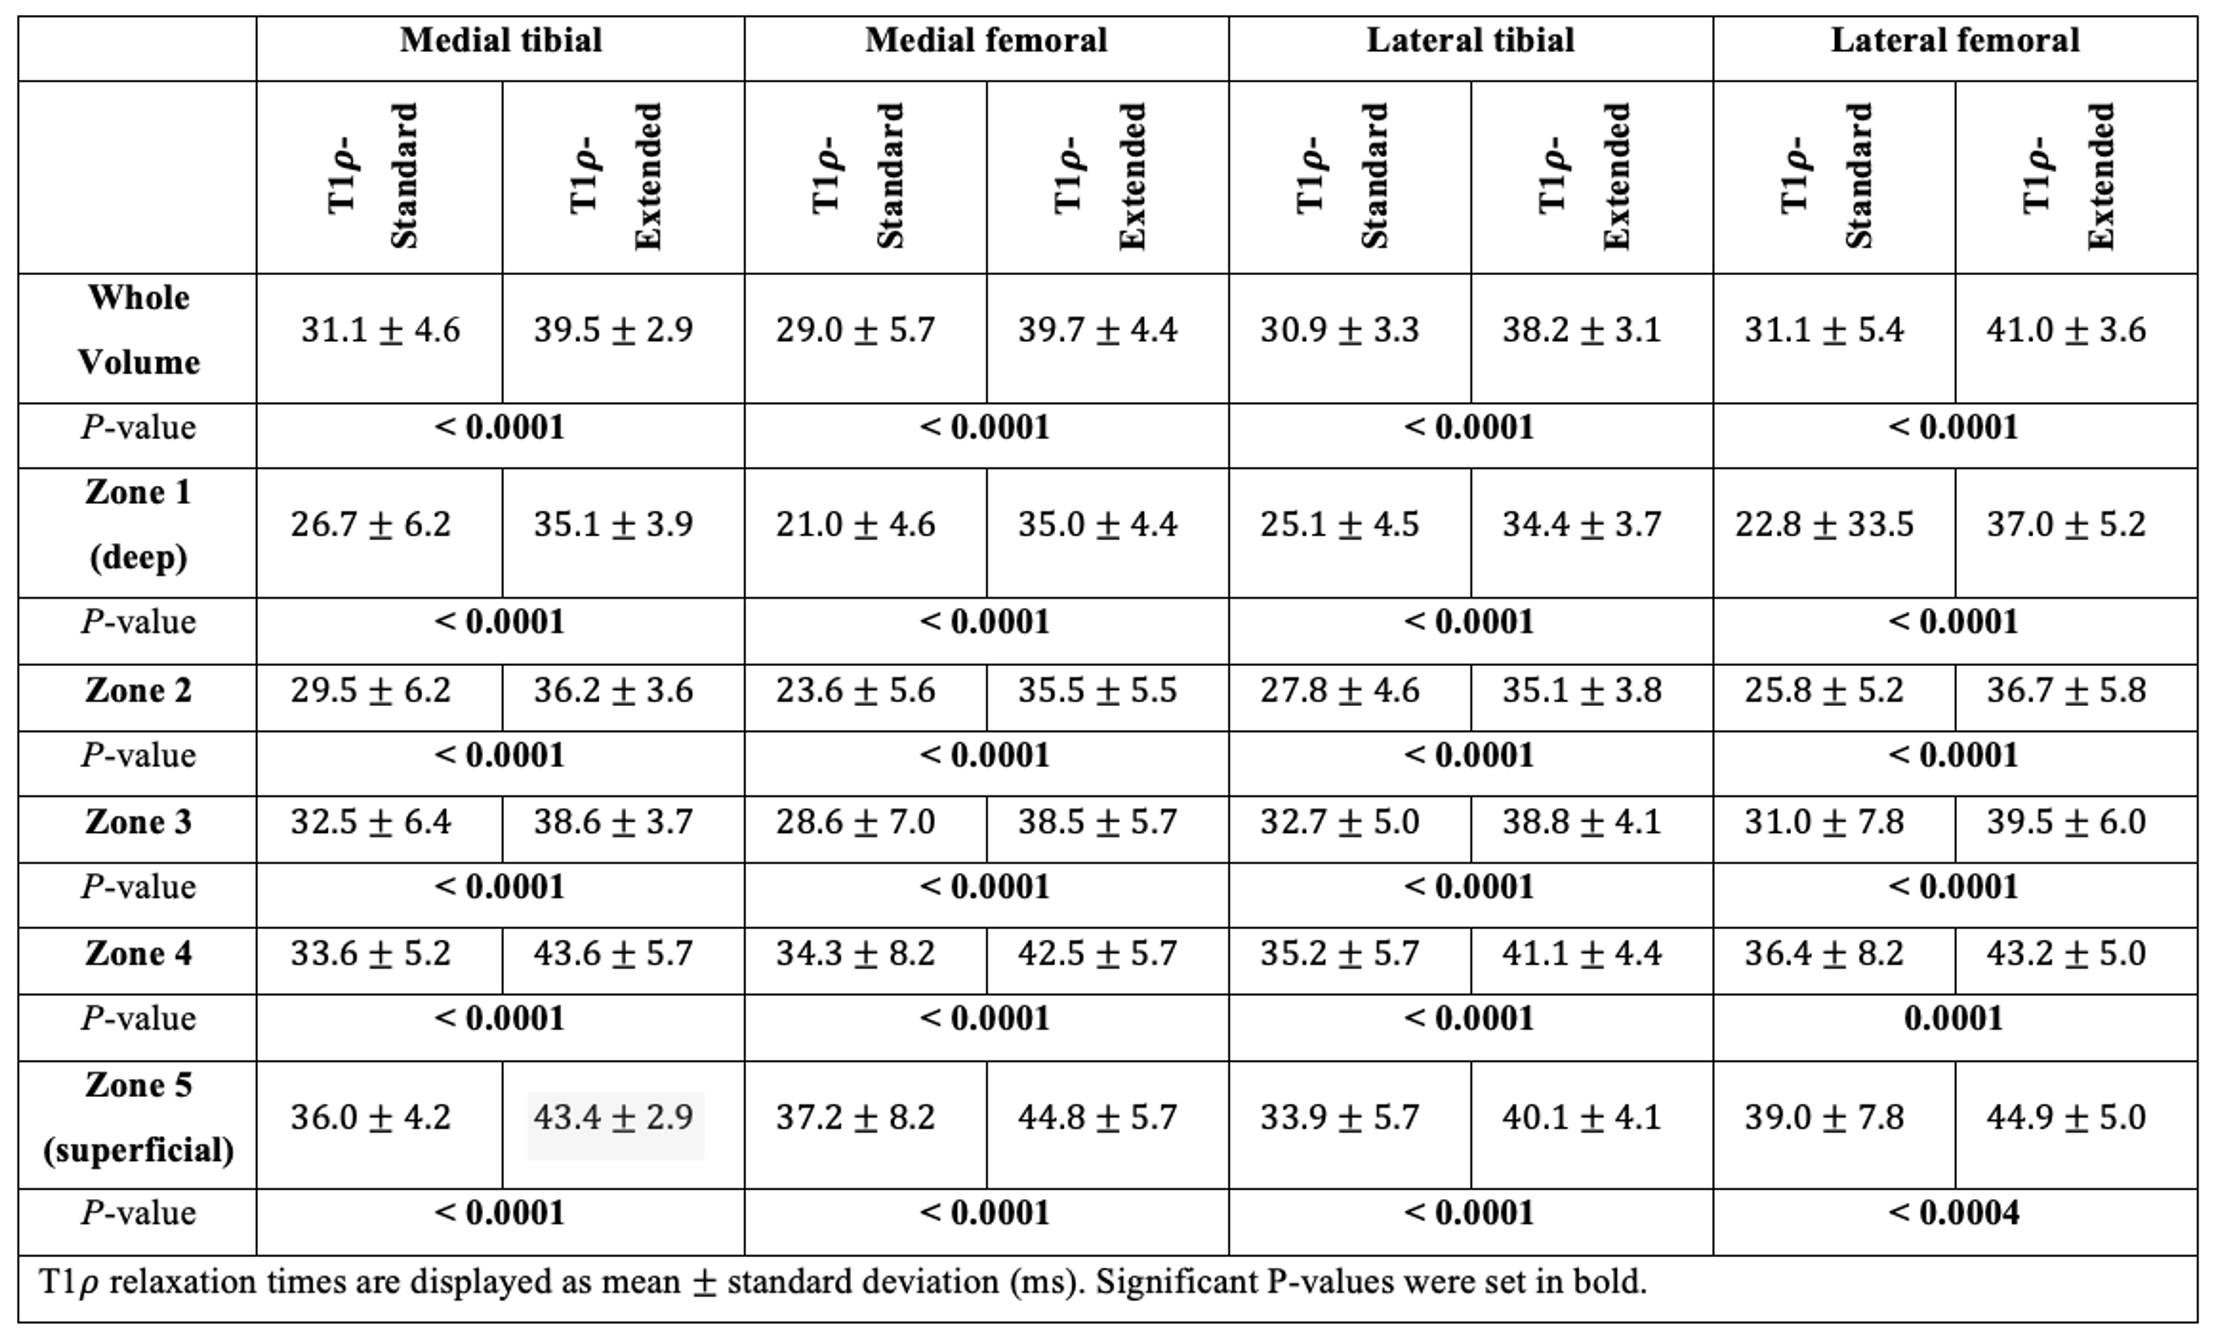
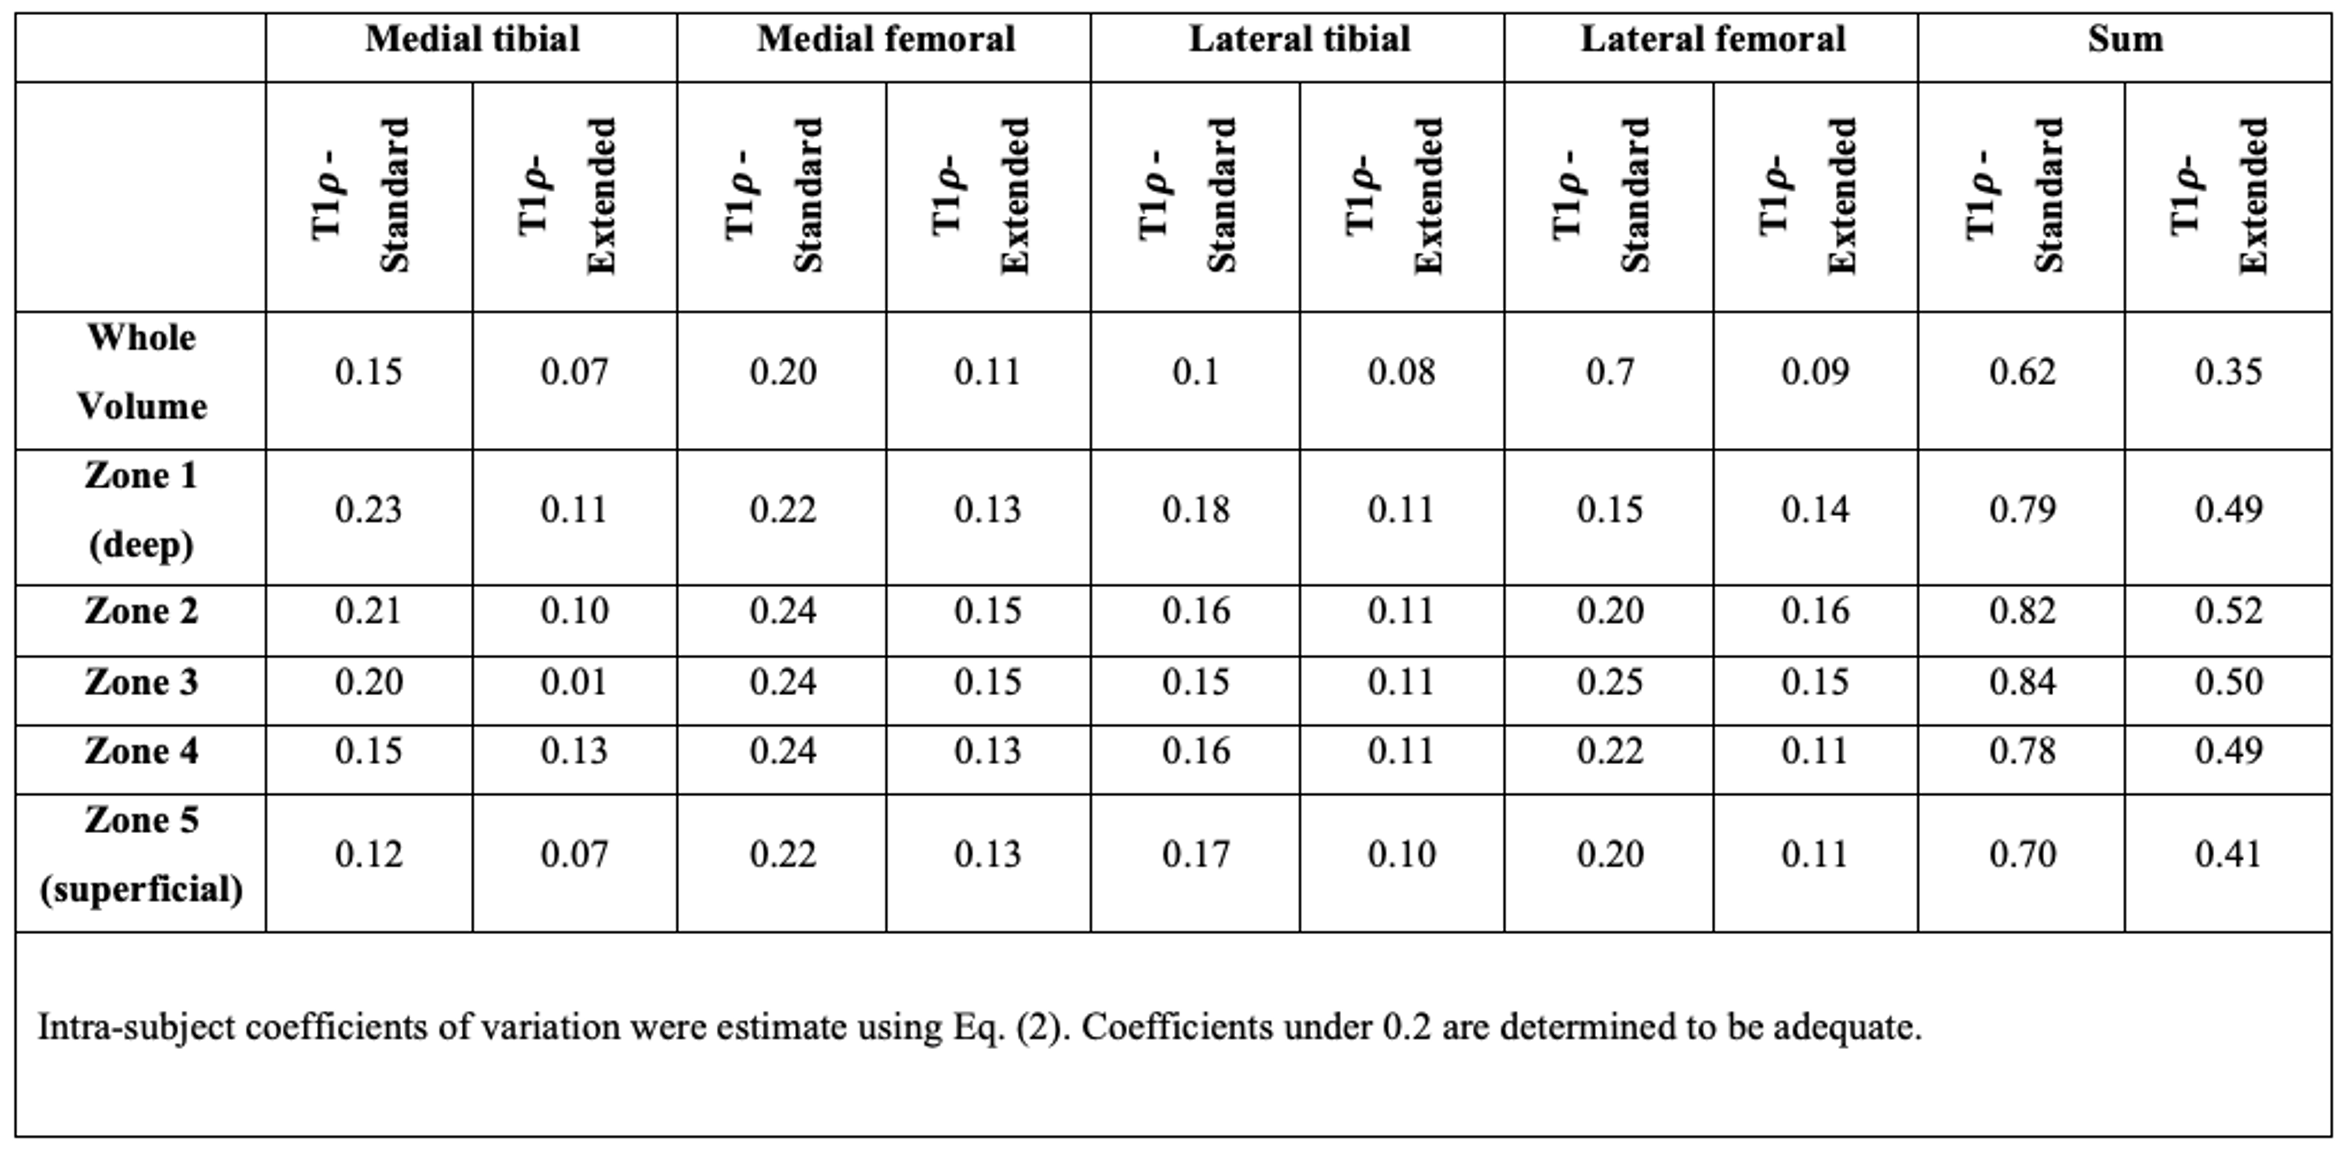
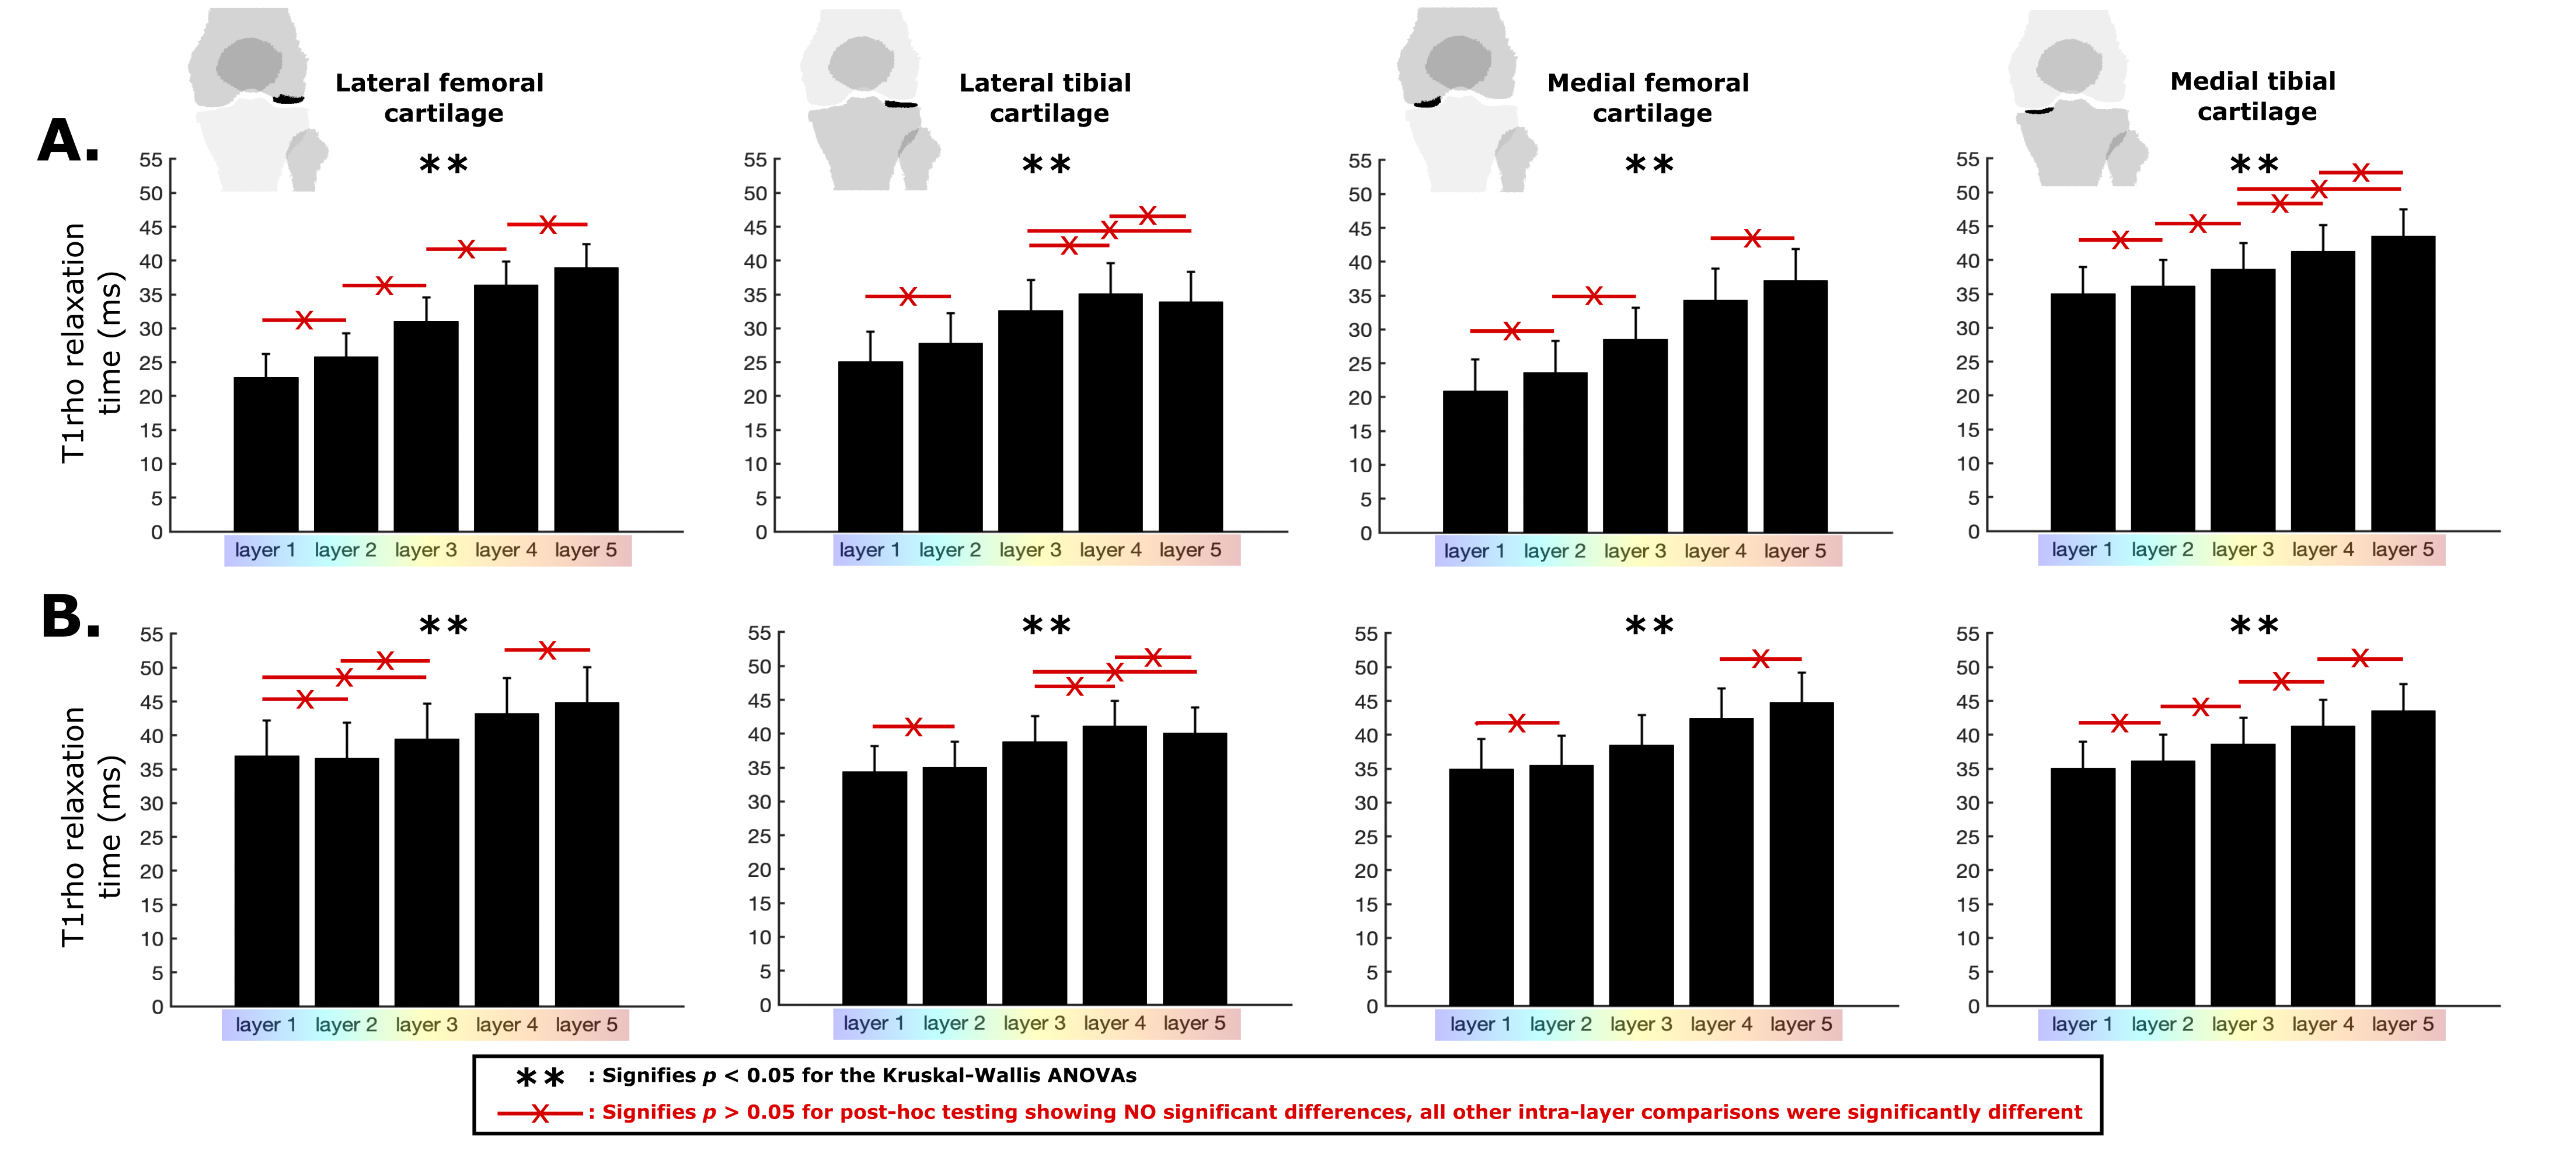
Figure 5. Results from the layer-based analysis of T1ρ measurements within healthy knees
T1ρ relaxation times ((A), standard version; (B), extended version) were compared across layers using non-parametric Kruskal-Wallis ANOVAs (pNormality < 0.05). ** Indicates statistical significance at p < 0.05. Post-hoc tests revealed specific differences between layers, which were common. To avoid overcrowding the figure, only within-layer post-hoc comparisons with p > 0.05 (NON-statistically significant) were highlighted using the “x” line (red).