2455
T1rho Sequences with FASE, UTE, and MAPSS Acquisitions for Knee Evaluation1Radiology, University of California, San Diego, La Jolla, CA, United States, 2Canon Medical Systems Corp, Otawara, Japan, 3VA San Diego Healthcare System, San Diego, CA, United States
Synopsis
Keywords: Cartilage, Tissue Characterization, T1rho
Three T1rho sequences based using 3D FASE, 3D UTE, and 3D MAPSS acquisitions were developed and compared by imaging agarose phantoms and normal human knees. The sequences utilize 4 to 6 spin lock times, and can be acquired in about 5 min or less. On phantoms, all three sequences resulted in consistent T1rho values that decreased with increasing agarose concentration, similar to past reports. T1rho values of cartilage and menisci were also in line with previously reported values. This work will be useful for evaluating knee osteoarthritis and other musculoskeletal diseases.Introduction
While conventional T1 or T2 MR imaging have been available for some time, the techniques may be suboptimal for evaluation of biological tissues containing macromolecules such as articular cartilage. T1rho imaging1-3 has been proposed as a more sensitive alternative. T1rho relaxation is achieved with an external spin-lock RF pulse, which locks the spin magnetization in the transverse plane and slows the relaxation process. T1rho values of cartilage changes with osteoarthritis,4 making it a promising quantitative technique. Purpose of the study was to compare three T1rho sequences of 3D fast advanced spin echo (FASE), 3D ultrashort echo time (UTE), and 3D magnetization-prepared angle-modulated partitioned k-space spoiled gradient echo snapshots (MAPSS), for musculoskeletal imaging.Methods
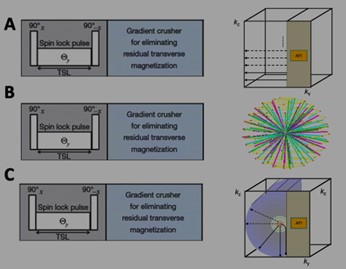
T1rho Sequences: We developed the following T1rho sequences using a rotary echo spin lock preparation pulse followed by 3D FASE (aka 3D single-shot fast spin echo) (Figure 1A) or 3D radial UTE (Figure 1B) acquisitions. The third sequence was 3D MAPSS (Figure 1C), which is a prototype of QIBA compliant compatible implementation provided from the manufacturer.Agarose Phantoms: The agarose phantoms consisted of 45 ml of agarose gel placed in 50ml plastic centrifuge tubes. The phantoms had an agarose concentration (w/w) of the 2%, 3%, and 4%, respectively, as described previously,5 and were scanned at room temperature. After a number of initial tastings, we settled on both 6 TSL points for both sequences.
Human Subjects: Bilateral knees of 5 asymptomatic volunteers (4 male, 1 female, ages 31 to 66 years old) were included for 3D FASE and 3D UTE imaging, and a subset of 3 volunteers (2 male, 1 female, ages 49 to 66 years) were included for 3D MAPSS imaging.
MRI: MR imaging was performed on a 3-Tesla Canon Galan scanner using a 16-channel transmit and receive knee coil. Phantoms were imaged transversely. Knees were imaged sagittal covering lateral and medial compartments. Scan parameters were:
3D FASE T1rho: repetition time (TR)/echo time (TE) = 1497/10 ms, bandwidth =651 Hz, flip angle (FA) = 90°, echo numbers=5. Echo train length (ETL) = 162, FOV = 220 × 220 mm, image matrix = 320 × 320, slice thickness=3 mm, acquisition time = 2 min 12 s. TSL=1, 16, 31, 46, 61, 76. Spin lock frequency=250 Hz.
3D UTE T1rho: TR/TE =3.7 / 0.096 ms, bandwidth = 488 Hz, FA = 5°, ETL = 1, FOV=200x200 mm, matrix=256x256, slice thickness=2.0 mm, acquisition time = 5 min 32 s. number of projections = 16,000. TSL=1, 21, 41, 61 ms. Spin lock frequency=250 Hz.
3D MAPSS (FAST3D) T1rho: TR/TE =6.0 / 2.8 ms, bandwidth = 391 Hz, FA = 20°, ETL = 1, FOV=230x230 mm, matrix=192x192, slice thickness=3.0 mm, acquisition time = 2 min 34 s. TSL=0, 10, 40, and 80 ms. Spin lock frequency=250 Hz.
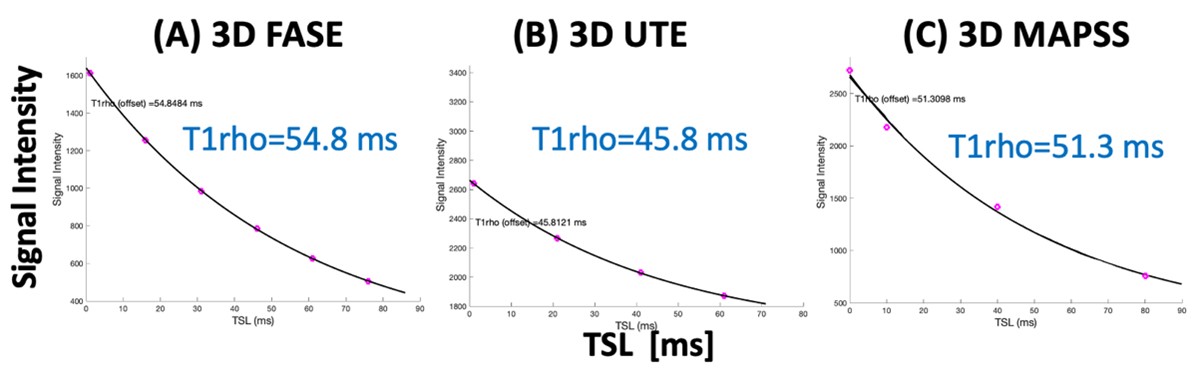
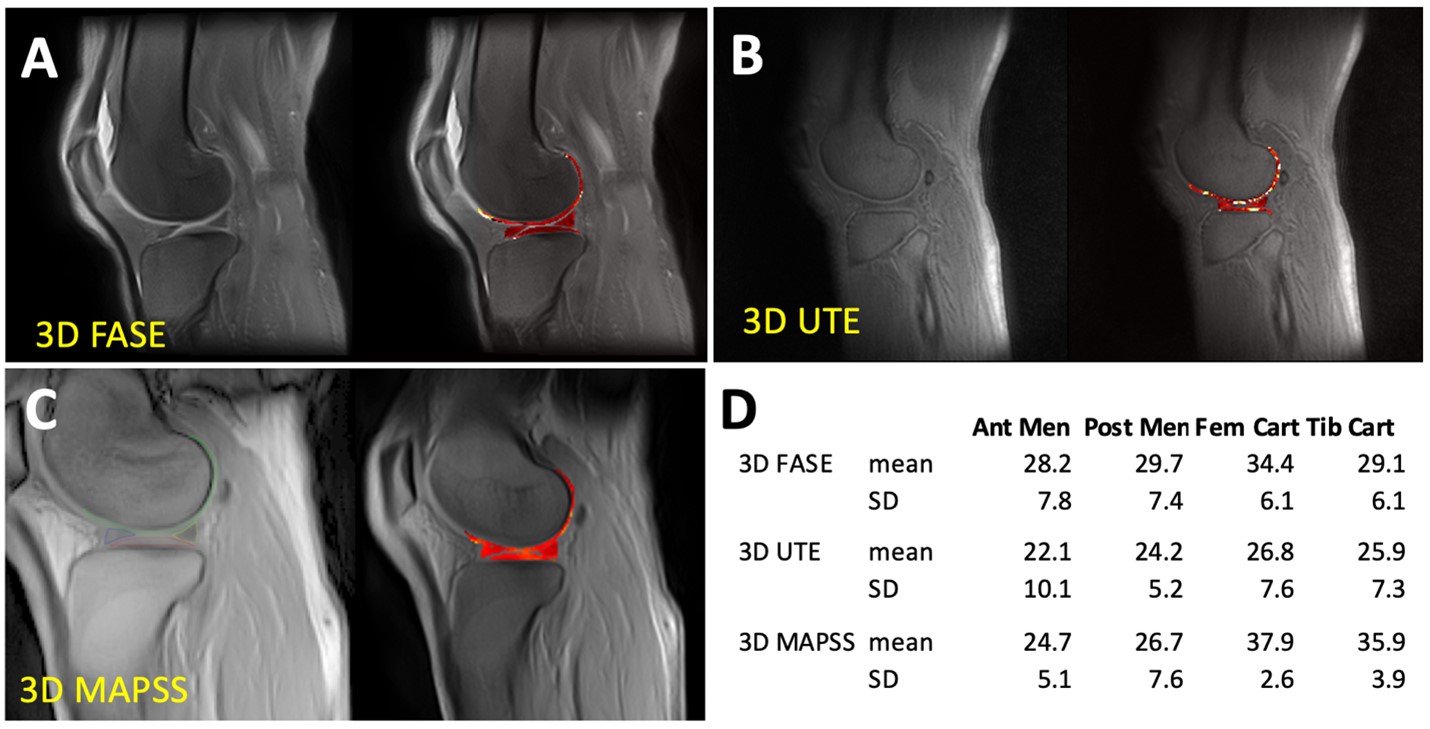
Image Analysis: For phantoms, circular regions of interest (ROI) were placed in the center of each agarose phantom to determine average T1rho values and create color maps (Figure 2, color). For human knees, four regions of interest (Figure 5, color) of femoral cartilage, tibial cartilage, anterior meniscus, and posterior meniscus were drawn in lateral and medial compartments to determine T1rho values by averaging signal intensity of all voxels within each ROI then fitting (Figure 3) using a nonlinear least square fitting routine to a simple mono-exponential decay function similar to T2 relaxation.
Results and Discussion
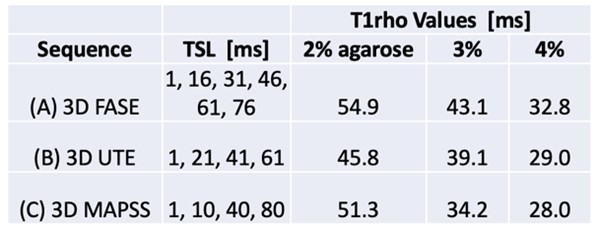
Agarose Phantom: Figure 2 shows selected raw images of agarose phantoms imaged with the 3 T1rho sequence, along with T1rho colormaps. General trend of decreasing T1rho values with increasing agarose concentration was observed. Figure 3 shows good curve-fits for the 2% agarose phantom. Figure 4 shows the T1rho values of the phantoms confirming the decreasing trend, suggesting that the sequences were sensitive to macromolecular concentration. In particular, 3D MAPSS sequence showed values of 51, 34, and 38 ms for 2%, 3%, and 4% agarose, respectively, which was close to published values of 54, 39, and 29 ms found in a different platform.5Human Knee: Figure 5 shows selected raw images of the knee imaged with the three T1rho sequences (Figure 5ABC), and the mean T1rho values found in four ROIs (Figure 5D). For 3D FASE and 3D MAPSS sequences, the mean T1rho values of the cartilage (29-38 ms in this study) were in the similar range as those reported,6-8 while the meniscus T1rho values (25-30 ms) were a little high compared to past reports (15-20 ms). For 3D UTE T1rho, there is relatively little data available in literature. When compared to a similar sequence (3D Cones T1rho), our values of cartilage (~26 ms) were similar to reported values in human patellar cartilage (~26 ms).9
Conclusion
We have successfully developed and implemented the two T1rho sequences, and validated them using agarose phantoms and volunteer knees. All sequences were optimized to be clinically feasible (~5 min or less) and yielded satisfactory results with consistent values in agarose phantoms and human knees. Based on the cartilage T1rho values (around 30 to 40 ms), the present range of TSL (4 to 6 points up to TSL of 80 ms) appear optimal.Acknowledgements
Research reported in this publication was supported in parts by Canon Medical grants to Drs. Miyazaki and Bae, and by National Institute of Arthritis and Musculoskeletal and Skin Diseases P30 AR073761 in support of Dr. Bae. The content is solely the responsibility of the authors and does not necessarily represent the official views of the sponsoring institutions.References
1. Duvvuri U, Reddy R, Patel SD,et al. Magn Reson Med 38: 863-867, 1997.
2. Menezes NM, Gray ML, Hartke JR, Burstein D. Magn Reson Med 51: 503-509, 2004.
3. Wheaton AJ, Dodge GR, Elliott DM, Nicoll SB, Reddy R. Q Magn Reson Med 54: 1087-1093, 2005. 4. Schooler J, Kumar D, Nardo L, et al. Osteoarthritis Cartilage 22: 51-62, 2014. PMCID:3934359
5. Buck FM, Bae WC, Diaz E, et al. AJR Am J Roentgenol 196: W174-179, 2011.
6. Li X, Pedoia V, Kumar D, et al. Osteoarthritis Cartilage 23: 2214-2223, 2015.
7. Knox J, Pedoia V, Wang A, et al. Osteoarthritis Cartilage 26: 689-696, 2018.
8. Kim J, Mamoto K, Lartey R, et al. Osteoarthritis Cartilage 28: 1539-1550, 2020.
9. Wu M, Ma YJ, Kasibhatla A, et al. Magn Reson Med 84: 2551-2560, 2020.
Figures