2452
Ultrafast T2 mapping of knee articular cartilage under compression using a radial turbo-spin-echo sequence at 3T - initial results1High Field MR Centre, Department of Biomedical Imaging and Image-guided Therapy, Medical University of Vienna, Vienna, Austria, 2Institute of Measurement Science, Slovak Academy of Sciences, Bratislava, Slovakia, 3CD Laboratory for MR Imaging Biomarkers (BIOMAK), Vienna, Austria, 4Austrian Cluster for Tissue Regeneration, Ludwig Boltzmann Institute for Experimental and Clinical Traumatology, Vienna, Austria, 5Institute for Clinical Molecular MRI in the Musculoskeletal System, Karl Landsteiner Society, Vienna, Austria
Synopsis
Keywords: Cartilage, Quantitative Imaging, Ultra-fast
Quantitative T2 maps have been used for more than a decade in musculoskeletal MR research as a tool for cartilage assessment. In this work, we compared T2 mapping of knee cartilage with ultrafast radial turbo-spin-echo sequence to conventional multi-echo spin echo sequence. We used radial turbo-spin-echo T2 maps to track dynamic changes in knee cartilage during compression. Correlation between the two methods was found in multiple cartilage regions. Dynamic change in T2 values was observable on T2 maps during first two minutes of compression. We demonstrated that radial-TSE sequence allows for fast determination of T2 values of the knee cartilage.Introduction
Quantitative MRI maps of knee cartilage have been used in osteoarthritis (OA) research as a tool for detection of early OA changes1. Various studies investigated the effect of mechanical loading on mean T2 of knee cartilage regions in both OA patients and healthy controls. However due to relatively long measurement times, only biomechanical effects after several minutes to hours of compression are described in literature2,3. Fast and accurate T2 mapping technique could provide a useful tool for assessment of dynamic changes in cartilage during compression. The aim of this work was to validate the prototype radial turbo-spin-echo (rTSE) sequence4, optimized for multi-slice T2 mapping at 3T in comparison to conventional Cartesian multi-echo spin echo (CPMG) sequence.Methods
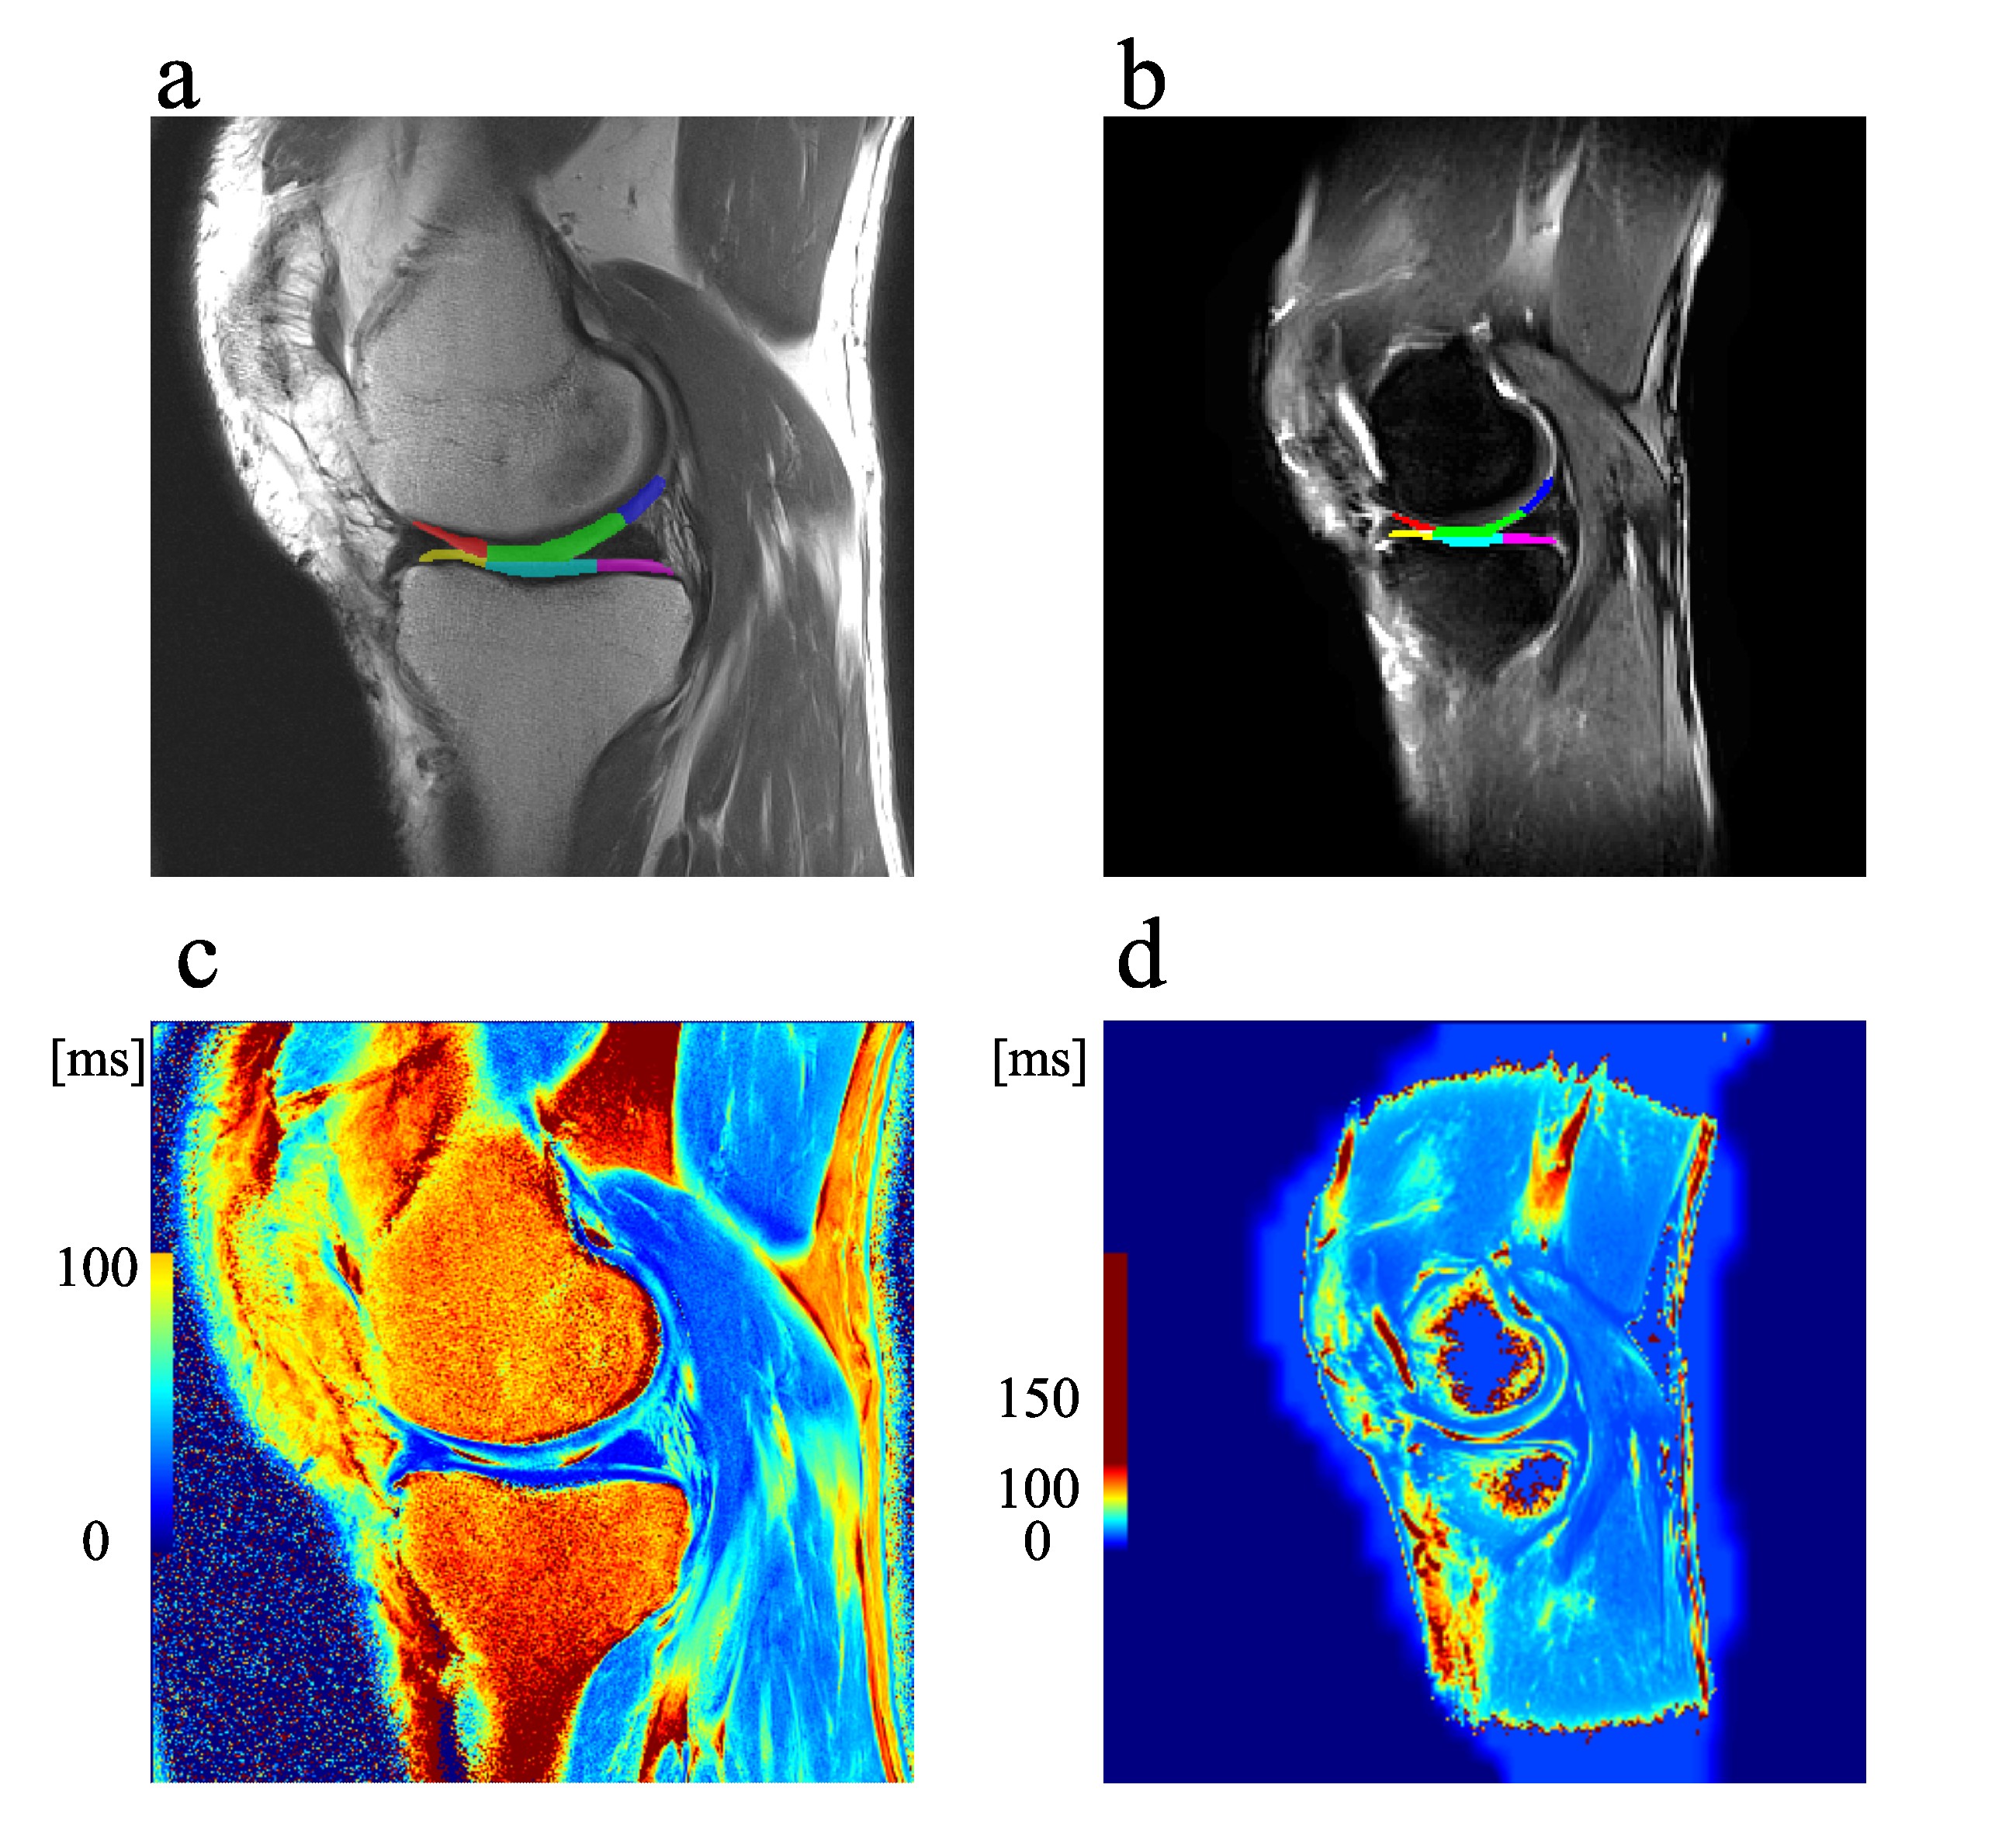
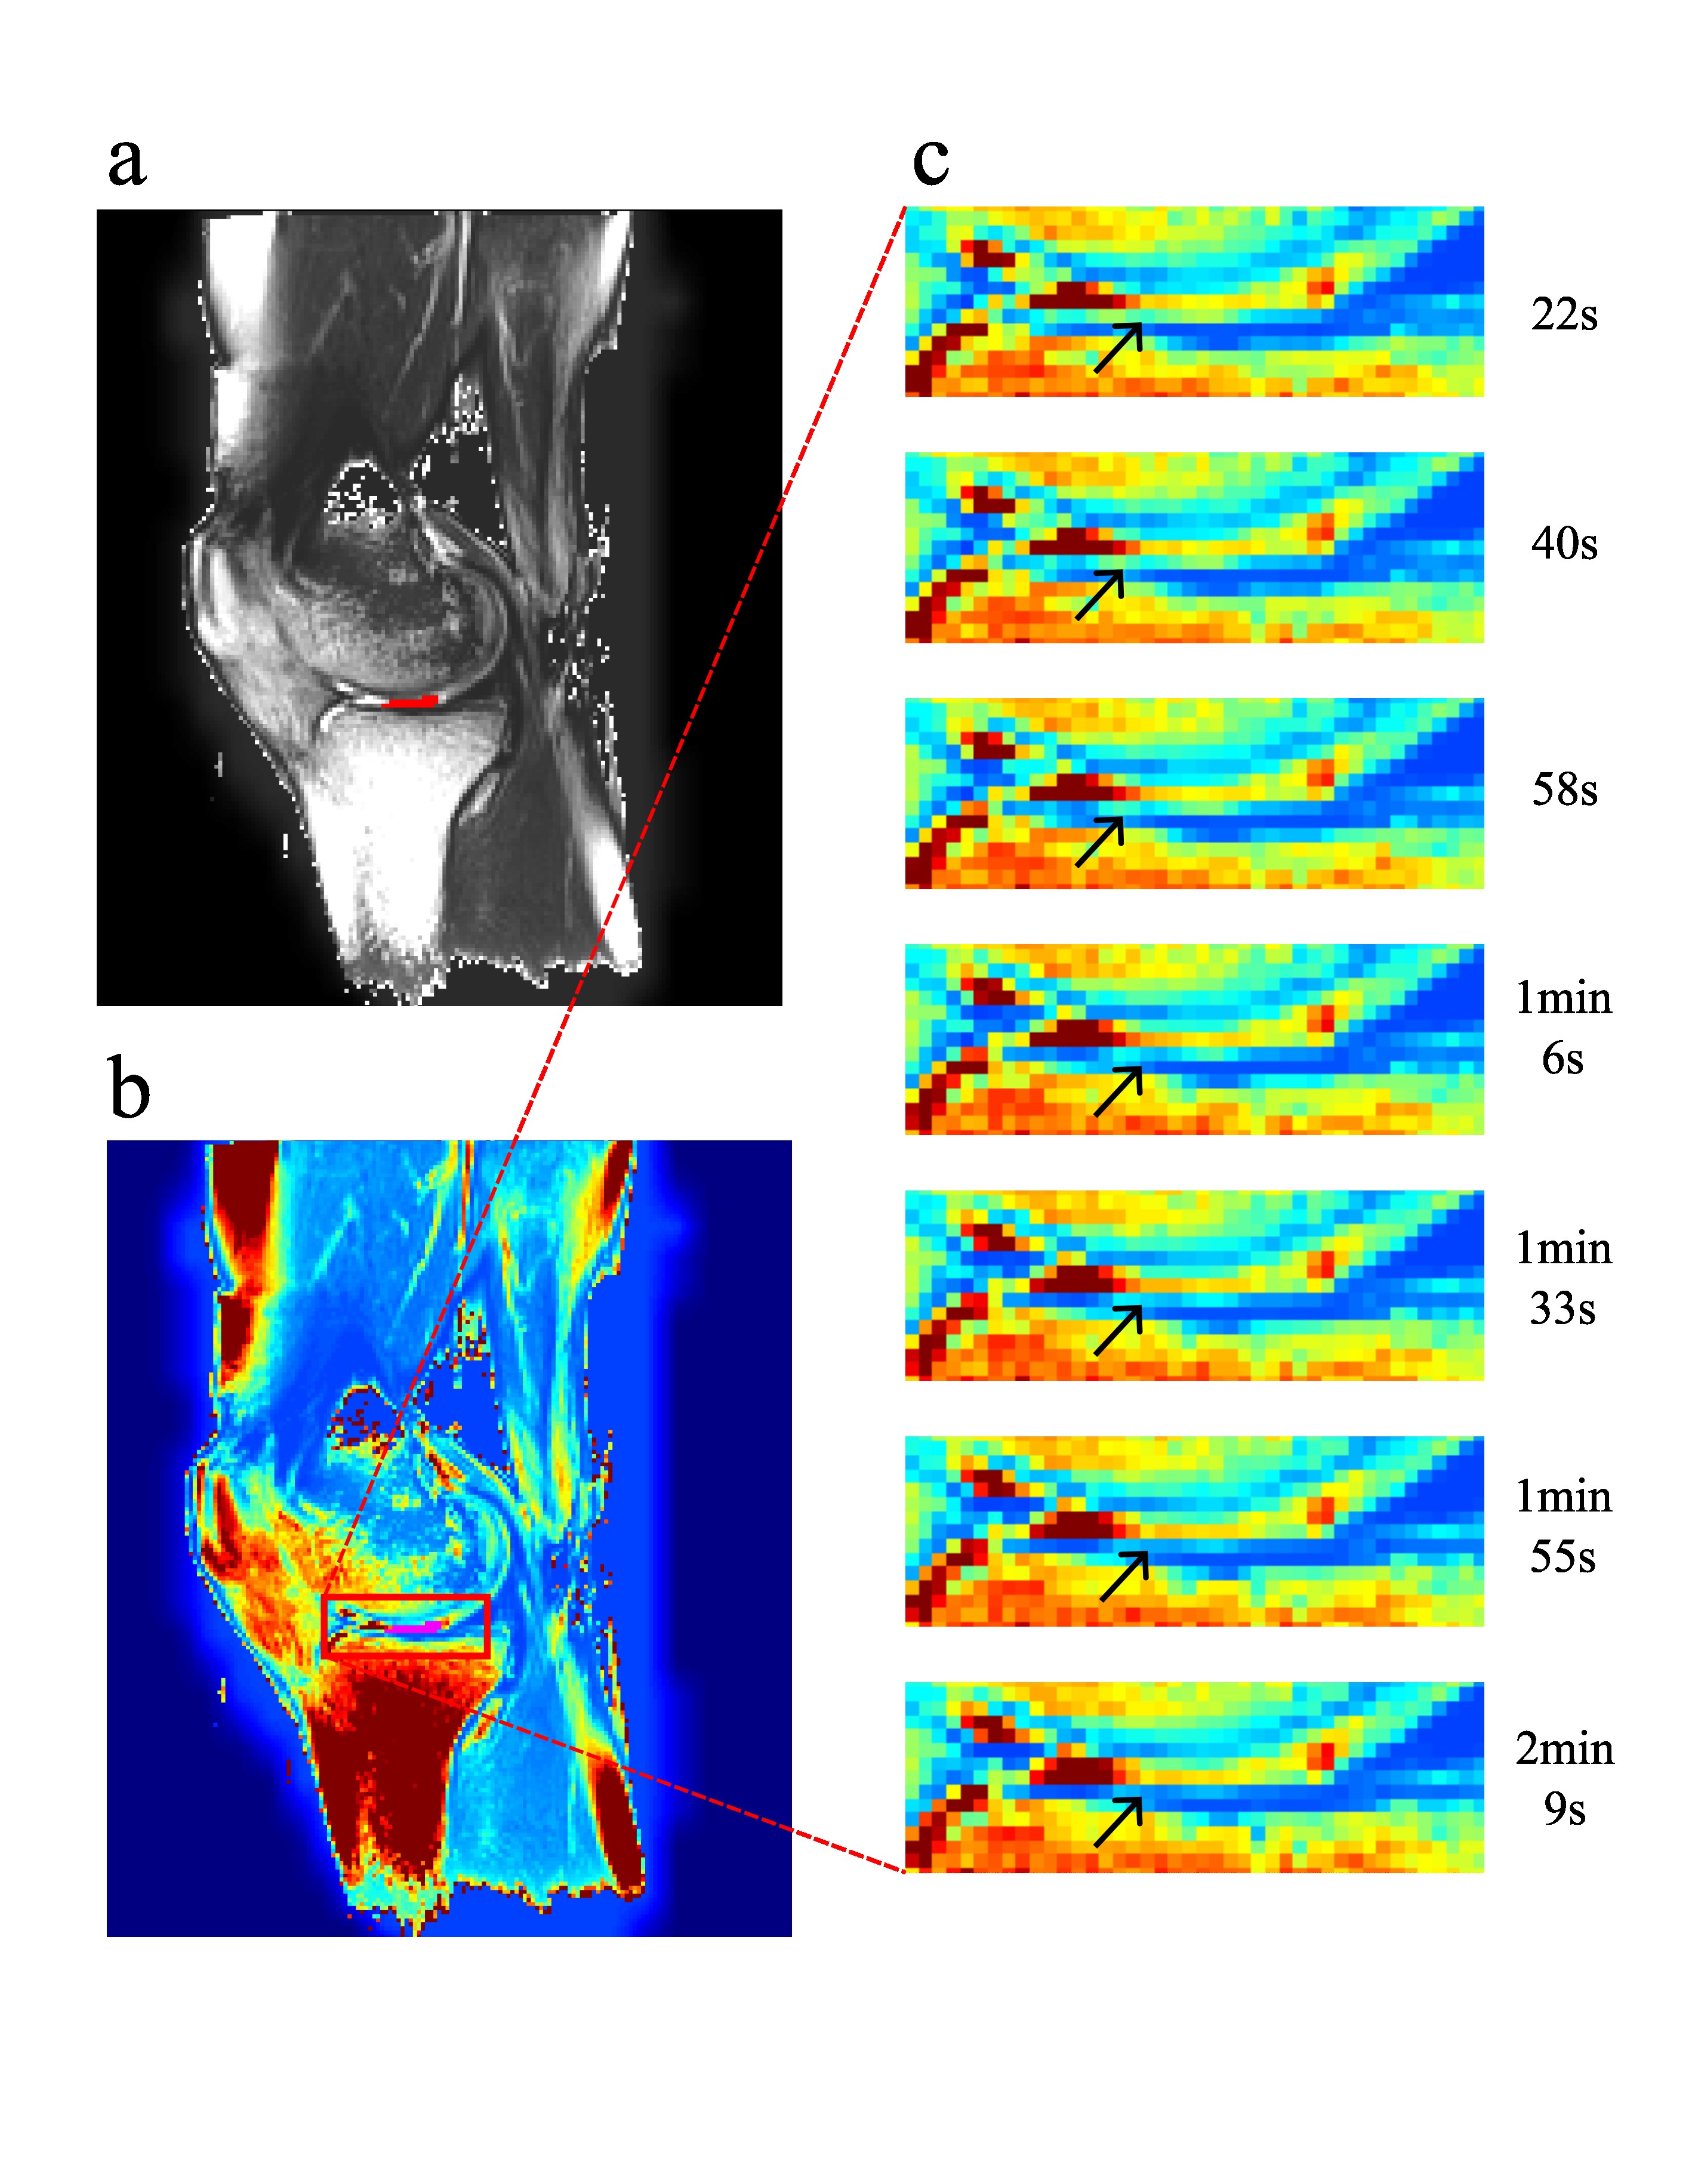
Seventeen volunteers, mean age of 32.7 ± 12.3 years, 8 males and 9 females were scanned in a clinical 3T MRI Prisma Fit scanner (Siemens, Erlangen, Germany). Protocol comprises conventional CPMG sequence with following parameters: repetition time= 1890 ms, echo train length = 8, echo time = 13.8 to 110.4 ms, echo-spacing = 13.8 ms, matrix size = 384 × 384, FA = 180°, slice thickness = 4 mm, time of acquisition = 6 min 23 s and rTSE sequence with following parameters: repetition time = 1500 ms, echo train length = 29, echo time = 8.6 to 240.2 ms, echo-spacing = 9.2 ms, matrix size = 256 x 256, radial views = 290, FA = 180°, slice thickness = 6 mm, time of acquisition = 17 s. Maps (Figure 1) were calculated inline and in case of rTSE mono-exponential signal model and noise floor subtraction was used with exclusion of the first echo. Single representative slice from rTSE map and corresponding slice from CPMG map were selected. Six regions of interest (ROIs) were placed in the same anatomical locations on both maps of each volunteer (Figure 1): anterior femoral cartilage (AFC), central femoral cartilage (CFC), posterior femoral cartilage (PFC), anterior tibial cartilage (ATC), central tibial cartilage (CTC), posterior tibial cartilage (PTC). Mean T2 values were calculated for each ROI and Wilcoxon signed-rank test, Spearman’s correlation coefficient and Bland-Altman analysis were performed. One volunteer underwent an MR examination with loading using an MR compatible compression device applying force corresponding to 150 N (15 kg). With pressure applied, rTSE map was acquired each 18 - 20 s for the first two minutes of compression.Results
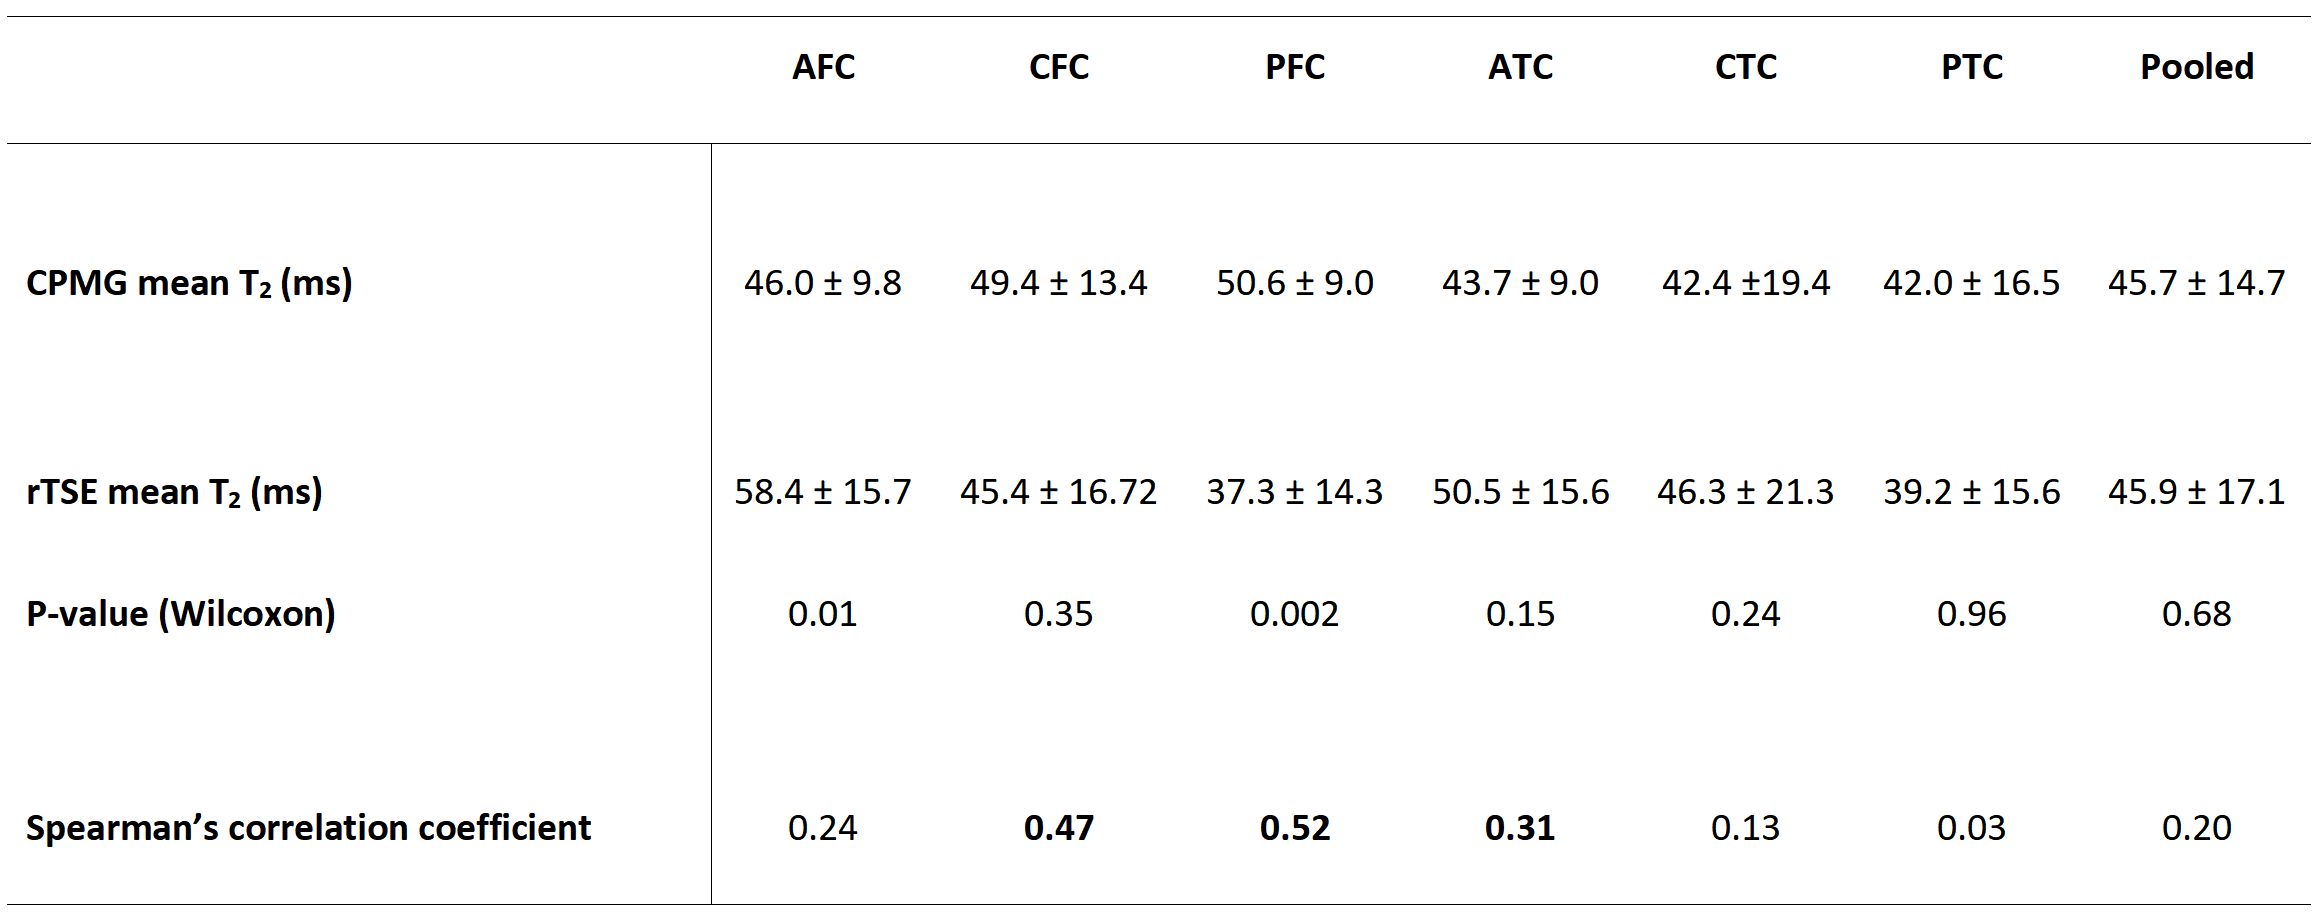
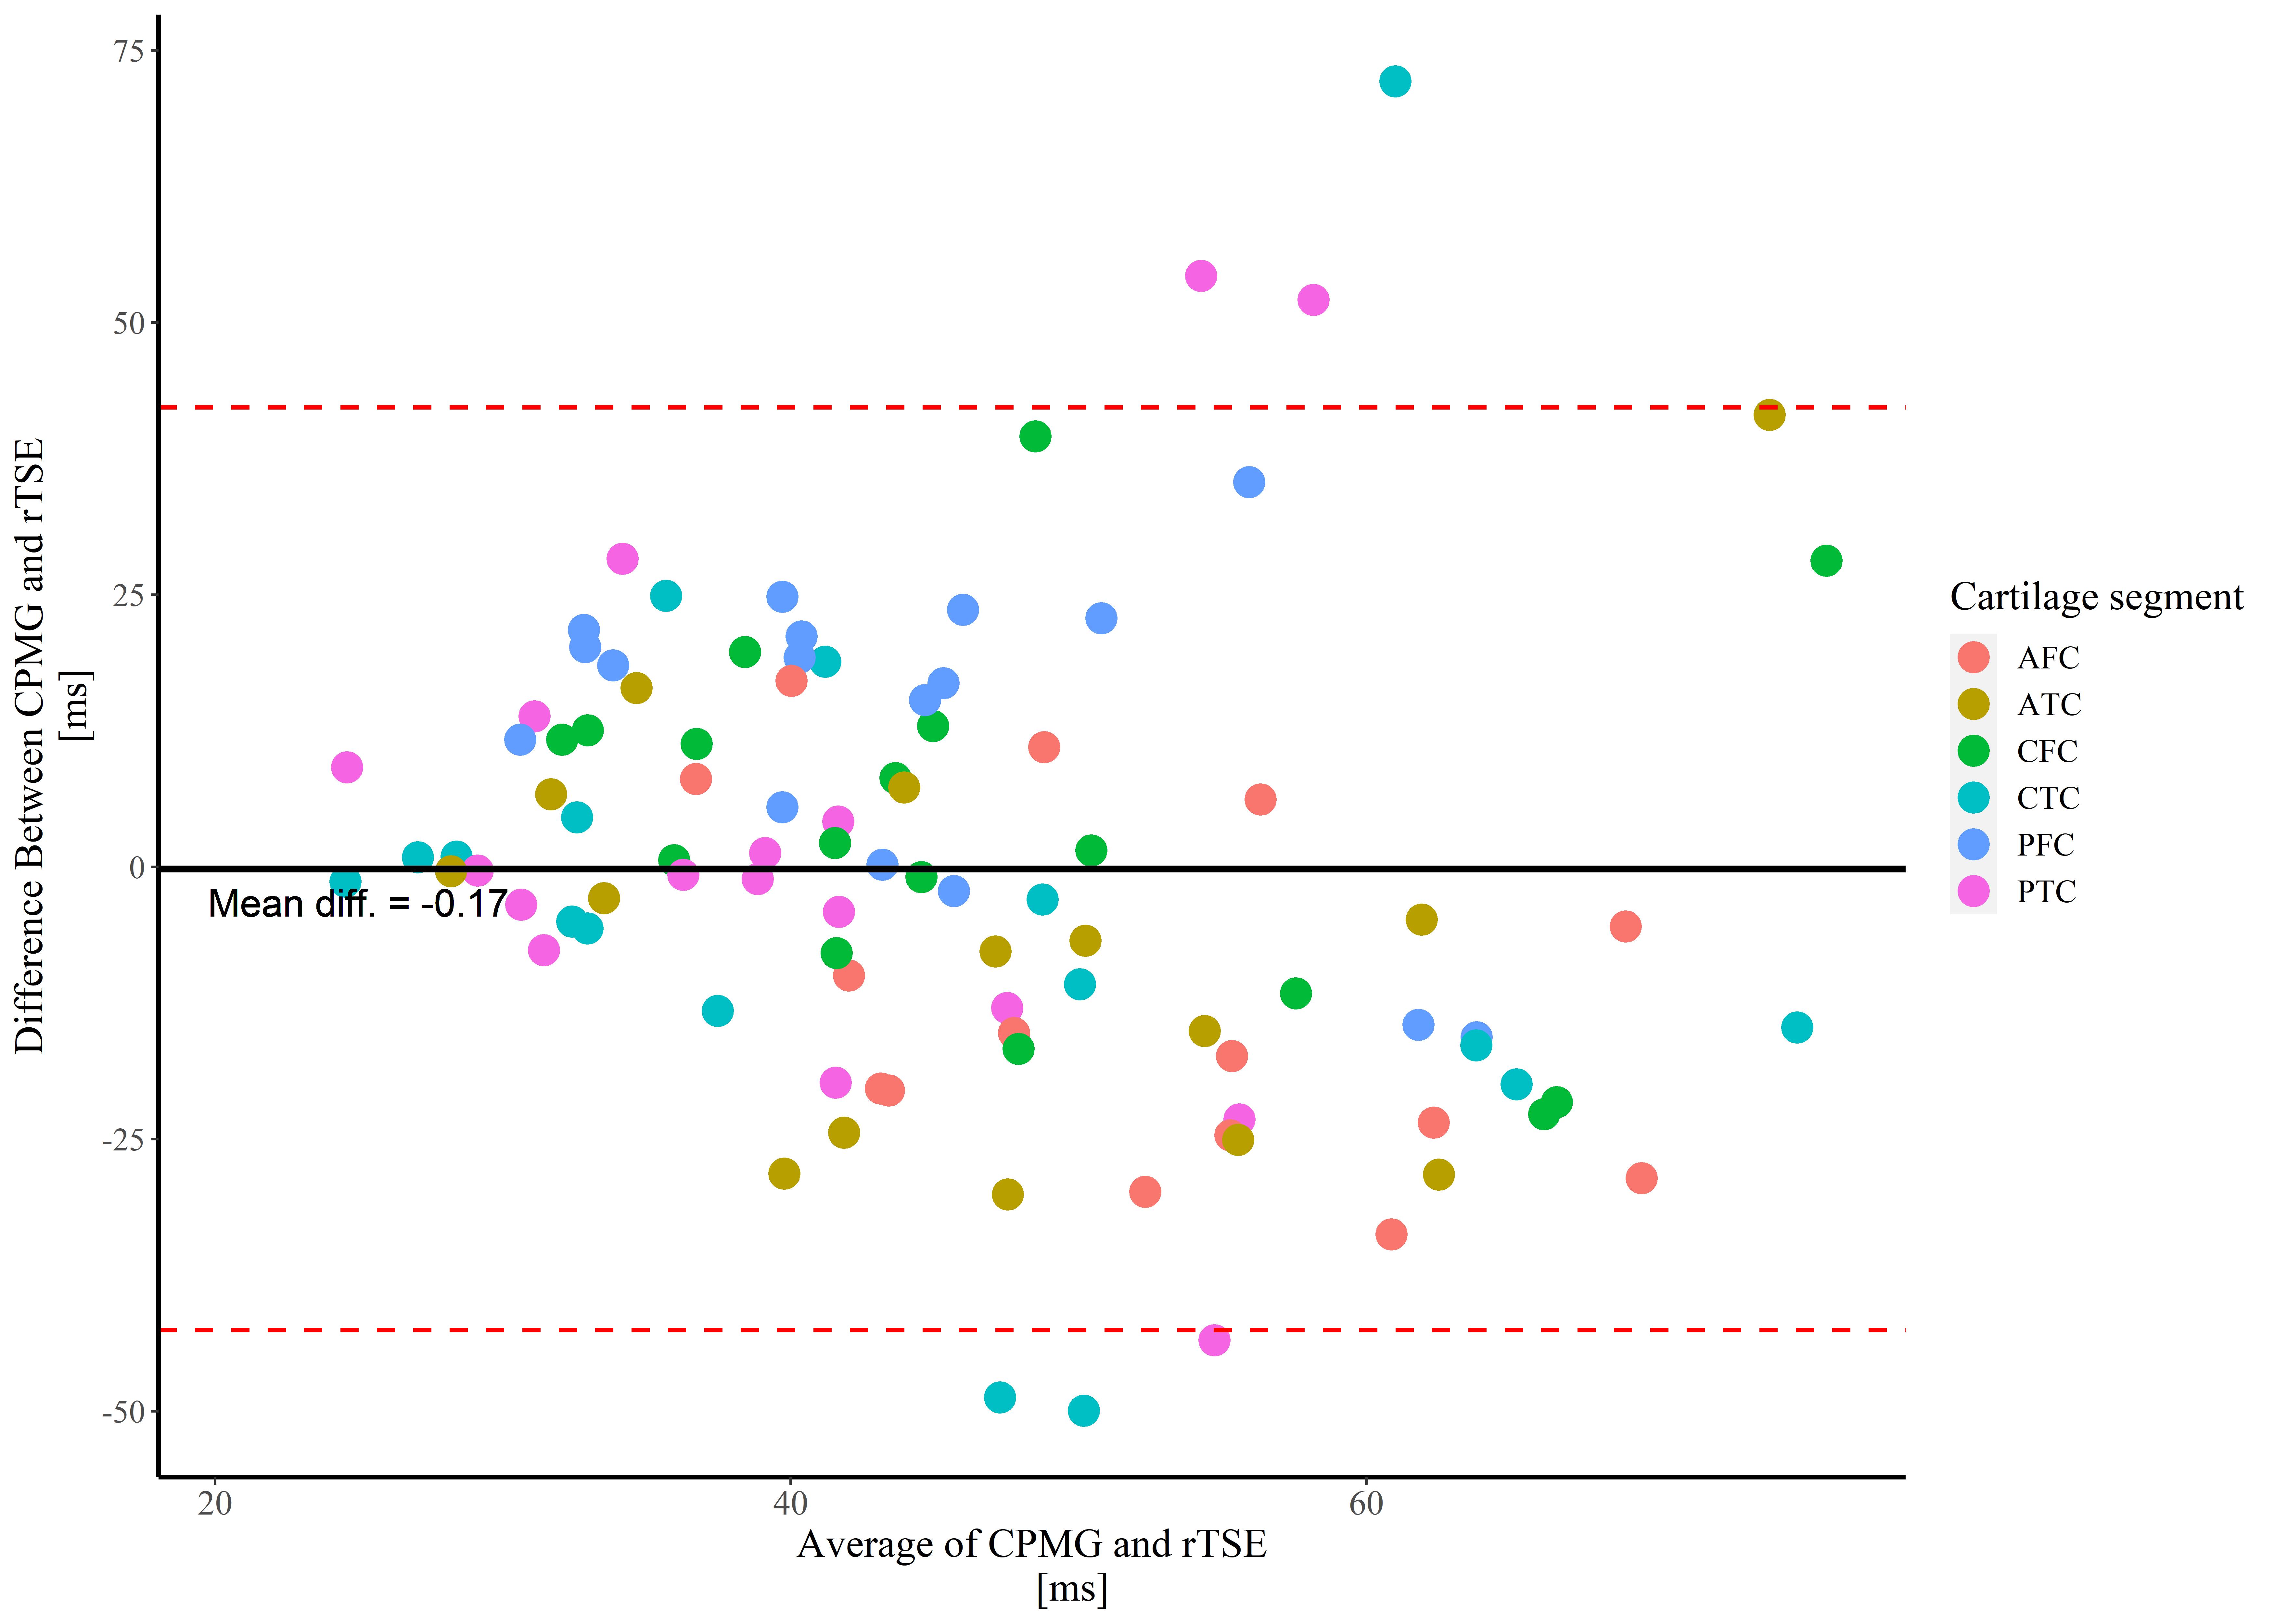
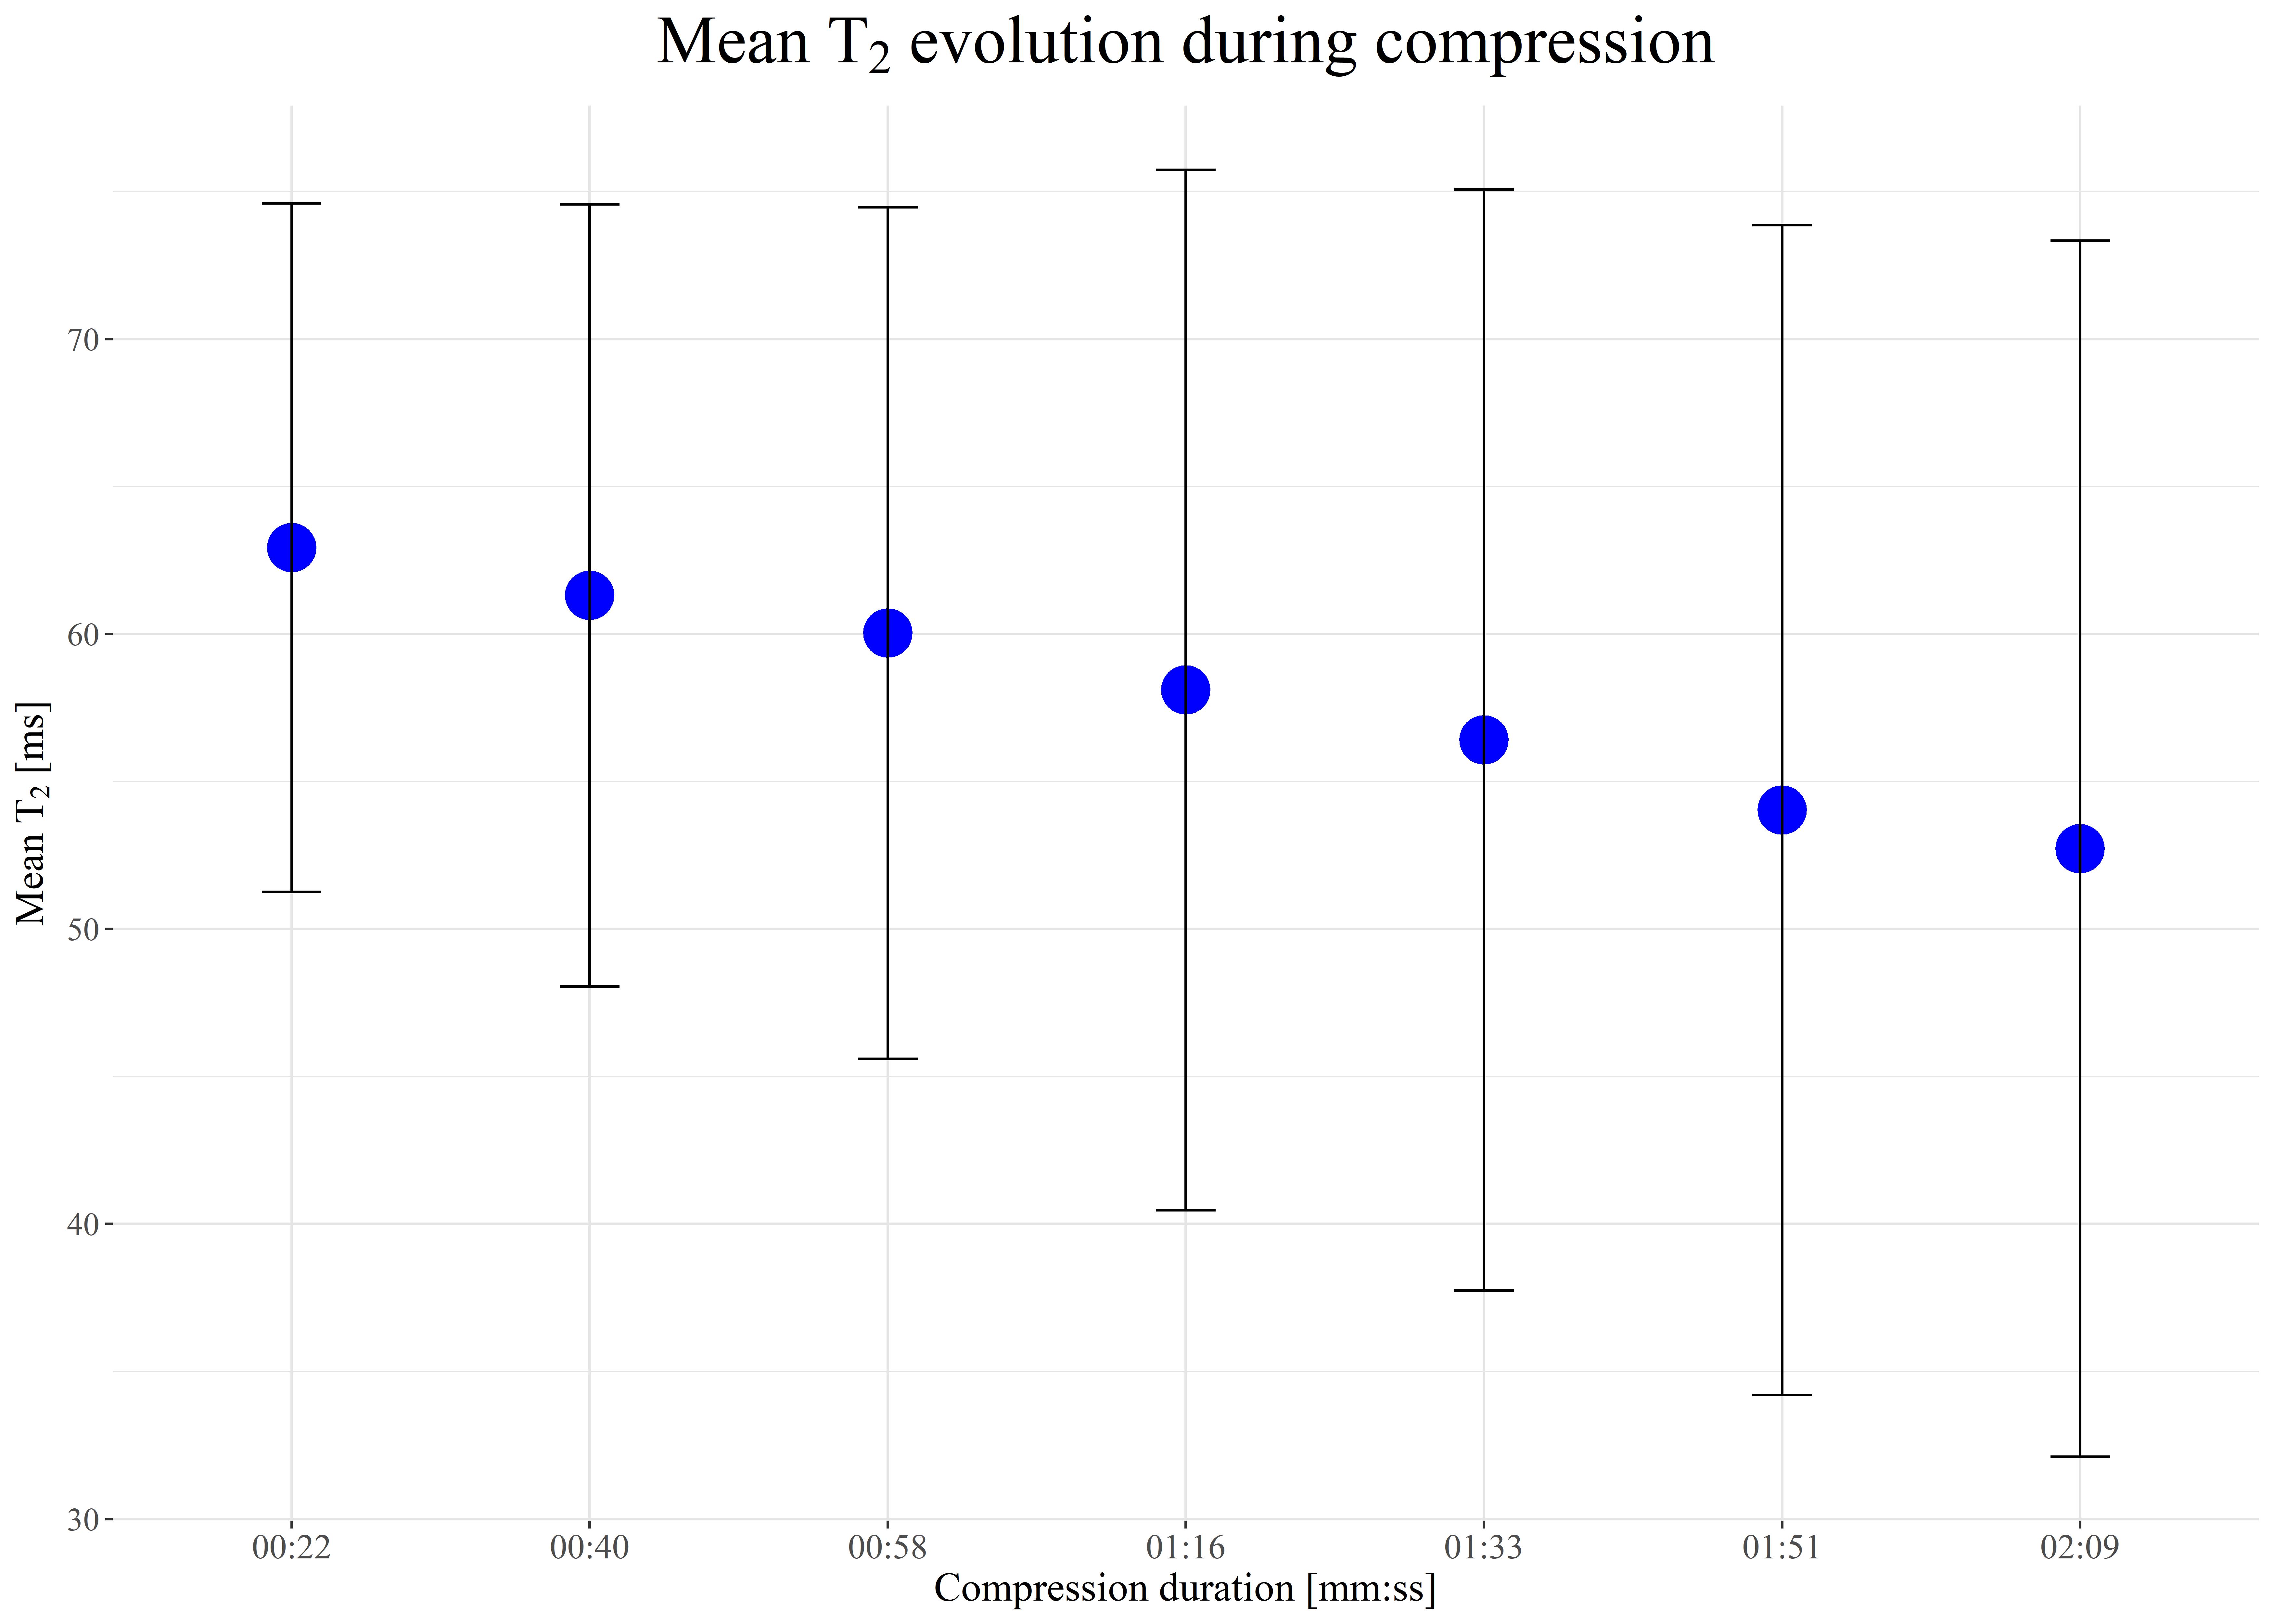
When all cartilaginous regions were pooled, mean T2 values were 45.7 ± 14.7 ms and 45.9 ± 17.1 ms (p = 0.68) for CPMG and rTSE maps respectively. Mean T2 values for each ROI and correlation coefficients are listed in Table 1. We found a moderate correlation between the two methods in case of posterior femoral cartilage and weak correlation in case of central femoral cartilage and anterior tibial cartilage. In Bland-Altman analysis, majority of measured values fell within the limits of agreement (Figure 2). Figure 3 and Figure 4 show a gradual decrease in T2 values during compression.Discussion
This is the first study evaluating experimental rTSE T2 quantitative maps of knee articular cartilage and the potential utilization for assessment of dynamic changes during loading. We could demonstrate that values from rTSE are correlated with conventional CPMG values of femoral cartilage. On seven consecutive rTSE maps a fast decrease of T2 values during knee compression was shown. Since the area receiving maximum load during knee compression is small, correct slice placement is crucial.Conclusion
In conclusion, we could demonstrate that radial TSE sequence allows for fast determination of T2 values of the knee cartilage and might be feasible for tracking of dynamic changes in biomechanical MR of knee articular cartilage.Acknowledgements
No acknowledgement found.References
1. Dunn TC, Lu Y, Jin H, Ries MD, Majumdar S. T2 relaxation time of cartilage at MR imaging: comparison with severity of knee osteoarthritis. Radiology. 2004;232(2):592-598. doi:10.1148/radiol.2322030976
2. Souza RB, Stehling C, Wyman BT, et al. The effects of acute loading on T1rho and T2 relaxation times of tibiofemoral articular cartilage. Osteoarthritis Cartilage. 2010;18(12):1557-1563. doi:10.1016/j.joca.2010.10.001
3. Cotofana S, Eckstein F, Wirth W, et al. In vivo measures of cartilage deformation: patterns in healthy and osteoarthritic female knees using 3T MR imaging. Eur Radiol. 2011;21(6):1127-1135. doi:10.1007/s00330-011-2057-y
4. Natsuaki Y, Keerthisavan MB, Bilgin A et al (2017) Flexible and efficient 2D radial TSE T2 mapping with tiered echo sharing and with “pseudo” golden angle ratio reordering. Proc ISMRM 2017
Figures