2451
Intra- and Inter-vendor Reproducibility of T1ρ Measurements in the Healthy Human Knee Joint1Bioengineering, University of Pennsylvania, Philadelphia, PA, United States, 2University of Pittsburg, Pittsburg, PA, United States, 3Radiology, University of Pennsylvania, Philadelphia, PA, United States, 4Biostatistics and Epidemiology, University of Pennsylvania, Philadelphia, PA, United States, 5Cadenzamed LLC, Berwyn, PA, United States
Synopsis
Keywords: Cartilage, Osteoarthritis
Osteoarthritis (OA) is a debilitating disease that results in cartilage loss and pain, but no drug is currently available for OA, largely due to the absence of a reliable index for measuring disease modifying effects of drug candidates in clinical trials. T1ρ MRI promises to be a reliable method because it provides a measure of cartilage degradation. However, it is critical to establish its reproducibility across MRI vendors before its universal use in clinical studies. Here we report the establishment of a clinically relevant reproducibility error in T1ρ in 25 healthy volunteer knees within and across 3T MRI scanners.Introduction
Osteoarthritis (OA) results in cartilage loss and pain and has a significant impact in morbidity and healthcare costs worldwide. There is an unmet need for a therapeutic intervention that limits the progression of OA. However, the major impediment to the development of effective OA therapeutics is the absence of a reliable index for measuring disease-modifying effects of drug candidates in clinical trials. Radiographic measures of Joint Space Narrowing (JSN) currently used endpoints in clinical trials, lack sensitivity to soft tissues and thus are unable to detect early cartilage abnormalities. T1ρ MRI method has been shown to detect early cartilage abnormalities in OA patients including the finding that T1ρ values are elevated in early, moderate, and advanced stages of OA (in a limited number of patients), when compared with corresponding asymptomatic subjects.1–7 However, it is critical to address the variability of 3D T1ρ MRI across MRI vendors before its implementation in clinical studies. In this work, we establish the clinically relevant reproducibility error in T1ρ in healthy volunteer knees within and across 3T MRI scanners.Methods
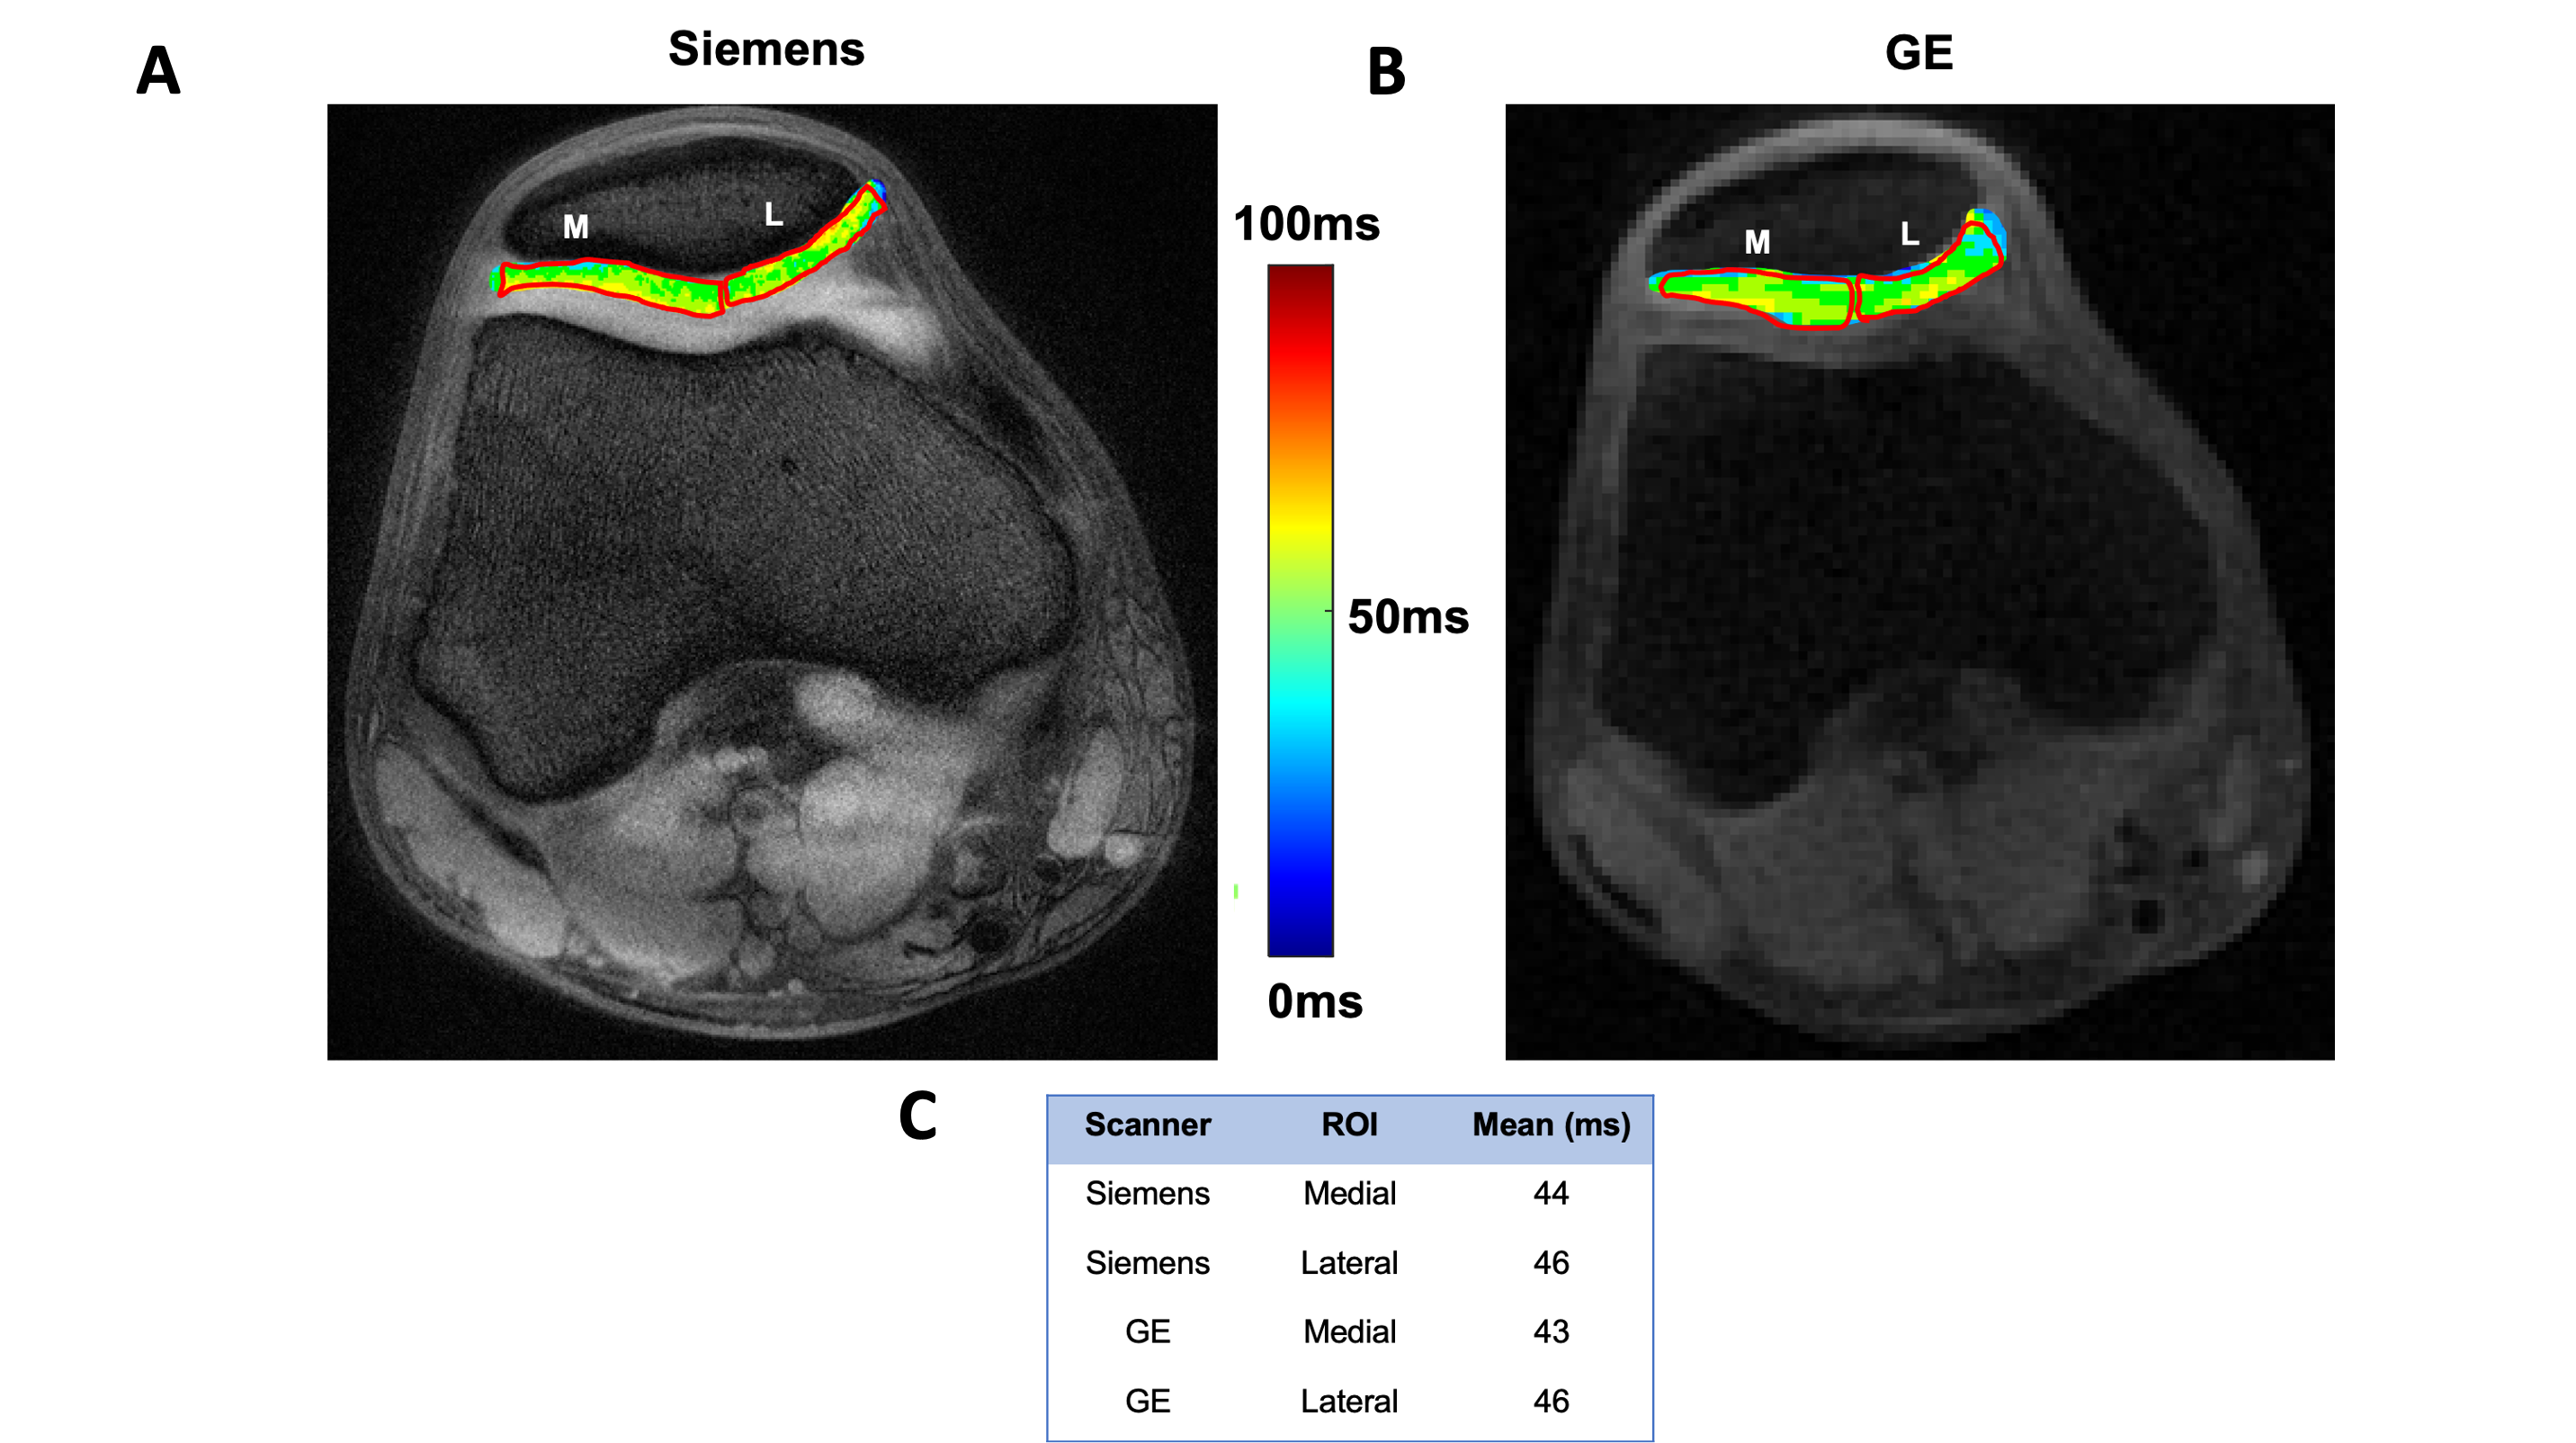
Phantom and in vivo experiments were performed at both Siemens (Prisma, Siemens Healthcare, Germany) and GE 3T (Signa, GE, Healthcare, US) scanners using a single-channel transmit, 15-channel receive knee coil (QED, OH, USA). Scans at each vendor included a triplane GRE localizer(15s), T1-weighted image (4min), and T1ρ sequence. The T1ρ sequences were developed by Singh et al., 2014 and Du et al., 2010 for Siemens and GE systems, respectively. A two-compartment phantom with a 0.1 (inner cylinder) and 0.2 mM MnCl2 (outer cylinder) solution was used to simulate tissues with differing T1ρ values. The phantom was measured at the scanner from each vendor three times. T1ρ maps were created by processing the dicoms through a python script and region of interest (ROI) analysis was performed using ImageJ. Four ROIs were drawn in each cylinder to measure homogeneity of signal throughout the phantom. Intra and inter-vendor coefficient of variation (CV%) was measured to determine reproducibility. Human studies were approved by our institute’s IRB and the informed consent was obtained from all participants. 25 healthy subjects between the ages of 18-30 had their right knee scanned at each scanner on separate days. Intra-scan variability was assessed on each patient by taking the average CV% of each similarly positioned ROI through the three scans at the same vendor. Intra-vendor CV% was measured by taking the mean CV% of each similarly positioned ROI through six scans (both vendors). Two ROIs, medial and lateral patellar cartilage, were manually drawn to record the mean value of cartilage; and intra-scan and inter-vendor coefficients of variation (CV) were analyzed. Localizing ROIs to more specific regions is important as OA onset and progression frequently occur in localized regions rather than being homogenously distributed throughout the cartilage. The slice with the thickest patellar cartilage was selected and a similar slice selection between scanners was performed in post-processing by looking at similar femur shapes.Results
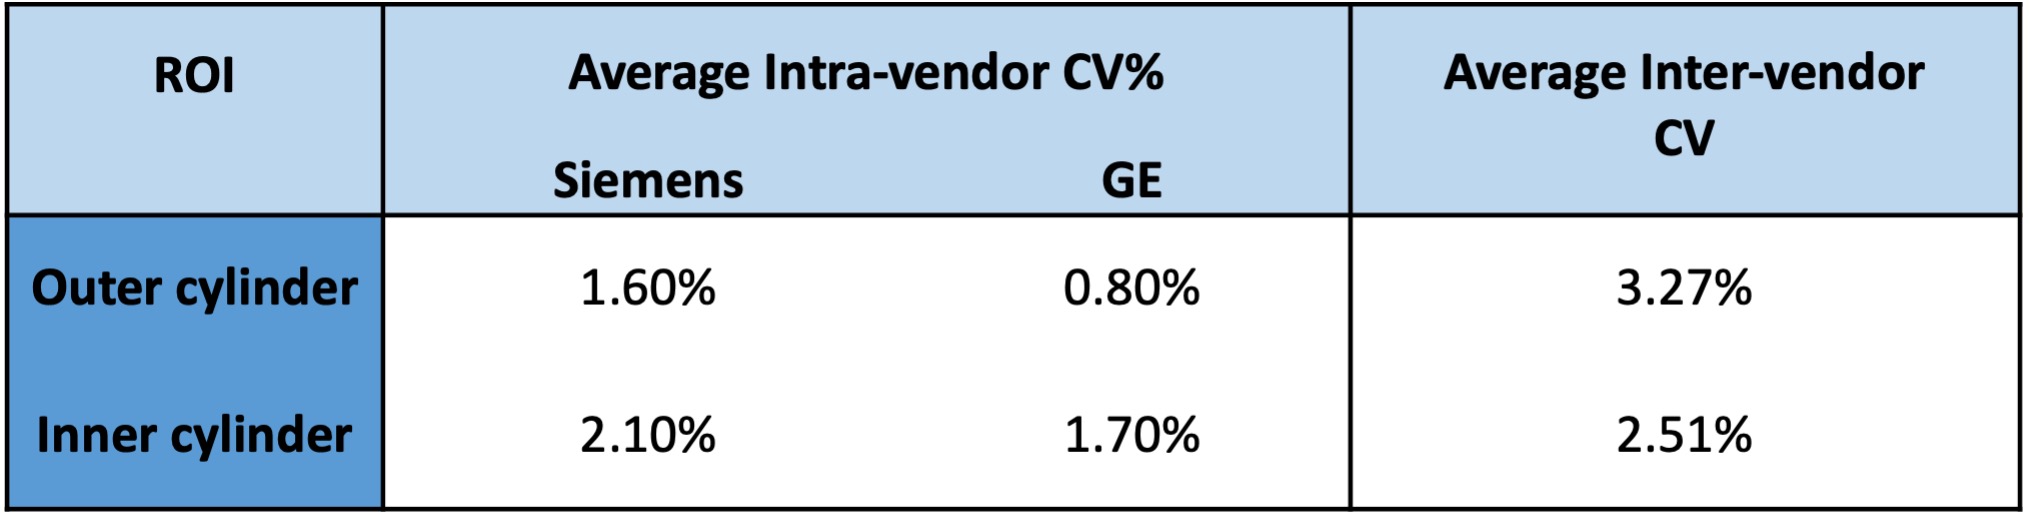
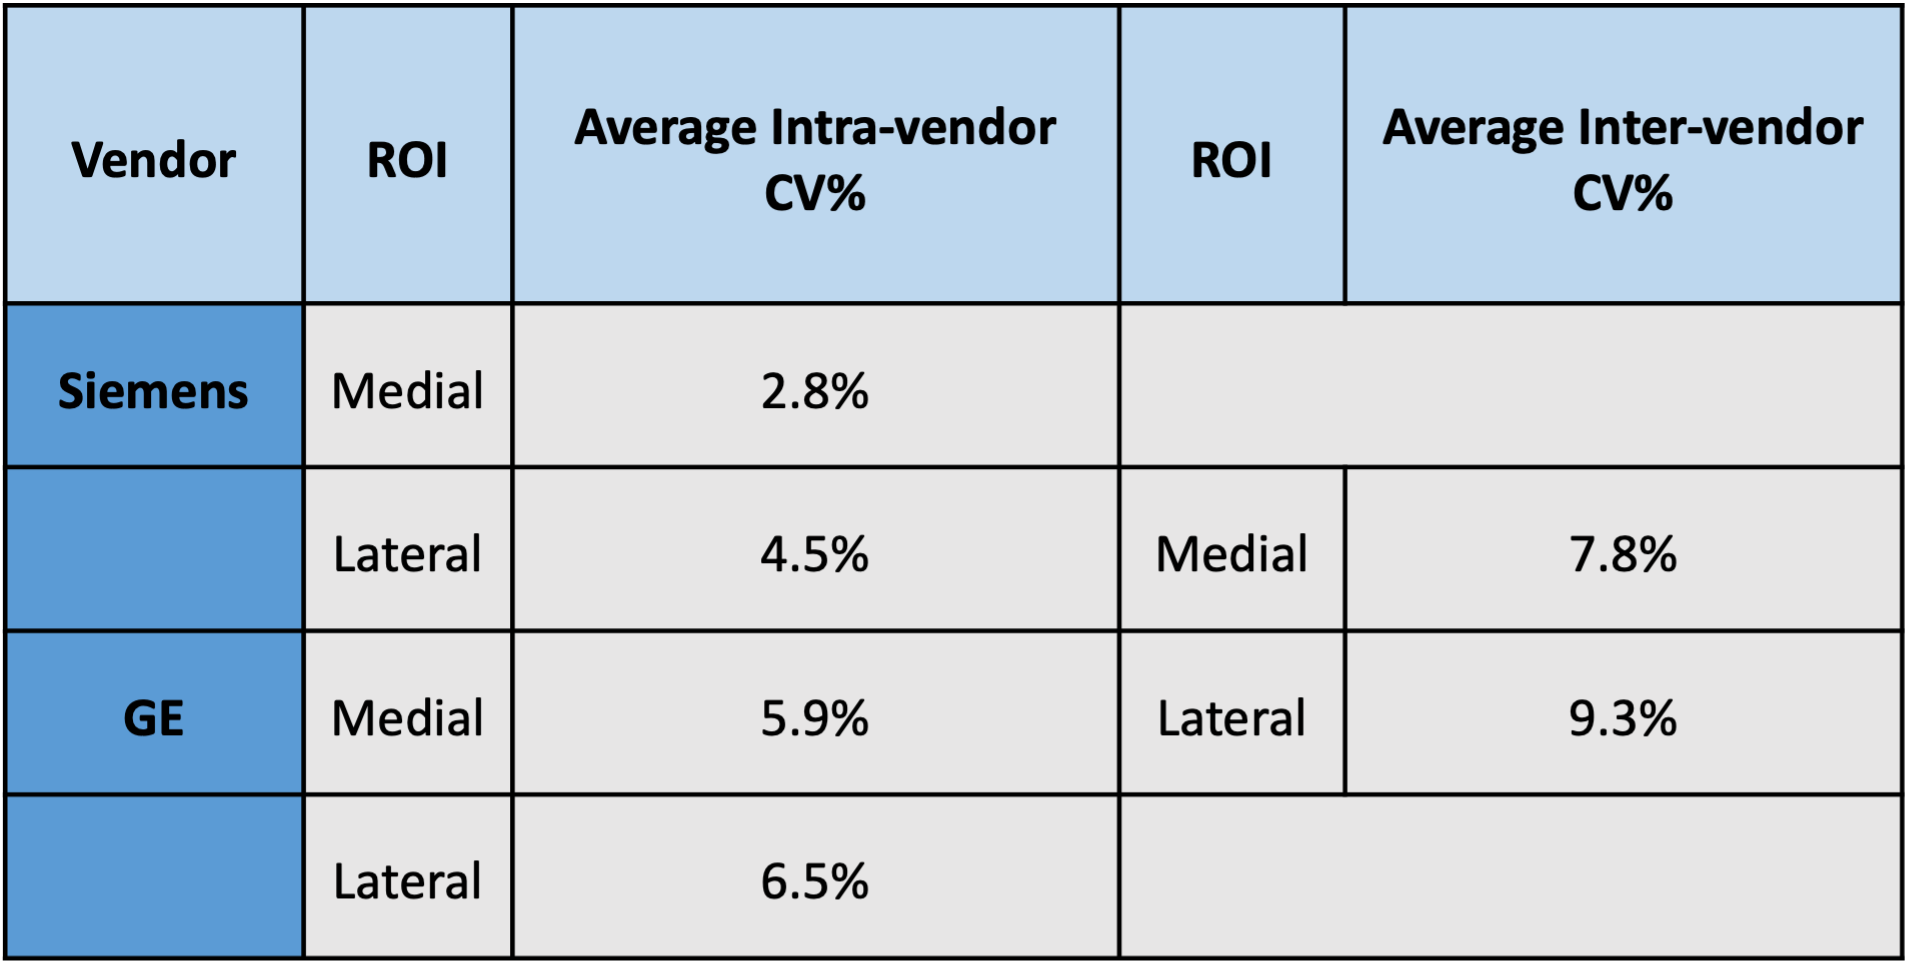
Table 1 shows that the CV% for the inner and outer cylinders were ~2% or less for intra-vendor reproducibility, whereas the inter-vendor CV% was ~3% or less for each cylinder. Figure 1A and 1B show the similarity in slice position between scanners and Figure 1C displays the values calculated in each respective ROI. Table 2displays the analysis of the 25 participants succinctly. Siemens and GE intra-vendor CV% of T1ρ values were averaged to be ~5% and ~7%, respectively; and the inter-vendor CV% ranged between ~8-9% depending on the ROI region selected.Discussion & Conclusion
Our aim in this study was to apply well-established T1ρ approaches at scanners from each vendor and compare them to validate if clinical applications are feasible. It is important to emphasize that the preparatory T1ρ pulse and k-space readout schemes are different for each vendor. It is outside the scope of this study to build a novel T1ρ sequence compatible across vendors, but instead the focus is to use sequences already approved at each vendor.The phantom experiment was performed as a proof of concept that each pulse functions properly and the data shows reproducibility for both intra and inter-scan data. The human data shows that intra-vendor reproducibility across 25 participants yields a CV% of ~5% and ~7% for Siemens and GE, respectively. These results corroborate with literature reproducibility values.8 Inter-vendor reproducibility was ~8% and ~9% for the medial and lateral patellar cartilage. The same trend in increased variability for lateral patellar cartilage is seen here. With these results, we show that it is possible to accurately measure variations in T1ρ measurements of 10% with the select sequences. Given that healthy participants have mean T1ρ measurements ~40ms and OA patients have mean values ~60ms, we will be able to distinguish participants susceptible to OA from the healthy participants. Furthermore, this will allow pharmaceutical approaches to observe OA regression, remission, or progression by measuring T1ρ measurements in longitudinal studies. Future work includes measuring inter-vendor reproducibility of participants with OA.
Acknowledgements
“Research reported in this publication was supported by the National Institute Of Arthritis And Musculoskeletal And Skin Diseases of the National Institutes of Health under Award Number R43AR076265.”
“The content is solely the responsibility of the authors and does not necessarily represent the official views of the National Institutes of Health”
References
1. Regatte RR, Akella SVS, Borthakur A, Kneeland JB, Reddy R. In vivo proton MR three-dimensional T1ρ mapping of human articular cartilage: Initial experience. Radiology. 2003;229(1). doi:10.1148/radiol.2291021041
2. Regatte RR, Akella SVS, Wheaton AJ, et al. 3D-T1ρ-relaxation mapping of articular cartilage: In vivo assessment of early degenerative changes in symptomatic osteoarthritic subjects. Acad Radiol. 2004;11(7). doi:10.1016/j.acra.2004.03.051
3. Witschey WRT, Borthakur A, Fenty M, et al. T1ρ MRI quantification of arthroscopically confirmed cartilage degeneration. Magn Reson Med. 2010;63(5). doi:10.1002/mrm.22272
4. Lozano J, Li X, Link TM, Safran M, Majumdar S, Ma CB. Detection of Posttraumatic Cartilage Injury Using Quantitative T1rho Magnetic Resonance Imaging. J Bone Jt Surg. 2006;88(6). doi:10.2106/jbjs.e.01051
5. Stahl R, Luke A, Li X, et al. T1rho, T2 and focal knee cartilage abnormalities in physically active and sedentary healthy subjects versus early OA patients - A 3.0-Tesla MRI study. Eur Radiol. 2009;19(1). doi:10.1007/s00330-008-1107-6
6. Li X, Benjamin Ma C, Link TM, et al. In vivo T1ρ and T2 mapping of articular cartilage in osteoarthritis of the knee using 3 T MRI. Osteoarthr Cartil. 2007;15(7). doi:10.1016/j.joca.2007.01.011
7. Bolbos RI, Link TM, Benjamin Ma C, Majumdar S, Li X. T1ρ relaxation time of the meniscus and its relationship with T1ρ of adjacent cartilage in knees with acute ACL injuries at 3 T. Osteoarthr Cartil. 2009;17(1). doi:10.1016/j.joca.2008.05.016
8. Singh A, Haris M, Cai K, Kogan F, Hariharan H, Reddy R. High resolution T1ρ mapping of in vivo human knee cartilage at 7T. PLoS One. 2014;9(5). doi:10.1371/journal.pone.0097486
9. Du J, Carl M, Diaz E, et al. Ultrashort TE T1rho (UTE T1rho) imaging of the Achilles tendon and meniscus. Magn Reson Med. 2010;64(3). doi:10.1002/mrm.22474
Figures