2439
Values of stretched exponential model and fractional order calculus model in predicting microvascular invasion in hepatocellular carcinoma1The First Affiliated Hospital of Guangxi Medical University, Nanning, China, 2Siemens Healthineers, Wuhan, China
Synopsis
Keywords: Liver, Diffusion/other diffusion imaging techniques
This study aimed to evaluate the potential value of stretched exponential model (SEM) and fractional order calculus (FROC) diffusion model in predicting microvascular invasion (MVI) in hepatocellular carcinoma (HCC) before surgery. Our results showed that compared with MVI-negative group, MVI-positive group had significant lower DDC from SEM and D from FROC and significant higher α from SEM. DDC had the best diagnostic performance for MVI, D was next, and α was last. SEM and FROC models can predict the MVI of HCC, and the DDC, α, and D values were potential biomarkers in future clinical practice.Purpose
To evaluate the potential value of stretched exponential model (SEM) and fractional order calculus (FROC) diffusion model in predicting microvascular invasion (MVI) in hepatocellular carcinoma (HCC) before surgery.Materials and methods
The prospective study was approved by our Medical Ethics Committee. 76 patients with HCC confirmed by histopathological results were recruited between December 2021 to 2022. All patients underwent MR examinations on a 3T MRI scanner (MAGNETOM Prisma, Siemens Healthineers, Erlangen, Germany) with a 16 channel body coil. Besides conventional T1WI and T2WI sequences, a research application multi-b single-shot EPI with integratedshimming (iShim) DWI was performed with breath navigation under free breathing. The parameters were as follows: b values (excitation times): 0(1), 20(1), 50(1), 100(1), 150(1), 200(1), 600(1), 1000(2), 2000(4), 3000(6)s/mm2; TR: 4900 ms, TE: 57ms, field of view: 380 mm × 261 mm, matrix: 88×128, layer thickness: 5.0mm, bandwidth: 2442 Hz/pixel, acceleration factor: 2. All images were analyzed by two radiologists with 8 and 15 years of experience. Regions of interest (ROIs) was manually plotted on the b=1000s/mm2 DWI image using the T2-weighted image as a reference, and the areas of bleeding and necrosis were carefully avoided. The ROIs then were copied to all other parameter maps. The mean value of each parameter measured by two radiologists was finally analyzed. The parameters, DDC and α from SEM model, and D, β, and μ from FROC model, were calculated using a homemade software. MVI is defined as HCC cells with micrometastases present in liver vessels observed under the microscope. The data was analyzed using SPSS 25.0 (IBM Corp., Armonk/NY, USA). Independent sample t-test or Mann-Whitney U test was used to compare the difference between the MVI-positive group and MVI-negative groups. The receiver operating characteristic curve (ROC) was established to evaluate the diagnostic power. A p-value < 0.05 was considered statistically significant.Results
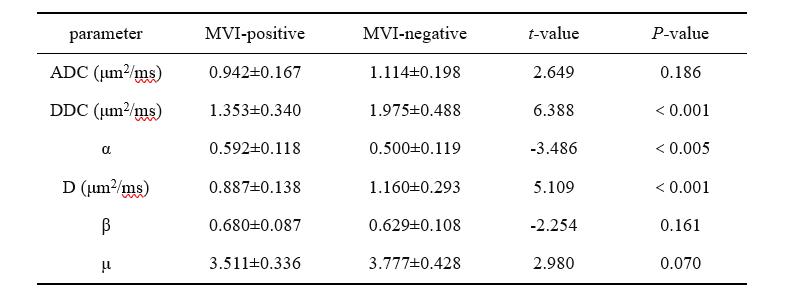
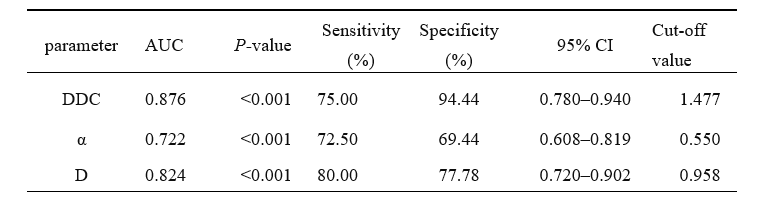
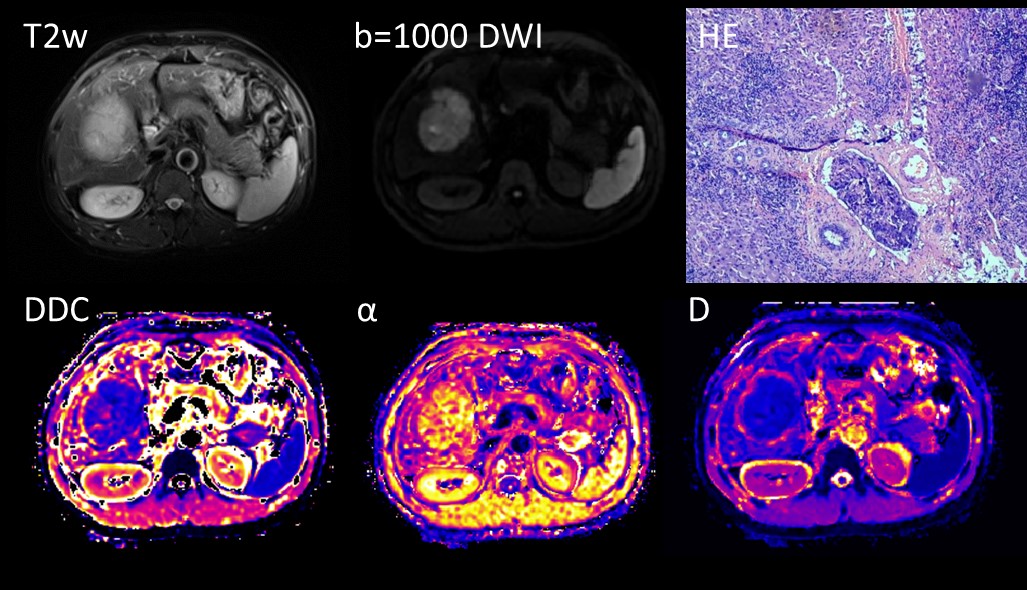
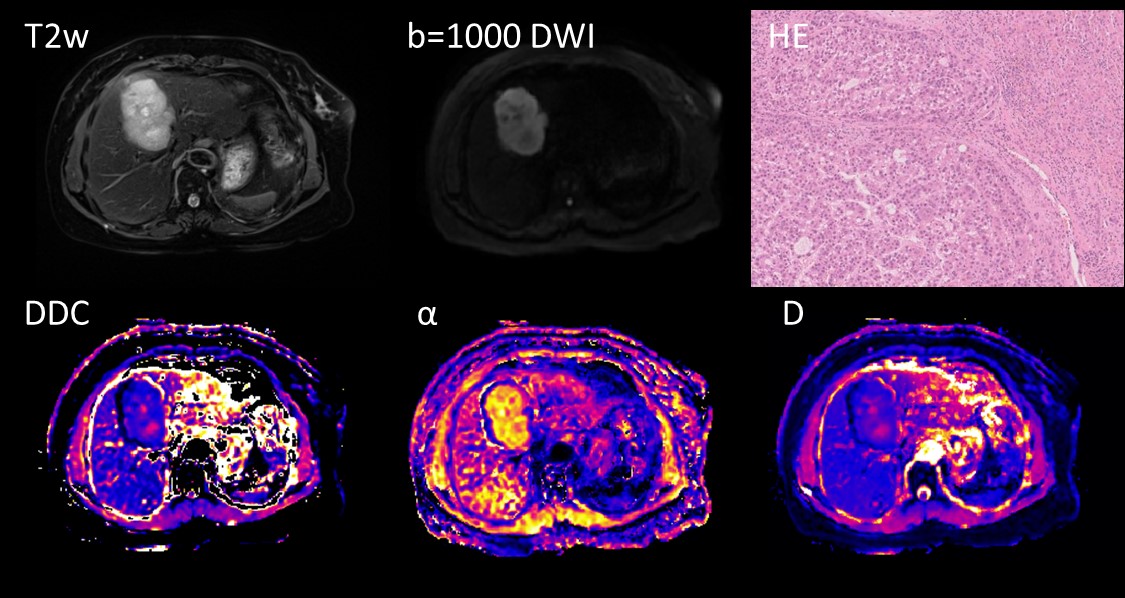
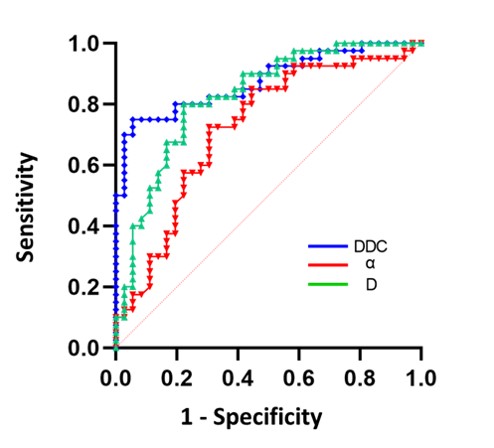
Of 76 patients, 40 cases (52.63%, mean age: 53.9±9.7 years) were diagnosed by histopathology as MVI positive, and 36 cases (47.37%, mean age: 51.4±11.0 years) as MVI negative.MVI-positive group had significant lower DDC and D and significant higher α compared with those in MVI-negative group (P<0.005) (Table 1). There was no statistical significance in other parameter (P>0.05). The representative images are shown in Figure 1 and Figure 2.DDC had the best diagnostic performance for MVI (AUC: 0.876, 95% CI: 0.780~0.940), D values also showed good diagnostic performance (AUC: 0.826, 95% CI: 0 .720~0.902), and then α (AUC: 0.722, 95%CI: 0.608~0.819) (Table 2, Figure 3).Discussion
Many researchers believe that ADC values in tumor tissues can not fully reflect the diffusion characteristics, and the inability to characterize and assess the MVI status of hepatocellular carcinoma greatly limits its clinical application [1-3]. Our results were consistent with their findings. Non-Gaussian diffusion models are significantly better at describing tumor tissue than ADCs, and better reflect the true spread of tissues with high heterogeneity and complexity of processes and microstructures [2,4]. It has been suggested that DDC is related to the density of cells in tissues, suggesting that lower DDC values may be related to more aggressive biological behavior in tumor tissues [5,6]. MVI is a marker of highly aggressive tumor biological behavior in hepatocellular carcinoma [5], providing a pathway for tumor cells to spread to the surrounding normal liver parenchyma, and this abnormal way of spreading is more common in tissues [7], thus competing for normal water molecule diffusion, resulting in the lower DDC value. In addition, microvascular tumor emboli in MVI-positive hepatocellular carcinoma may impede the movement of water molecules and affect their interaction with cell membranes, and the complexity of the microstructure of tumor tissue is increased. The D value from FROC, similar with DDC, had the same decreased trend. α represents the heterogeneity of the diffusion component of water molecules within the tissue. In the study of Nieun Seo et al., α was reduced by the increased heterogeneity of diffusion in vivo by liver fibrosis, and α is inversely proportional to tissue heterogeneity [8]. However, this study showed the opposite trend, with MVI-positive groups having higher α. The reason may be that micronecrotic foci and micro-bleeding areas in ROI were completely removed although we carefully sketched. Kim et al. indicated that α was related to the degree of tumor necrosis [6], as opposed to liver cancer tissue. The low density of viable cells in the micronecrotic region resulted in a more homogeneous tumor microstructure [7], counteracting the decrease in α values due to increased tissue heterogeneity. β and μ values can characterize the heterogeneity of tissue within voxels and the average free length of diffuse molecules [9]. This study showed no difference in β and μ between the two groups. The reason may be that they were insensitive to differences in heterogeneity between the homo-pathological subtypes of hepatocellular carcinoma, but were sensitive in differentiating between different grades of tumors, such as high- and low-grade bladderurothelial carcinoma or pediatric brain tumors [10, 11].Conclusion
SEM and FROC models can predict the MVI of HCC, and the DDC, α, and D values were potential biomarkers in future clinical practice.Acknowledgements
This work was supported by the National Natural Science Foundation of China and the Innovation Project of Guangxi Graduate Education (Grant numbers 8203101220038D and YCSW2022228).References
[1] Le Bihan D. Apparent diffusion coefficient and beyond: what diffusion MR imaging can tell us about tissue structure. Radiology. 2013; 268(2):318-322. doi:10.1148/radiol.13130420
[2] Iima M, Le Bihan D. Clinical Intravoxel Incoherent Motion and Diffusion MR Imaging: Past, Present, and Future. Radiology. 2016; 278(1):13-32. doi:10.1148/radiol.2015150244
[3] Tang L, Zhou XJ. Diffusion MRI of cancer: From low to high b-values. J Magn Reson Imaging. 2019; 49(1):23-40. doi:10.1002/jmri.26293
[4] Jensen JH, Helpern JA. MRI quantification of non-Gaussian water diffusion by kurtosis analysis. NMR Biomed. 2010; 23(7):698-710. doi:10.1002/nbm.1518
[5] Noda Y, Goshima S, Fujimoto K, et al. Comparison of the Diagnostic Value of Mono-exponential, Bi-exponential, and Stretched Exponential Signal Models in Diffusion-weighted MR Imaging for Differentiating Benign and Malignant Hepatic Lesions. Magn Reson Med Sci. 2021; 20(1):69-75. doi:10.2463/mrms.mp.2019-0151
[6] Kim HC, Seo N, Chung YE, Park MS, Choi JY, Kim MJ. Characterization of focal liver lesions using the stretched exponential model: comparison with monoexponential and biexponential diffusion-weighted magnetic resonance imaging. Eur Radiol. 2019; 29(9):5111-5120. doi:10.1007/s00330-019-06048-4
[7] Witjes CD, Willemssen FE, Verheij J, et al. Histological differentiation grade and microvascular invasion of hepatocellular carcinoma predicted by dynamic contrast-enhanced MRI. J Magn Reson Imaging. 2012; 36(3):641-647. doi:10.1002/jmri.23681
[8] Seo N, Chung YE, Park YN, Kim E, Hwang J, Kim MJ. Liver fibrosis: stretched exponential model outperforms mono-exponential and bi-exponential models of diffusion-weighted MRI. Eur Radiol. 2018; 28(7):2812-2822. doi:10.1007/s00330-017-5292-z
[9] Zhou XJ, Gao Q, Abdullah O, Magin RL. Studies of anomalous diffusion in the human brain using fractional order calculus. Magn Reson Med. 2010; 63(3):562-569. doi:10.1002/mrm.22285
[10] Feng C, Wang Y, Dan G, et al. Evaluation of a fractional-order calculus diffusion model and bi-parametric VI-RADS for staging and grading bladder urothelial carcinoma. Eur Radiol. 2022; 32(2):890-900. doi:10.1007/s00330-021-08203-2
[11] Sui Y, Wang H, Liu G, et al. Differentiation of Low- and High-Grade Pediatric Brain Tumors with High b-Value Diffusion-weighted MR Imaging and a Fractional Order Calculus Model. Radiology. 2015; 277(2):489-496. doi:10.1148/radiol.2015142156
Figures