2436
Liver lesion detection : Comparison of different flip angle and delay time
Xue Ren1, Ying Zhao1, Qingwei Song1, Zhigang Wu2, and Ailian Liu1
1The First Affiliated Hospital of Dalian Medical University, Dalian, China, 2Clinical and Technical Support, Philips Healthcare, Shenzhen, China
1The First Affiliated Hospital of Dalian Medical University, Dalian, China, 2Clinical and Technical Support, Philips Healthcare, Shenzhen, China
Synopsis
Keywords: Liver, Liver
Detection of liver lesion remains challenge since the contrast to noise ratio is always changing after intravenous bolus injection of Gd-BOPTA between lesion and liver tissue. The purpose of the study was to compare the lesion-to-liver CNR for different schemes using different flip angle and delay time. The results shows that the protocol of 60min FA10°could be used as the preferred scanning parameter, it could also be used to save the scan time.Introduction
Gadobenate dimeglumine (Gd-BOPTA) is a new type of hepatocellular specific contrast agent, which can be specifically ingested by normal hepatocellular cells [1], while less ingested by cells with impaired hepatocellular function. This feature gives GD-BOPTA a unique advantage in the detection and evaluation of liver lesions.As an important parameter of MRI imaging, flip angles (FA) has been confirmed to have a certain impact on image quality [2]. Increasing FA can increase the contrast of hepatobiliary stage images [3]. In various studies of Gd-BOPTA, the delay time of HBP scanning was also different, mainly concentrated in 40~120 minutes after injection of contrast agent. At present, there is no exact and recognized turning Angle and delay time for Gd-BOPTA enhanced MRI scanning, and no relevant research reports have been reported at home and abroad.Materials and Methods
This study was approved by the local IRB. A total of 35 patients were included in this retrospective study. All patients underwent Gd-BOPTA-enhanced MRI examination. T1W, T2WI, and DWI were performed on a 3.0 T MR scanner using a 16-channel abdominal array coil (Ingenia CX, Philips Healthcare) with parameters listed in Table 1. Intravenous bolus injection of Gd-BOPTA was performed, and FA10°, FA15°, FA20°, FA25°, and FA30° hepatobiliary phase imaging was performed with a delay of 60 minutes and 120 minutes after contrast agent injection, respectively. MR raw data were transferred to the workstation (Intellispace Portal v10, Philips Healthcare) for post-processing. Regions of interest (ROIs) were placed in the left lobe of the liver, the right anterior lobe of the liver and the right posterior lobe of the liver, avoiding blood vessels and other abnormal liver tissue, we placed the ROIs on the muscles on both sides of the same layer of the paravertebral, in the lesions. Three ROIs were placed on the largest layer, and ROIs were placed on both sides of the paravertebral muscles at the same layer, and the average value of the above parameters was taken for further analysis. Signal intensity (SI), standard deviation (SD), signal-to-noise ratio (SNR), contrast-to-noise ratio (CNR), and liver-to-lesion ratio (LLR) were measured and calculated, and the calculation formula were as follows: SNRLesion=SILesion/SDmuscle, CNRLesion=(SILesion-SImuscle)/SDmuscle, LLR=(SILiver-SILesion)/SILiver. The Mann-Whitney U test was used to compare SNR, CNR, and LLR between scanning groups with Dynamic enhancement and hepatobiliary phases with different flip angles and delay times, and the Friedman test was used for pairwise comparison within groups.Results
The comparison results between scanning groups were shown in Table2 to Table 4. The SNR of the 60min FA15° group and the CNR of the 60min FA30° group was better than others, but there are no statistical differences compared with others (Table2 and 3). The LLR of the 60min FA10° group has the highest value than others, and there were significant statistical differences compared with the 60min FA15°, 60min FA20°, 60min FA25°, 60min FA30°, 120min FA11° and 120min FA15°groups (both p<0.05) (Table2 and 4).Conclusion
In conclusion, the gadoxetic acid-enhanced MRI protocol with shorter delay time and lower flip angle scheme 60min FA10° has obvious higher lesion-to-liver CNR in the image display and liver lesion visualization. When taking into account the image display and bile duct visualization, the protocol of 60min FA10° could be used as the preferred scanning parameter, it could also be used to save the scan time.Acknowledgements
NoneReferences
1. Stocker D, Hectors S, Bane O, et al. Dynamic contrast-enhanced MRI perfusion quantification in hepatocellular carcinoma: comparison of gadoxetate disodium and gadobenate dimeglumine[J]. Eur Radiol, 2021, 31(12): 9306-9315. DOI:10.1007/s00330-021-08068-5.2. Ibrahim EH, Arpinar VE, Muftuler LT, et al. Cardiac functional magnetic resonance imaging at 7T: Image quality optimization and ultra-high field capabilities[J]. World J Radiol. 2020,12(10):231-246. DOI:10.4329/wjr.v12.i10.2313. Inoue Y, Hata H, Nakajima A, et al. Quantitative Evaluation of Display Contrast of Gd-EOB-DTPA-Enhanced Magnetic Resonance Images: Effects of the Flip Angle and Grayscale Gamma Value[J]. Radiol Res Pract. 2019,2019:7630671. DOI: 10.1155/2019/7630671.Figures
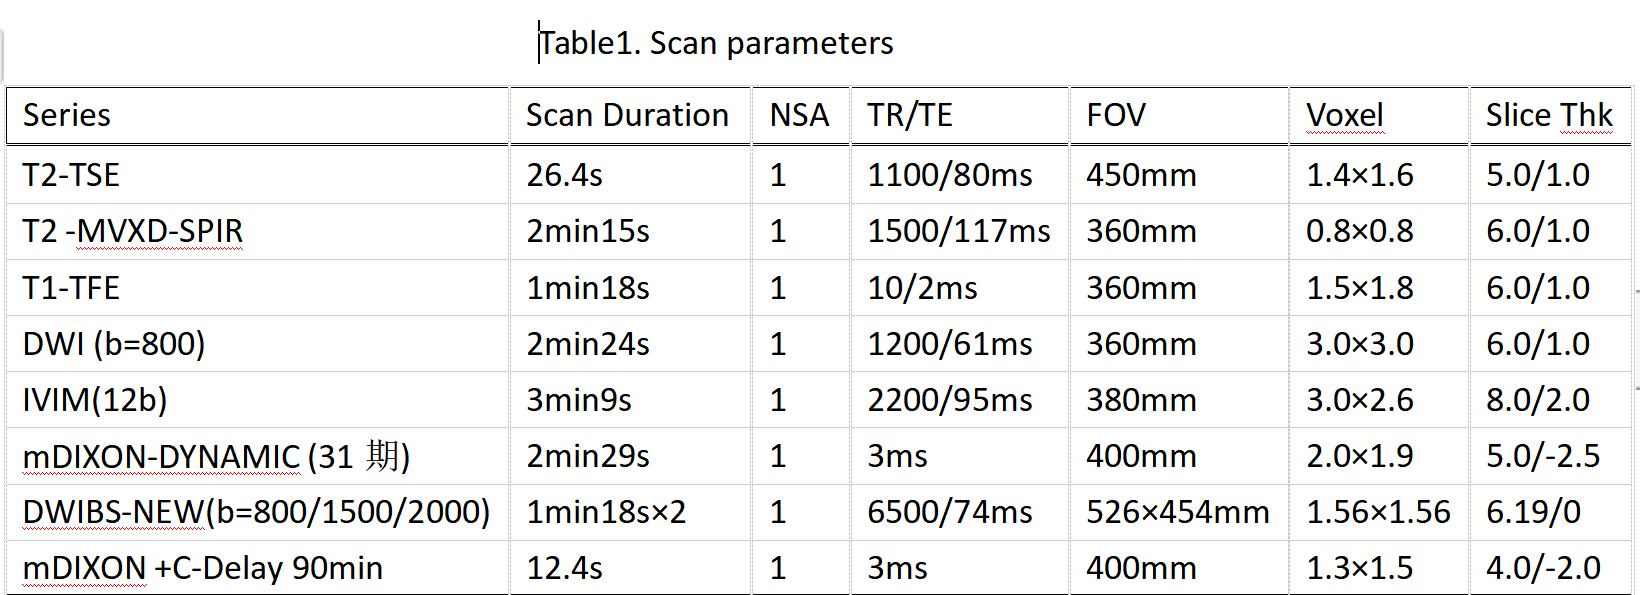
Table 1
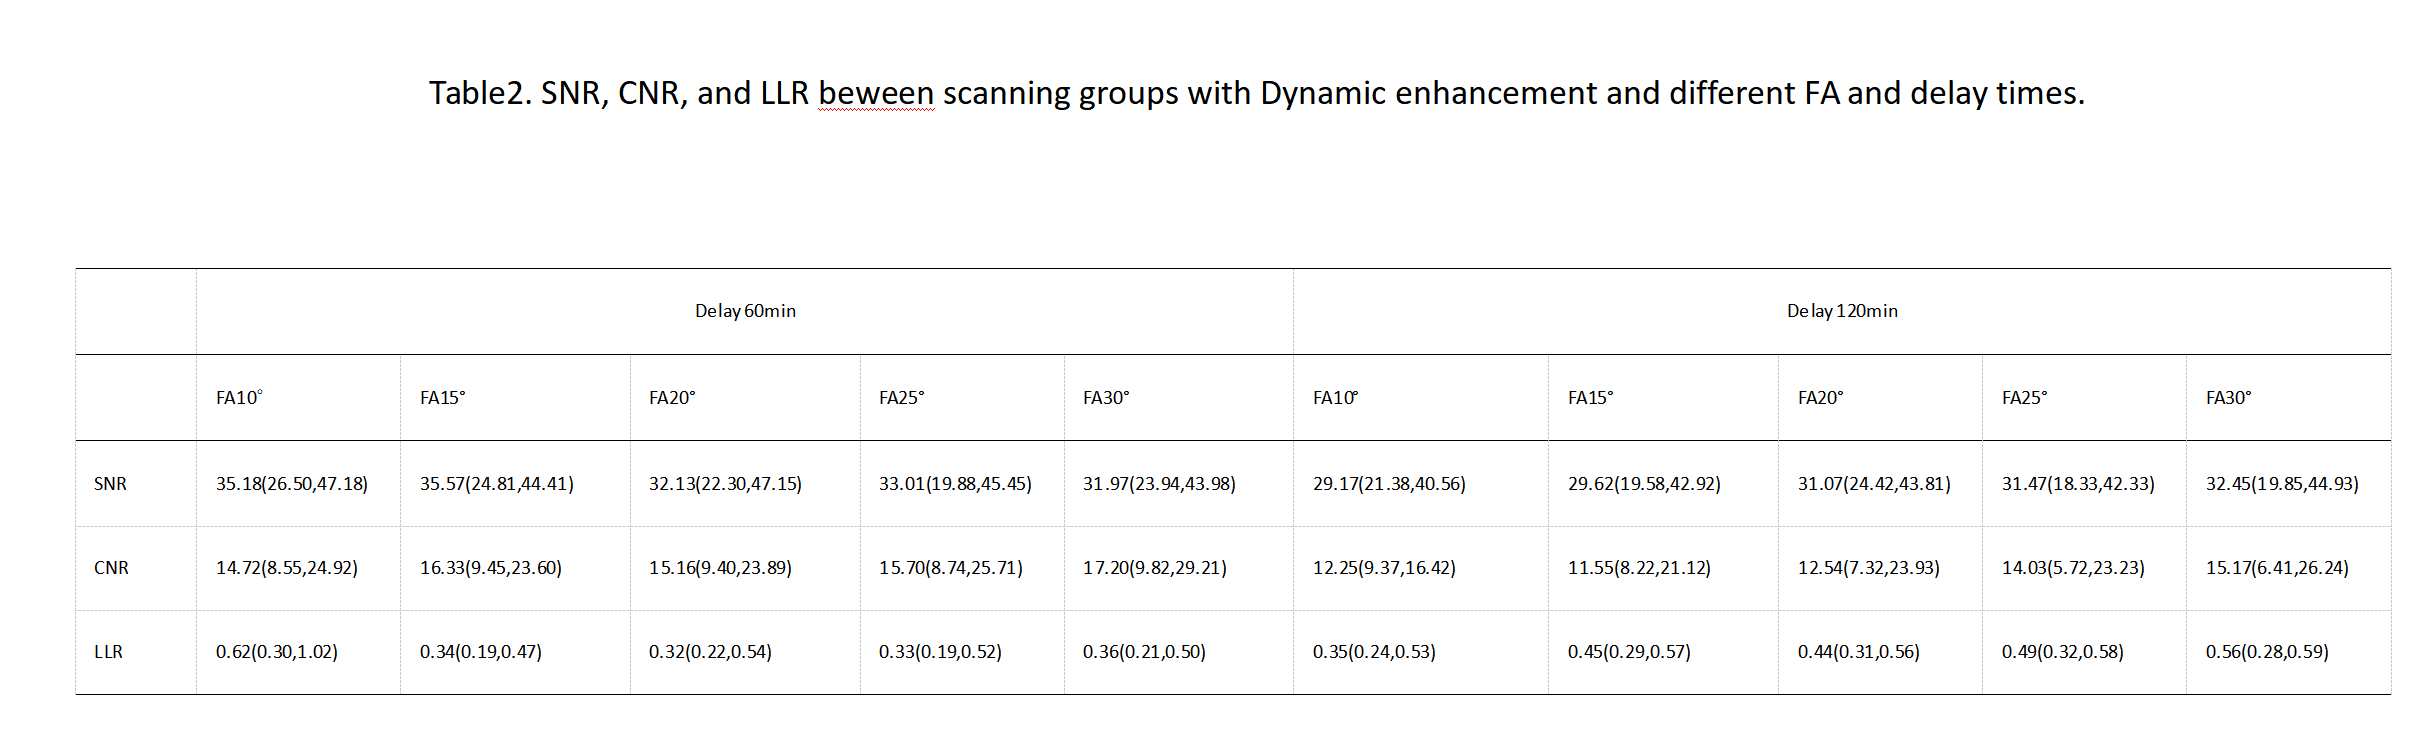
Table 2
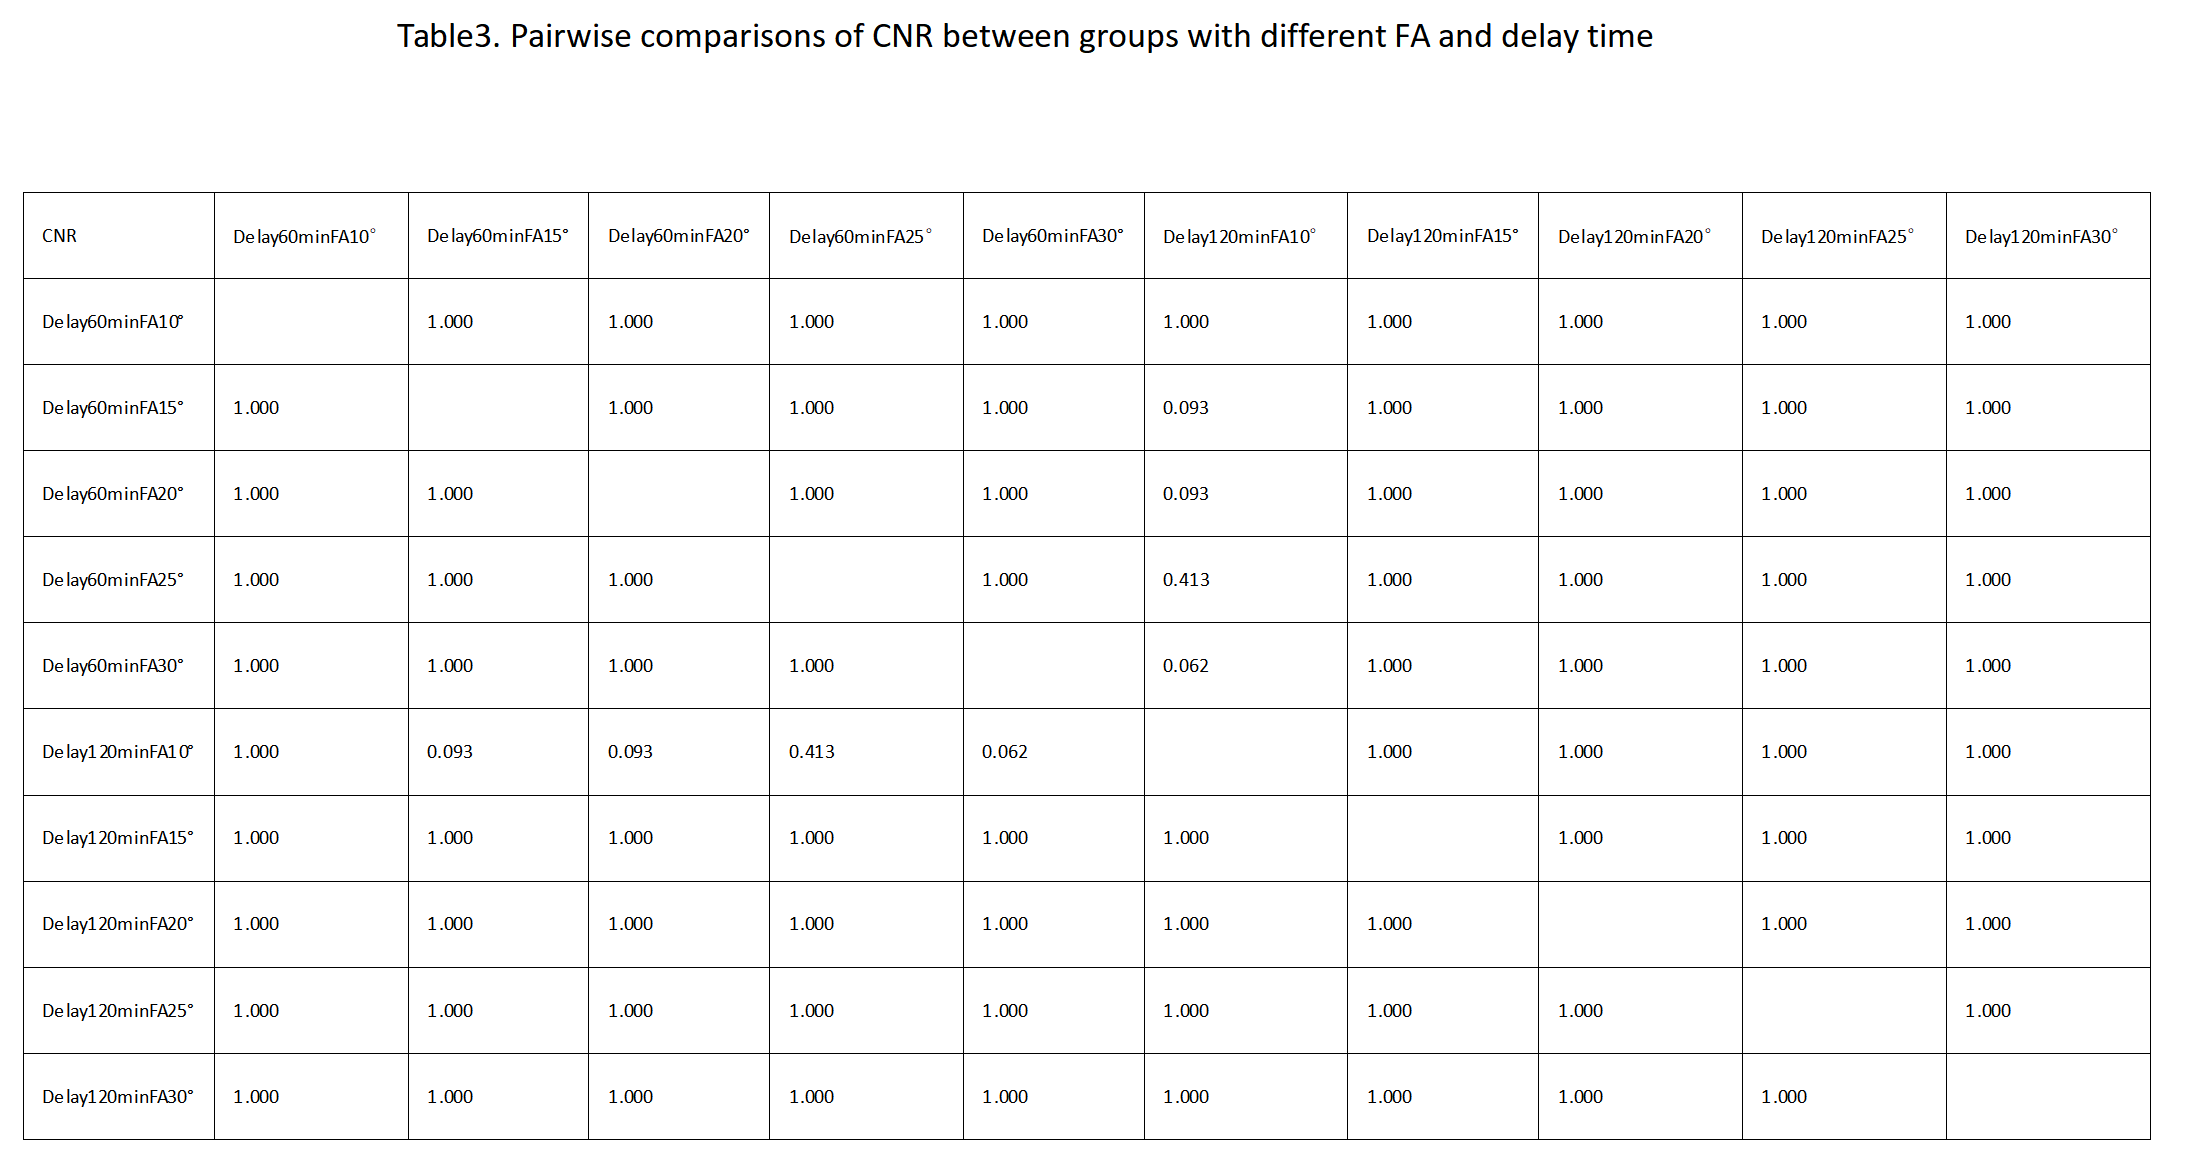
Table 3
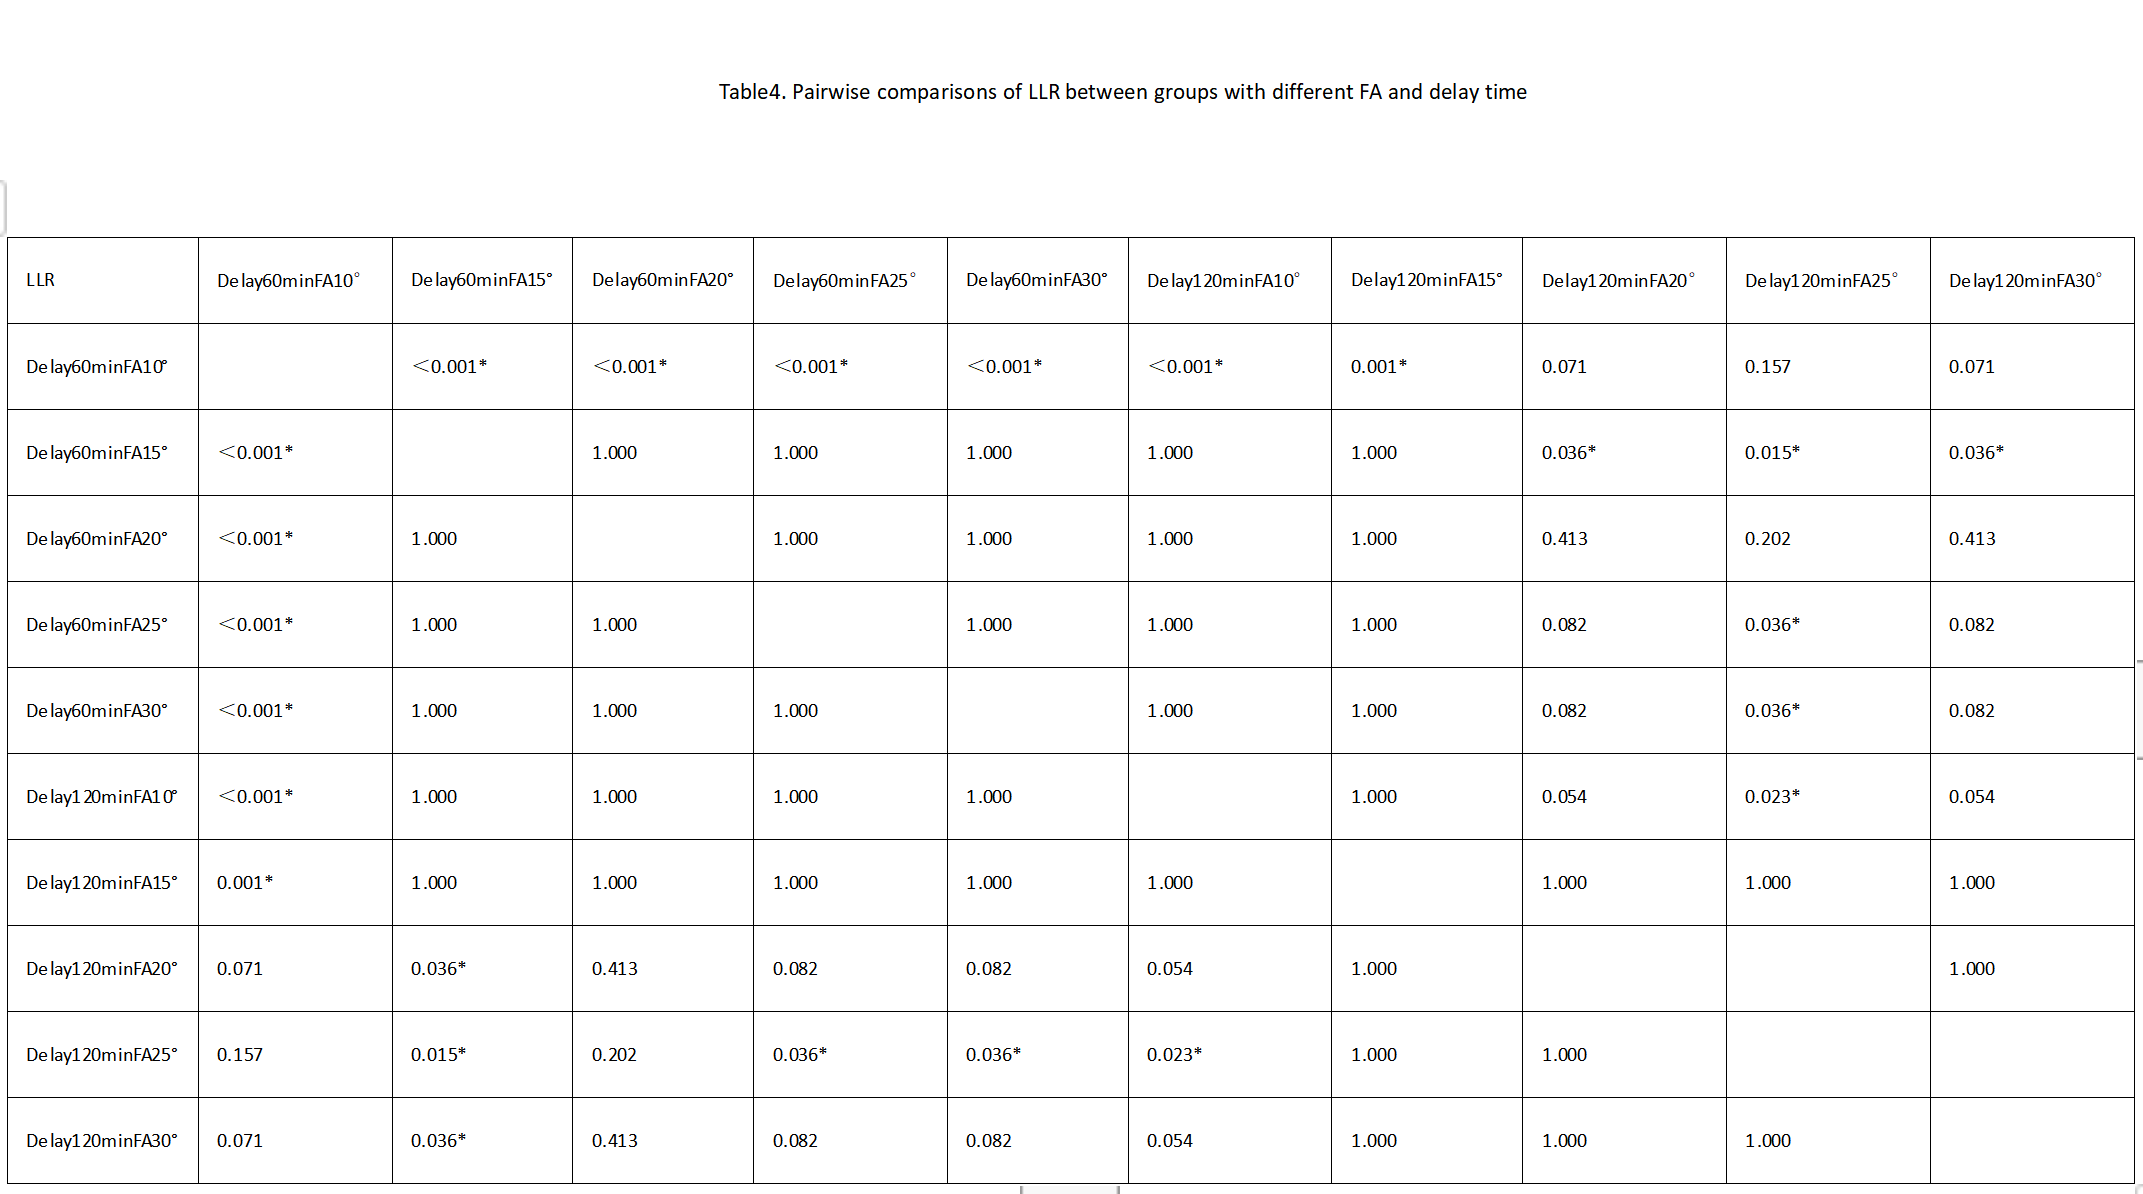
Table 4
DOI: https://doi.org/10.58530/2023/2436