2429
Automatic Quantification of Total Cerebral Blood Flow from Phase-Contrast MRI Using Deep Learning1School of Electronic and Electrical Engineering, Kyungpook National University, Daegu, Korea, Republic of, 2Department of Radiology, Seoul St. Mary’s Hospital, College of Medicine, The Catholic University of Korea, Seoul, Korea, Republic of
Synopsis
Keywords: Machine Learning/Artificial Intelligence, Quantitative Imaging
In this work, we aim to develop a deep learning (DL)-based processing pipeline that enables rapid and correct segmentation of brain-feeding arteries in neck phase-contrast (PC) MR images, thereby achieving accurate quantification of total cerebral blood flow (tCBF) in an automated manner. To this end, we implemented a U-Net architecture where magnitude/phase-combined PC images are provided for network training. The results suggest that the present, automated method yields accurate measurements of tCBF in comparison to ground truth values obtained from manual vessel segmentation.
Introduction
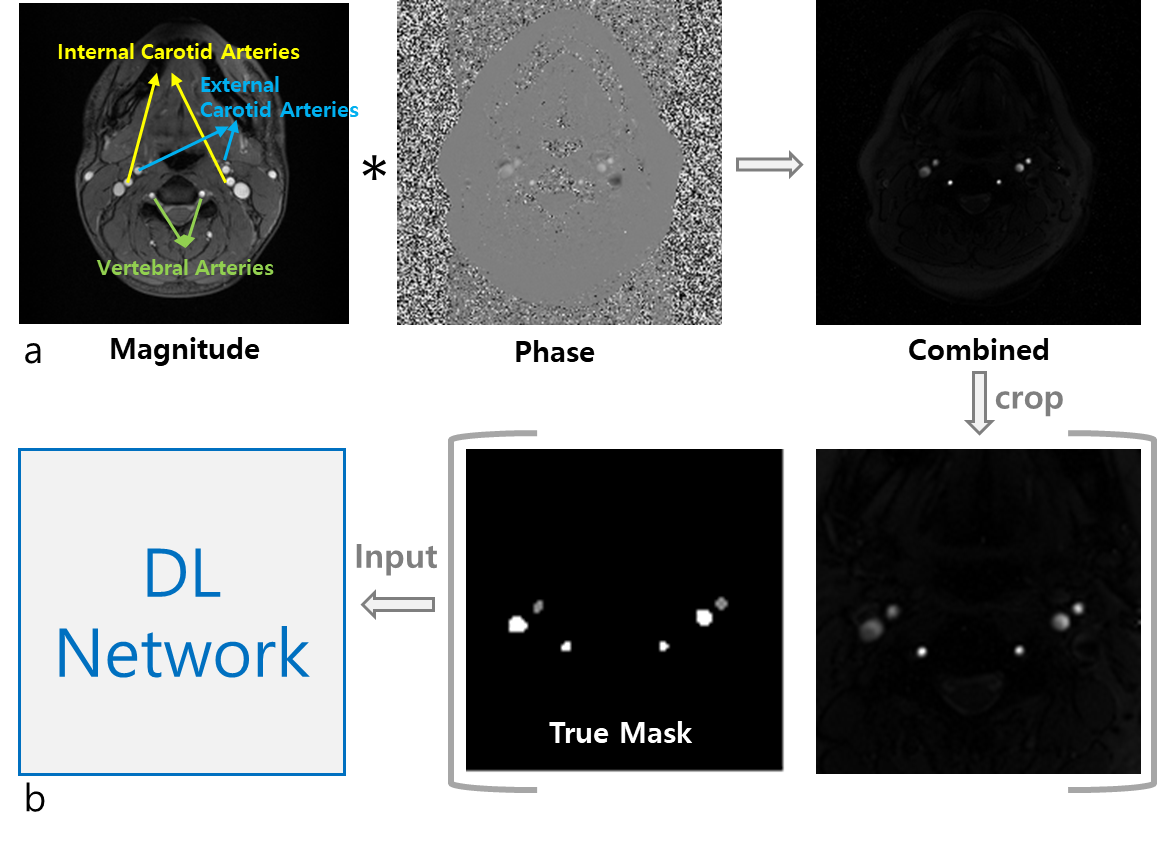
Phase-contrast (PC) MRI1 yields an excellent velocity contrast for blood vessels against surrounding static tissues, and thus has been widely used in clinics for assessing vascular health and disease. Furthermore, total cerebral blood flow (tCBF) can be measured, typically in units of ml blood per minute per 100g tissue, from the method’s blood velocity maps. Specifically, the four arterial blood vessels supplying blood to the brain (Figure 1a – left/right pairs of internal carotid arteries (ICAs) and vertebral arteries (VAs)) are selected, and flow rates therein are computed that are then finally normalized by brain mass obtained from a separate scan. While tCBF itself is an important biomarker in a number of diseases, for instance, pertinent to cognitive function2 and neurological disorders3, the hemodynamic information must be known a priori in assessment of cerebral oxygen metabolism4. Hence, it is crucial in tCBF quantification to correctly select the four brain-feeding arteries. Nevertheless, manual segmentation of such vessels-of-interest is often time-consuming as well as being subjective, in particular, on patient images presenting complex vessel geometries, thus potentially affecting the accuracy of tCBF measurements. The purpose of this work was to develop a deep learning (DL)-based processing pipeline that enables rapid, automatic, and accurate segmentation of ICAs and VAs in neck PC MR images.Methods
Data acquisitions: All datasets in this study were collected at 3T (Siemens Vida). Imaging parameters in PC MRI were: TR = 20 ms, TE = 5.5 ms, flip-angle: 12 degrees, flow-encoding along the z-direction (parallel to main magnetic field), velocity-encoding: 60 cm/s, matrix size = 208 x 208, field-of-view = 208 x 208 mm2, averages = 5, and total scan time = 42 seconds. Prior to running PC MRI, sagittal vessel scout images were acquired to select a neck slice above the carotid bifurcation. Additionally, a T1-weighted MP-RAGE scan was performed to obtain brain mass. The experimental protocol above was applied to 140 patients in two different clinical situations; (1) patients who visited memory clinics, and (2) patients who visited neurovacular unit, with suspicion or known of steno-occlusive arterial lesions in craniocervical arteries.Data preprocessing: To enhance the performance and efficiency of DL network training, two strategies were conceived. First, magnitude and phase PC images were combined in a similar manner to susceptibility weighted imaging5, leading to enhanced arterial contrast with venous blood vessels effectively suppressed (Figure 1a). Second, given that the vessels-of-interest reside in the central area of the neck images obtained, the magnitude/phase-combined images were cropped into the central quarter region (104 x 104), thereafter being used for vessel labeling and subsequent DL training (Figure 1b). In the combined images, signal intensities of external carotid arteries (ECAs), which do not supply blood to the brain, are comparable to those of ICAs and VAs. Hence, in the labeling procedure three groups were assigned labels, i.e., ICAs/VAs, ECAs, and background.
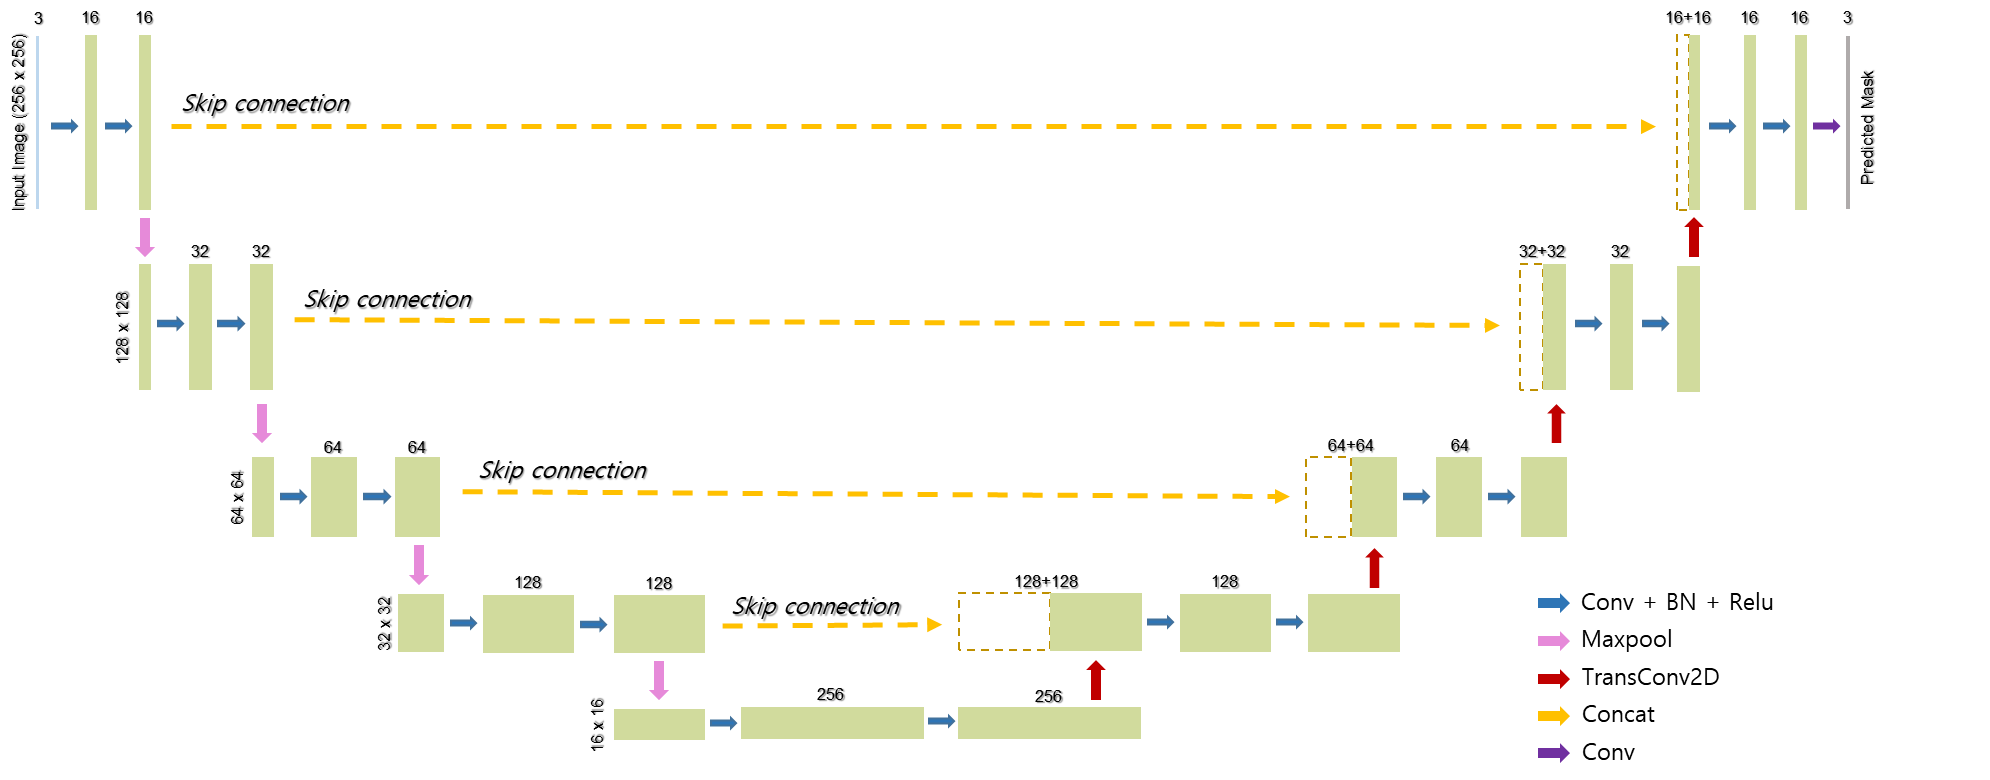
DL network training: Building upon the basic structure of the U-Net6 comprising the contracting and expanding paths along with skip connections, we adapted the original model so as to make it suited to our multiclass segmentation problem (Figure 2). Specifically, categorical cross-entropy was employed as a loss function, given by:
$$J(w)=-\frac{1}{N}\sum_{i=1}^{N}[t_{i}log(y_{i})+(1-t_{i})log(1-y_{i})]$$
where w is the weights of the neural network, $$$t_{i}$$$ is the true label, $$$y_{i}$$$ is the predicted label, i is the class index, and N is the number of classes (here, N = 3). Furthermore, the input image size was scaled from 104 x 104 to 256 x 256 in order to fit with the four steps of contraction and expansion. Parameters used in the training step were: drop-out rate = 0.2, batch size = 32, number of epochs = 300, and learning rate = 0.0001 with an Adam optimizer. With 120 pairs of combined images and true labels, the DL model was trained using the TensorFlow package (version 2.9.1). The training time was about one hour on a NVIDIA SUPRIM X GPU with 24 GB memory.
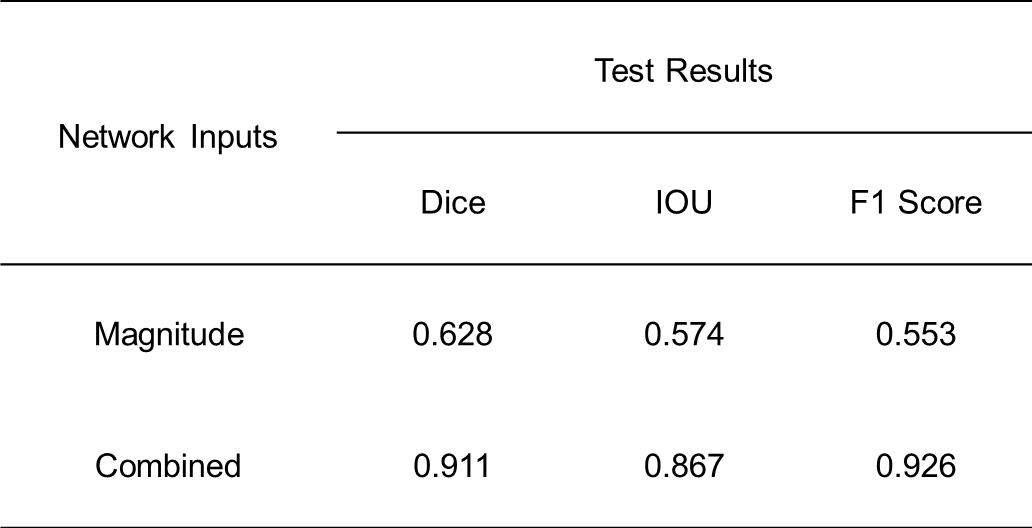
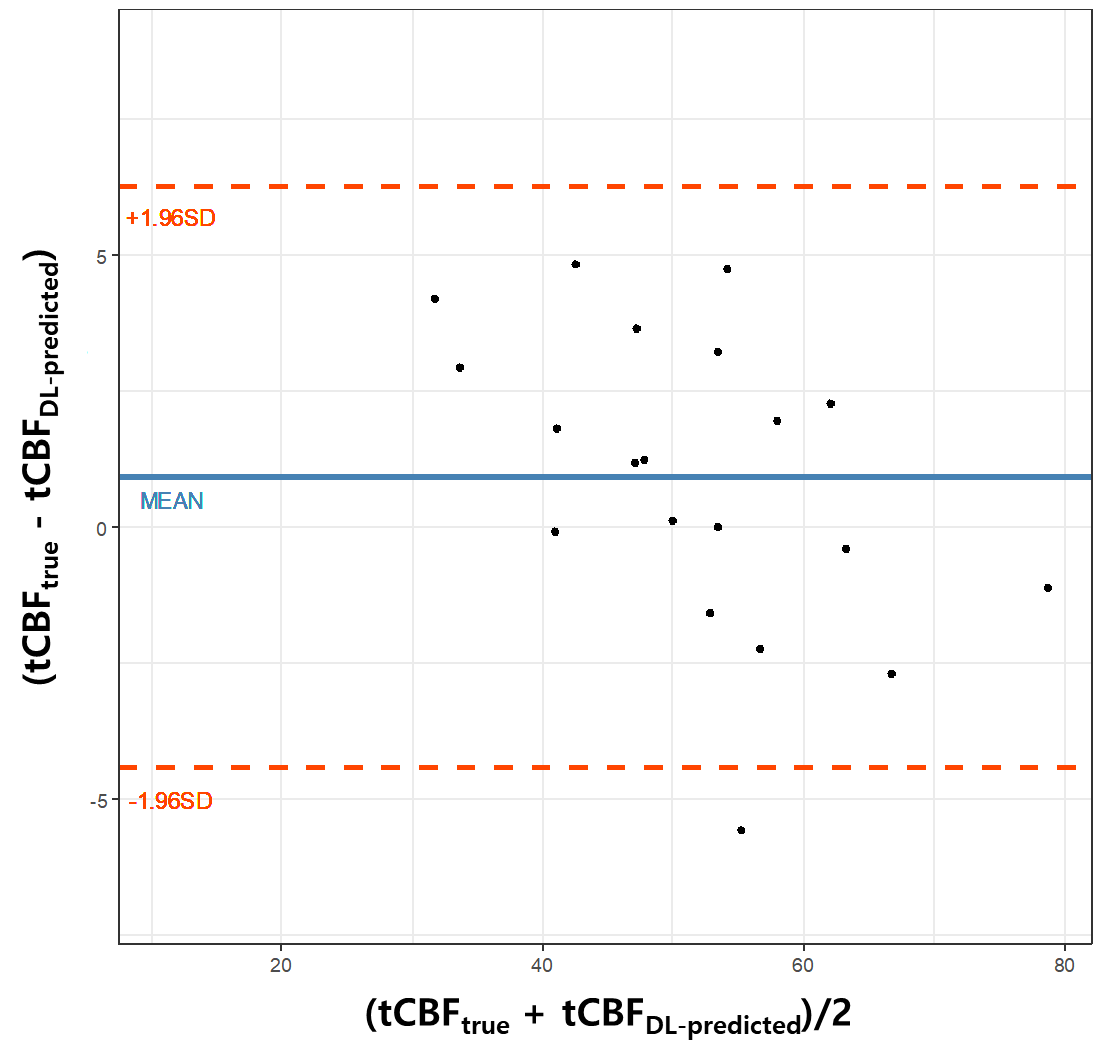
DL network evaluations: The performance of the trained network was evaluated on 20 test datasets by calculating Dice, IOU, and f1 scores. Here, the effectiveness of using the combined images as network input was examined in comparison to the case where PC magnitude images were provided in network training. Finally, tCBF values were quantified in the test datasets using the true and predicted vessel masks, respectively, and then were compared using Bland-Altman analysis and paired t-test.
Results
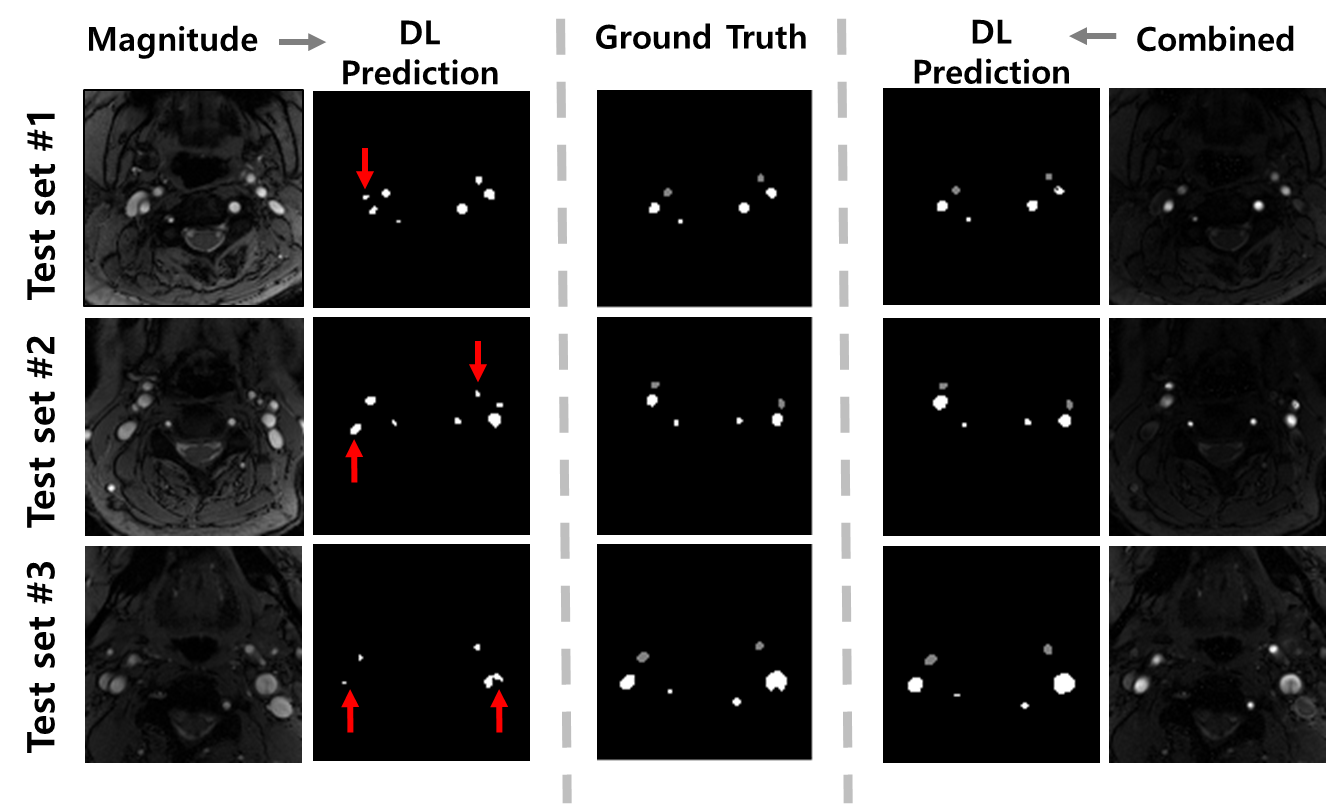
With the magnitude images supplied, the DL model fails in distinguishing brain-feeding arteries from other blood vessels including veins, whereas with the combined images provided, it correctly captures the four arteries-of-interest with ECAs discriminated (Figure 3). Table 1 summarizes the Dice, IOU, and f1 scores obtained in the two scenarios. The Bland-Altman analysis (Figure 4) and paired t-test (p = 0.15) reveal that manual segmentation and DL prediction yield a statistically nonsignificant difference in the tCBF quantification.Discussion and Conclusions
We developed an automatic tCBF quantification method by implementing DL-based segmentation of brain-feeding arteries in magnitude/phase-combined PC images. The results suggest that the method yields accurate tCBF measurements, albeit in limited test datasets. Further validation with a large number of patient populations is thus warranted.Acknowledgements
NRF Korea grant 2021R1F1A1045621References
1. Wymer DP, Patel KP, Burke III WF, and Bhatia VH. Phase-Contrast MRI: Physics, Techniques, and Clinical Applications. RadioGraphics 2020;40(1):122-140
2. Poels MM, Ikram MA, Vernooij MW, Krestin GP, Hofman A, Niessen WJ, van der Lugt A, Breteler MM. Total cerebral blood flow in relation to cognitive function: the Rotterdam Scan Study. J Cereb Blood Flow Metab. 2008 Oct;28(10):1652-5.
3. Knoops AJ, van der Graaf Y, Appelman AP, Mali WP, Geerlings MI. Total cerebral blood flow and hippocampal volume in patients with arterial disease. The SMART-MR study. J Cereb Blood Flow Metab. 2009 Oct;29(10):1727-33.
4. Jain V, Langham MC, Wehrli FW. MRI estimation of global brain oxygen consumption rate. J Cereb Blood Flow Metab. 2010;30(9):1598-607.
5. Haacke EM, Xu Y, Cheng YC, Reichenbach JR. Susceptibility weighted imaging (SWI). Magn Reson Med. 2004 Sep;52(3):612-8.
6. Ronneberger, O., Fischer, P., and Brox, T. (2015). U-Net: Convolutional Networks for Biomedical Image Segmentation. arXiv:1505.04597
Figures