2427
Artificial Neural Network for Intravoxel Incoherent Motion Fitting: an Application in Glioma1University of São Paulo, Ribeirão Preto, Brazil, 2Instituto de Radiologia e Departamento de Radiologia e Oncologia, Faculdade de Medicina, Universidade de Sao Paulo, São Paulo, Brazil
Synopsis
Keywords: Data Processing, Diffusion/other diffusion imaging techniques
We proposed an Artificial Neural Network (ANN) to fit the IVIM images and estimate diffusion, pseudo-diffusion, and perfusion fraction values. The ANN was first trained with simulated data and tested with images of 40 healthy controls and one patient with glioma. ANN provided parameter values similar to those obtained with a standard fitting method, but D* maps with less noise. The ANN fitting process was less time-consuming and was shown to be a possible tool for replacing a standard fitting algorithm.Main Findings
Our trained Artificial Neural Network provided IVIM parameters similar to those obtained with a traditional fitting method but with an optimized computing time.Background
Intravoxel Incoherent Motion (IVIM) analyzes microvascular perfusion by exploring a scaling in diffusion weighting. The signal is modeled in terms of the acquired b-values. The technique and the bi-exponential model of signal interpretation were introduced in 1986 by Denis Le Bihan¹.$$\frac{S(b)}{S_0}=(1-f)e^{(-bD)}+fe^{(-bD^*)}$$
D is the diffusion coefficient, D* is the pseudo-diffusion coefficient, and f is the perfusion fraction. Different fitting methods have been proposed to obtain D, D*, and f maps. Artificial Neural Networks (ANN) have been studied as an alternative to fit the IVIM complex data, aiming to improve the regression analysis and the IVIM parameters estimation2,3. In this study, we evaluated an ANN to obtain the parameters maps, comparing the results obtained with the Non-negative Least Squares (NNLS) method.
Methods
We simulated IVIM signals with 15 b-values (0, 4, 8, 16, 30, 60, 120, 250, 500, 1000, 1200, 1400, 1600, 1800, 2000 s/mm²). As training ground truth, we used typical values for the white and gray matter and brain with D, D*, and f 0.00081 mm²/s, 0.022 mm²/s, and 0.2 described in [4]. We also added rician noise with SNR of 10, 15, and 20 on our simulated data.The ANN architecture proposed is a feedforward neural network with an input layer of 15 nodes, three hidden layers of 15 nodes each, and an output of four nodes. We implemented the Adam optimization algorithm5 for the gradient descent method. We trained the network with the simulated data with 800000 signals distributed between tissue values and SNR.
Images from 40 healthy subjects, and one glioma patient we used to test the network and estimate D, D*, and f maps. Such images were first pre-processed using SPM 12 and FSL for motion correction and tissue segmentation (white matter - WM, and gray matter - GM). The mean values of each parameter were compared with that obtained from images fitted by an NNLS method.
Results
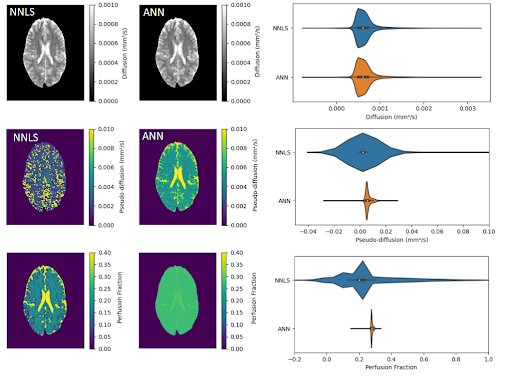
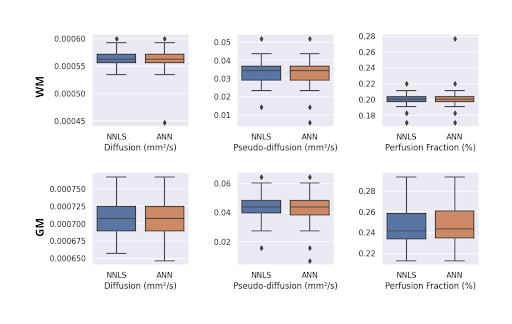
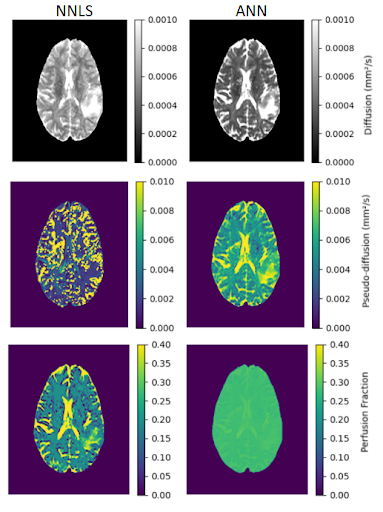
Figure 1 shows the maps of the three parameters obtained for a healthy subject. D maps showed similar contrasts and value distribution, comparing both fitting methods. D* map obtained from the ANN showed better visual contrast among tissues and less noise, while the f map was also less noisy for the ANN fitting. Figure 2 shows the mean values for all healthy subjects. We calculated the SNR for each subject, the ANN maps D, D* and f were 23.9, 4.1 and 14.2 for the WM, and 29.3, 3.8 and 12.6 for the GM. For the NNLS fitting, D, D* and f were 37.7, 5 and 26.4 for the WM, and 31.5, 4.5 and 13 for the GM. For a patient with glioma, we got a better contrast for the tumor in the D* map obtained with the ANN (figure 3). Moreover, the ANN took 30 seconds to provide the maps for a subject, while the NNLS method took 50 minutes.Discussion
ANN provided IVIM parameter maps with good contrast between tissues and similar average values compared to the NNLS method maps. Such values were consistent with those reported in the literature for WM and GM4. However, D* and f maps were less noisy for the ANN fitting. Moreover, such a process was less time-consuming. Our next steps are to analyze residuals to check the fitting consistency and make tests to improve the quality of the f maps.Conclusion
ANN is a possible tool for replacing a standard fitting algorithm. Training with simulated data provided better control and understanding of the neural network. The ANN can obtain estimation of parameters with lower computation time and equivalent mean values.Acknowledgements
No acknowledgement found.References
1. D. Le Bihan et al. MR imaging of intravoxel incoherent motions: application to diffusion and perfusion in neurologic disorders. In: Radiology 161.2 (1986), pp. 401–407. doi: 10.1148/radiology.161.182.3763909.
2. Barbieri, S, Gurney-Champion, OJ, Klaassen, R, Thoeny, HC. Deep learning how to fit an intravoxel incoherent motion model to diffusion-weighted MRI. Magn Reson Med. 2020; 83: 312– 321. https://doi.org/10.1002/mrm.27910
3. Kaandorp, MPT, Barbieri, S, Klaassen, R, et al. Improved unsupervised physics-informed deep learning for intravoxel incoherent motion modeling and evaluation in pancreatic cancer patients. Magn Reson Med. 2021; 86: 2250– 2265. https://doi.org/10.1002/mrm.28852
4. Chabert, S., Verdu, J., Huerta, G., Montalba, C., Cox, P., Riveros, R., Uribe, S., Salas, R., & Veloz, A. (2020). Impact of b-Value Sampling Scheme on Brain IVIM Parameter Estimation in Healthy Subjects. In Magnetic Resonance in Medical Sciences (Vol. 19, Issue 3, pp. 216–226). Japanese Society for Magnetic Resonance in Medicine. https://doi.org/10.2463/mrms.mp.2019-0061
5. Kingma, Diederik P., and Jimmy Ba. "Adam: A method for stochastic optimization." arXiv preprint arXiv:1412.6980 (2014).
Figures