2426
Radiomics Applied to Phase Contrast MRI Images Successfully Distinguishes Healthy Subjects and Multiple Sclerosis Patients
Eros Montin1,2, Marco Muccio1, Yulin Ge1, and Riccardo Lattanzi1,2,3
1Center for Advanced Imaging Innovation and Research (CAI2R) Department of Radiology, Radiology Department, New York University Grossman School of Medicine, New York, New York, USA, New York, NY, United States, 2Bernard and Irene Schwartz Center for Biomedical Imaging, Department of Radiology, New York University Grossman School of Medicine, New York, New York, USA, New York, NY, United States, 3Vilcek Institute of Graduate Biomedical Sciences, New York University Grossman School of Medicine, New York, New York, USA, New York, NY, United States
1Center for Advanced Imaging Innovation and Research (CAI2R) Department of Radiology, Radiology Department, New York University Grossman School of Medicine, New York, New York, USA, New York, NY, United States, 2Bernard and Irene Schwartz Center for Biomedical Imaging, Department of Radiology, New York University Grossman School of Medicine, New York, New York, USA, New York, NY, United States, 3Vilcek Institute of Graduate Biomedical Sciences, New York University Grossman School of Medicine, New York, New York, USA, New York, NY, United States
Synopsis
Keywords: Radiomics, Multiple Sclerosis
In this study, we applied imaged-based radiomic techniques to phase contrast (PC) MRI images to distinguish the blood flow through the neck-feeding arteries of healthy controls (HC) from MS patients. By applying a simple machine learning model, k nearest neighbor, we found that first order features of the arteries’ regions of interest (ROI), drawn on phase images, reported the best accuracy (0.80) in labeling MS patients and HCs. PC-MRI is a fast and reliable imaging technique that, in conjunction with radiomics, offers great clinical potential to further quantify the diagnosis of MS, currently relying on qualitative approaches.Introduction
Multiple sclerosis (MS) is a common neurodegenerative disease that progressively becomes more debilitating due to chronic autoimmune demyelination and neurodegeneration [1,2]. Recently, MS has been characterized by the use of radiomics, a machine-learning approach consisting of the high-throughput extraction of quantitative features from images, and the subsequent mining of these features for disease prediction and characterization purposes [4]. Lavrova et al. [5] used radiomics to discriminate MS patients from healthy control (HC) using quantitative MRI (qMRI) [5]. The study was encouraging but the long acquisition time of qMRI makes this approach prone to artifacts resulting from intra-scan subject motion [6] that might decrease the radiomic analysis accuracy [6]. Phase contrast (PC) is a rapid MRI technique that has been used to investigate the vascular aspect of MS by quantifying the velocity of moving blood spins. However, it has not been used to aid the diagnosis of MS, In this abstract, a radiomic model was trained to discriminate MS patients from HCs using quantitative PC.Material and Methods
Nine patients with a diagnosis of MS (age=47.6±14.4 years) and 11 HCs (age=43.6±16.9 years) were scanned on a 3T MRI system (details in Figure 1). The PC imaging slice was positioned perpendicular to each individual neck artery, bilateral carotid arteries (ICAs), and bilateral vertebral arteries (VAs), to ensure flow quantification accuracy. A TOF angiogram was used to aid such slice positioning (Figure 1). The velocity encoding (VENC) parameter was 60 cm/s for arterial flow, which is in the range of what is commonly used (60–100 cm/s)[8,9]. The imaging output consisted of magnitude and phase mages, representing the vessel’s anatomical and hemodynamic properties respectively. For each subject and each individual artery, a ROI was drawn on the magnitude image. As reported in the workflow diagram in Figure 2, we applied data augmentation by rototranslating all images and ROIs by a factor of 10 for a total of 220 datasets.For each ROI of either carotid or vertebral arteries, we extracted 840 features: 105 for each image pair[4] . A complete list of all features are available in Table 1. For each feature class, the corresponding histogram was composed of 32 bins for both magnitude (min=0, max=32000) and phase (min=-32000, max=32000) images. The Texture features gray-level co-occurrence matrices (GLCM) [10] and gray-level run-length matrices (GLRLM) radius was set to to 1 and 2.
Two patients and two subjects (Figure 2) (44 augmented) were randomly selected among the 20 available and used for validation purposes, leaving a total of 176 augmented datasets for model training. We defined 37 subsets with a variable number of features, divided by type (Table 2) and type of artery and for each of them, we trained 100 times a K-nearest neighbor model (k=3). In each repetition, we randomly subdivided training and testing sets with a ratio of 75/25%. The inputs of each model were the values of the radiomic features in the subset, and the outputs were the labels MS or HC. The trained model with the highest prediction accuracy was selected as the final one for the particular subset of features and evaluated against the validation dataset to assess its performance in identifying the hip with impingement. To avoid biases in the feature values, for each training repetition the data were z-scored. The whole process resulted in one trained model for each of the 48 subsets of features. All these steps were repeated 20 times in order to get a more reliable analysis even with our limited dataset.
Results and Discussions
Our results show that the features extracted could successfully distinguish the blood flow measured in HCs from the one in MS patients, with an accuracy of over 79% only using the FOS Histogram features (Table 2). As reported in Figure 3 the histogram distributions of the PC grayscale values in MS and HC are statistically different p<0.01 (Table 1). Furthermore, radiomics analyses specifically highlighted the results from the phase images of the LICA to have the most features that significantly (p<0.05) distinguished HCs and MS patients. Specifically, HCs reported greater GLRLM Run Percentage compared to MS patients (Table 1) meaning that the signal intensity across the LICA’s ROI, and consequently the blood flow through it, is more homogeneous in HC compared to the MS population. Physiologically this could be explained by the fact that MS mainly affects the cerebrum which is predominantly supported by the blood supply from the internal carotid arteries (LICA, RICA).Conclusions
To the best of our knowledge, with this proof-of-concept study, our team is the first one to apply radiomics to quick and readily available images of the neck-arteries blood flow. Despite the limited number of cases in the preliminary work, our approach has a strong potential for clinical applications since the accuracy of our model was comparable to the ones reported in the literature[5], although we used fewer data and very fast imaging, allowing diagnostic support to other imaging techniques commonly used. Further studies should expand the sample size in order to strengthen the analyses and should also focus on the changes in radiomic feature behavior over a whole cardiac cycle.Acknowledgements
This work was performed under the rubric of the Center for Advanced Imaging Innovation and Research (CAI2R, www.cai2r.net), an NIBIB National Center for Biomedical Imaging and Bioengineering (NIH P41 EB017183).References
- Walton, C., King, R., Rechtman, L., Kaye, W., Leray, E., Marrie, R. A., Robertson, N., la Rocca, N., Uitdehaag, B., van der Mei, I., Wallin, M., Helme, A., Angood Napier, C., Rijke, N., & Baneke, P. (2020). Rising prevalence of multiple sclerosis worldwide: Insights from the Atlas of MS, third edition. Multiple Sclerosis Journal, 26(14), 1816–1821. https://doi.org/10.1177/1352458520970841
- Belov, P., Jakimovski, D., Krawiecki, J., Magnano, C., Hagemeier, J., Pelizzari, L., Weinstock-Guttman, B., & Zivadinov, R. (2018). Lower Arterial Cross-Sectional Area of Carotid and Vertebral Arteries and Higher Frequency of Secondary Neck Vessels Are Associated with Multiple Sclerosis. AJNR. American journal of neuroradiology, 39(1), 123–130. https://doi.org/10.3174/ajnr.A5469
- Lavrova E, Lommers E, Woodruff HC, Chatterjee A, Maquet P, Salmon E, Lambin P, Phillips C. Exploratory Radiomic Analysis of Conventional vs. Quantitative Brain MRI: Toward Automatic Diagnosis of Early Multiple Sclerosis. Front Neurosci. 2021 Aug 5;15:679941. doi: 10.3389/fnins.2021.679941. PMID: 34421515; PMCID: PMC8374240.
- Corino, V. D. A., Montin, E., Messina, A., Casali, P. G., Gronchi, A., Marchianò, A., & Mainardi, L. T. (2018). Radiomic analysis of soft tissue sarcomas can distinguish intermediate from high-grade lesions. Journal of Magnetic Resonance Imaging, 4(3), 829–840. https://doi.org/10.1002/jmri.25791
- Seiler, A., Nöth, U., Hok, P., Reiländer, A., Maiworm, M., Baudrexel, S., Meuth, S., Rosenow, F., Steinmetz, H., Wagner, M., Hattingen, E., Deichmann, R., & Gracien, R. M. (2021). Multiparametric Quantitative MRI in Neurological Diseases. In <i>Frontiers in Neurology</i> (Vol. 12). Frontiers Media S.A. https://doi.org/10.3389/fneur.2021.640239
- Pierpaoli, C. (2010). Quantitative brain MRI. In Topics in Magnetic Resonance Imaging (Vol. 21, Issue 2, p. 63). https://doi.org/10.1097/RMR.0b013e31821e56f8
- Laganà, M.M., Pelizzari, L. and Baglio, F., 2020. Relationship between MRI perfusion and clinical severity in multiple sclerosis. Neural Regeneration Research, 15(4), p.646.
- Debbich, A., Abdallah, A. ben, Maatouk, M., Hmida, B., Sigovan, M., Clarysse, P., & Bedoui, M. H. (n.d.). A Spatiotemporal exploration and 3D modeling of blood flow in healthy carotid artery bifurcation from two modalities: Ultrasound-Doppler and phase contrast MRI A Spa-tiotemporal exploration and 3D modeling of blood flow in healthy carotid artery bifurcation from two modalities: Ultrasound-Doppler and phase contrast MRI A Spatiotemporal exploration and 3D modeling of blood flow in healthy carotid artery bifurcation from two modalities: Ultrasound-Doppler and phase contrast MRI. https://doi.org/10.1016/j.compbiomed.2020.103644ï
- Rivera-Rivera, L.A., et al., 2021. Assessment of vascular stiffness in the internal carotid artery proximal to the carotid canal in Alzheimer's disease using pulse wave velocity from low rank reconstructed 4D flow MRI. J Cereb Blood Flow Metab. 41, 298-311.
- Haralick, R. M. (1979). Statistical and structural approaches to texture. Proceedings of the IEEE, 67(5), 786–804. https://doi.org/10.1109/PROC.1979.11328
- Law, M., Saindane, A.M., Ge, Y., Babb, J.S., Johnson, G., Mannon, L.J., Herbert, J. and Grossman, R.I., 2004. Microvascular abnormality in relapsing-remitting multiple sclerosis: perfusion MR imaging findings in normal-appearing white matter. Radiology, 231(3), pp.645-652.
- Sheng, H., Zhao, B. and Ge, Y., 2019. Blood perfusion and cellular microstructural changes associated with iron deposition in multiple sclerosis lesions. Frontiers in neurology, 10, p.747.
Figures
Top row: example of time-of-flight (TOF) image, used to place the PC-MRI imaging and the bilateral internal carotid arteries (left, LICA and right, RICA) and vertebral arteries (left, LVA and right, RVA). Bottom row: example of magnitude image PC-MRI sequence, used for ROI drawing (bottom right image). Blood flow measurements were acquired with PC-MRI sequence. (TR/TE/TA=25ms/8/10s, slice thickness = 5 mm, flip angle = 15◦, FoV =0.5x0.5x5mm
Schematic representation of the data workflow. Data is pre-processed and a total of 20 patients and subjects and 80 ROIS datasets are used. This data is subdivided in training and validation set 16/4..Training and validation dataset numerosity was augmented by a factor 10 using. We defined XX features subsets and for each of them, a KNN ML Learner was trained 100 times. This process was repeated 20 times changing the validation and testing dataset as well. The most accurate models were selected as the final model for that particular subset and evaluated on the validation dataset.
the list of the features used in this radiomics study along with the value in the population an the p-value of the rank-sum test
Reports the accuracy, specificity, sensitivity and AUC for all the 37 subsets of features. The complete list of features contained in each subsets can be seen in Table 1. In bold is reported the best subset, in red features subset arising from the LICA ROIs, green for LVA, yellow for RICA and blue for LVA.
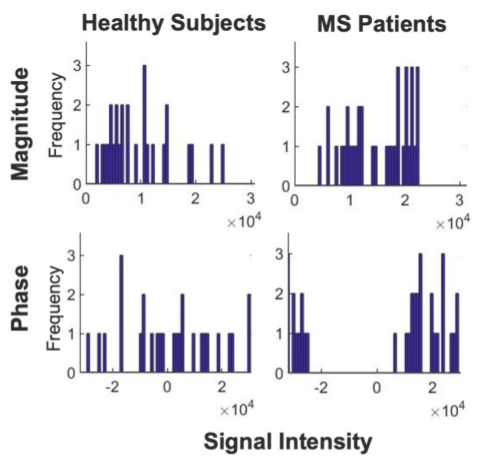
An example of the histogram distribution of the gray scale values of the PC-MRI images in the LICA region of interest. The histograms of the phase images of the MS Patients are more spread out in comparison to the respective ones from healthy controls. The trend was highlighted also by the FOS Histogram features (Table 1).
DOI: https://doi.org/10.58530/2023/2426