2423
Investigating Racial Disparities for the Performance of mpMRI in Diagnosis of Prostate Cancer1Department of Radiological Sciences, David Geffen School of Medicine at University of California, Los Angeles, Los Angeles, CA, United States, 2The First Affiliated Hospital of China Medical University, Shenyang City, China, 3Department of Radiology, University of Alabama at Birmingham, Birmingham, AL, United States, 4Department of Urology, David Geffen School of Medicine at University of California, Los Angeles, Los Angeles, CA, United States
Synopsis
Keywords: Data Analysis, Multimodal
Race and ethnicity strongly impact the risk of prostate cancer (PCa). In this study, the differences in the performance of mpMRI for PCa diagnosis are investigated between African American (AA) and Caucasian American (CA) men. After matching commonly known clinical risk factors, the diagnostic performances were compared between two racial groups regarding cancer prevalence, detection rates, and positive predictive values. Our result demonstrated that there are significant differences between AA and CA men in detecting clinically significant PCa when stratified by different prostate zones.Introduction
African American (AA) men have been shown to have a higher likelihood of PCa-related death than Caucasian American (CA) men. Although socioeconomic factors and healthcare access may account for the difference 1-4, genetic and biological factors may equally influence these discrepancies 5,6. As such, understanding the impact of biological heterogeneity in patients from different racial/ethnic backgrounds is crucial and might reduce racial disparities between AA and CA in clinical outcomes related to PCa diagnosis.In this study, we aimed to assess the performance of mpMRI for PCa diagnosis between AA and CA men after matching clinical variables, such as patient age, prostate-specific antigen (PSA), and prostate volume (PV). Radiology-pathology correlations were conducted to explore differences between two race groups by calculating cancer prevalence (CP), detection rate (DR), and positive predictive value (PPV) stratified by the prostate sector map, described by Prostate Imaging Reporting and Data System (PI-RADS) v2.1 7. Then, the differences in the imaging characteristics from each mpMRI component were explored for the pathology- and MRI-based lesions between AA and CA men.
Method
This single institutional retrospective HIPAA-compliant study was approved by our institutional review board (IRB). We had an initial study cohort of 885 consecutive patients who underwent mpMRI prior to prostatectomy from July 2010 to December 2020. Cases with one or more of the following criteria were excluded from the study: 1) unknown/missing race information; 2) prior treatment for PCa; 3) missing mpMRI; 4) missing preoperative serum prostate-specific antigen (PSA) measurement. The mpMRI was performed on one of the 3T scanners using standardized protocols, where all preoperative mpMRIs were interpreted by an abdominal imaging fellow and then reviewed by one of three board-certified attending abdominal radiologists with 5-20 years of experience.PI-RADS v2.1 guidelines were used to interpret all mpMRI scans. To minimize the bias, the propensity score caliper matching algorithm was applied to match AA to CA men in a 1:2 ratio with the covariates, including patient age, PSA, and prostate volume, which are known to be associated with the risk factors for PCa diagnosis 8,9. An MRI-positive and pathology-positive lesion was labeled as true positive (TP). An MRI-positive but pathology-negative lesion was labeled as false positive (FP), while an MRI-negative but pathology-positive lesion was labeled as false negative (FN). Each lesion (TP, FP, and FN) was stratified by the standardized prostate segmentation model, the sector map described by PI-RADS v2.1, and normalized by the total number of sectors when a lesion occupies more than one sector. The per-lesion diagnostic performance of mpMRI was characterized by calculating cancer prevalence, detection rates (DR=TP/(TP+FN), and positive predictive values PPV=TP/(TP+FP)) between matched CA and AA men.
The DCE-MRI was implemented with an ultrafast 3D spoiled gradient-echo sequence without fat saturation. The standard Tofts model with a population-averaged AIF was used to estimate Ktrans (volume transfer constant: wash-in rate) and kep (blood influx rate: wash-out rate) using DCE-MRI 10-11. Ktrans, kep, and apparent diffusion coefficient (ADC) maps were used to characterize differences between matched AA and CA men for the pathology- and MRI-based lesions. The Mann-Whitney U test and weighted Pearson’s chi-square test were used to analyze continuous and categorical variables, respectively.
Results
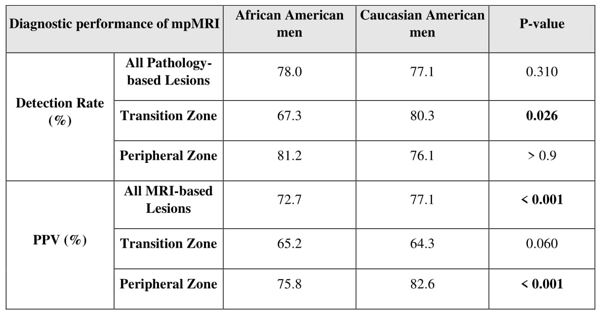
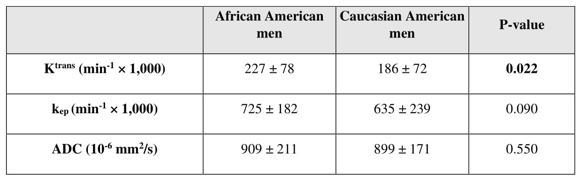
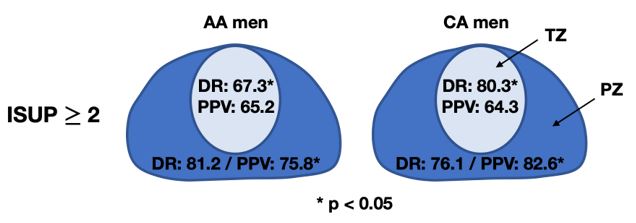
A total of 174 lesions were identified in the study cohort (63/111 for CA/AA men). Table 1 summarizes the mpMRI performance for clinically significant PCa (csPCa) lesions for AA and CA sub-cohort. As seen, while there is not a significant difference in the DR between AA and CA sub-cohorts in PZ (81.2% vs. 76.1%; p>0.9), the DR of AA men is significantly lower than that in CA men in TZ (67.3% vs. 80.3%; p=0.026) (Figure 1). The PPV was similar for both groups in TZ (65.2% vs. 64.3%; p=0.060 (AA vs CA)), but significantly higher for csPCa in AA sub-cohort in PZ (82.6% vs 75.8%; p<0.001 (AA vs CA)).Notable differences in Ktrans of csPCa tumors were observed between the two cohorts (0.23±0.08 min-1 vs. 0.19±0.07 min-1 for AA and CA men, respectively; p=0.022). Additionally, the tumors of AA men had significantly higher Ktrans than the CA sub-cohort when the PI-RADS score was ≥ 3 (p=0.013). However, the kep and ADC were not significantly different between the two racial groups (Table 2).
Conclusion and Discussion
The differences in the diagnostic performance of 3T mpMRI for detecting csPCa in different zones of the prostate in AA and CA sub-cohorts were investigated after matching patient age, PSA, and prostate volume between the two groups. There were significant differences in detecting csPCa between AA and CA men in TZ with a significant difference between AA and CA cohorts in the Ktrans of csPCa. Validation of these race-specific mpMRI differences in perspective, socioeconomically matched cohorts may improve diagnosis and potentially reduce racial disparities between AA and CA men in detecting csPCa.Acknowledgements
This work was supported in part by the National Institutes of Health R01-CA248506 and funds from the Integrated Diagnostics Program, Departments of Radiological Sciences and Pathology, David Geffen School of Medicine, UCLA.References
[1] Riviere P, Luterstein E, Kumar A, et al. Survival of African American and non-Hispanic white men with prostate cancer in an equal-access health care system. Cancer 2020;126:1683-1690. doi: 10.1002/cncr.32666
[2] Borno H, George DJ, Schnipper LE, Cavalli F, Cerny T, Gillessen S. All Men Are Created Equal: Addressing Disparities in Prostate Cancer Care. Am Soc Clin Oncol Educ Book 2019;39:302-308. doi: 10.1200/edbk_238879
[3] Friedlander DF, Trinh QD, Krasnova A, et al. Racial Disparity in Delivering Definitive Therapy for Intermediate/High-risk Localized Prostate Cancer: The Impact of Facility Features and Socioeconomic Characteristics. Eur Urol 2018;73:445-451. doi: 10.1016/j.eururo.2017.07.023
[4] Ziehr DR, Mahal BA, Aizer AA, et al. Income inequality and treatment of African American men with high-risk prostate cancer. Urol Oncol 2015;33:18.e17-18.e13. doi: 10.1016/j.urolonc.2014.09.005
[5] Bhardwaj A, Srivastava SK, Khan MA, et al. Racial disparities in prostate cancer: a molecular perspective. Front Biosci (Landmark Ed) 2017;22:772-782. doi: 10.2741/4515
[6] Wallace TA, Prueitt RL, Yi M, et al. Tumor immunobiological differences in prostate cancer between African-American and European-American men. Cancer Res 2008;68:927-936. doi: 10.1158/0008-5472.Can-07-2608
[7] American College of Radiology. PI-RADSTM Prostate Imaging- Reporting and Data System. ACR; 2019 https://www.acr.org/-/media/ACR/Files/RADS/Pi-RADS/PIRADS-V2-1.pdf.
[8] Smith ZL, Eggener SE, Murphy AB. African-American Prostate Cancer Disparities. Curr Urol Rep 2017;18:81. doi: 10.1007/s11934-017-0724-5
[9] Abdalla I, Ray P, Ray V, Vaida F, Vijayakumar S. Comparison of serum prostate-specific antigen levels and PSA density in African-American, White, and Hispanic men without prostate cancer. Urology 1998;51:300-305. doi: Doi 10.1016/S0090-4295(97)00617-1
[10] Parker GJ, Roberts C, Macdonald A, et al. Experimentally-derived functional form for a population-averaged high-temporal-resolution arterial input function for dynamic contrast-enhanced MRI. Magn Reson Med 2006;56:993-1000. doi: 10.1002/mrm.21066
[11] Tofts PS, Brix G, Buckley DL, et al. Estimating kinetic parameters from dynamic contrast-enhanced T(1)-weighted MRI of a diffusable tracer: standardized quantities and symbols. J Magn Reson Imaging 1999;10:223-232. doi: 10.1002/(sici)1522-2586(199909)10:3<223::aid-jmri2>3.0.co;2-s
Figures