2422
Magnetic resonance imaging radiomics to differentiate ovarian sex cord-stromal tumors and primary epithelial ovarian cancers1Department of Radiology, The Third Affiliated Hospital of Zhengzhou University, Zhengzhou, China, 2Department of Information, The Third Affiliated Hospital of Zhengzhou University, Zhengzhou, China, 3Wuhan University, Wuhan, China, 4MR Research China, GE Healthcare, Beijing, China, 5Huiying Medical Technology, Beijing, China
Synopsis
Keywords: Machine Learning/Artificial Intelligence, Urogenital
Ovarian sex cord-stromal tumors (SCSTs) are rare nonepithelial neoplasms that usually are benign or at early stages, but sometimes they are confused with malignant tumors such as epithelial ovarian cancers (EOCs). We constructed five models including clinical model, conventional MR model, traditional model, radiomics model and mixed model based on logistic regression classifier to distinguish SCSTs and EOCs. The performance of each model was evaluated. The radiomics approach showed excellent prediction results, and the mixed model stood out among all the models.Background
Morphologically, ovarian sex cord-stromal tumors (SCSTs) usually present as solid masses, resembling malignant tumors such as epithelial ovarian cancers (EOCs). But clinically, SCSTs most commonly occur at early stages (I) and are primarily surgically treated with an overall favorable prognosis, while EOCs usually occur at advanced stages (III or IV) and are treated with chemotherapy and surgical debulking. Magnetic resonance imaging (MRI) has been widely used to detect and evaluate adnexal lesions, with all the evaluation requiring the subjective interpretation of radiologists1. Radiomics is a powerful tool for postprocessing of medical images and generating new quantification metrics which can provide insights into tumor biology and shift radiology from the traditional visual analyses to a more objective and automated analyses2. Our purpose was to evaluate the diagnostic ability of MRI based radiomics and traditional characteristics to differentiate between SCSTs and EOCs.Methods
We consecutively recruited a total of 148 patients with 173 tumors (81 SCSTs in 73 patients and 92 EOCs in 75 patients) as the primary cohort. Then the primary dataset was randomly split into the training and validation dataset with a fixed ratio of 8:2 in each category. MR examinations were performed on the 3.0 T system (SIGNA Pioneer, GE Healthcare, and Skyra, Siemens Healthcare). The conventional MR sequences included T1 weighted imaging (T1WI), T2 weighted imaging (T2WI), fat-suppressed T2WI (FS-T2WI), diffusion-weighted imaging (DWI) with the b value of 1000 s/mm2, and multiphase contrast-enhanced fat-suppressed T1WI. Clinical characteristics such as patient age, menstrual status, endocrine level, cancer antigen 125 (CA125), and risk of ovarian malignancy algorithm (ROMA), were obtained. The volume of interest (VOI) for each lesion on each slice was manually delineated on FS-T2WI. The extraction of radiomics features was conducted in the Radcloud software (Huiying Medical Technology Co., Ltd, Beijing, China). Select K Best and the Lassolars algorithm were used to select the optimal parameters. Based on the selected radiomics features, clinical features, and conventional MR parameters, five prediction models (clinical model, conventional MR model, traditional model, radiomics model and mixed model) were constructed using the logistic regression (LR) classifier. The performance of each model was evaluated by the receiver operating characteristic (ROC) curve and decision curve analysis (DCA). The performance of different models was compared by DeLong test.Results
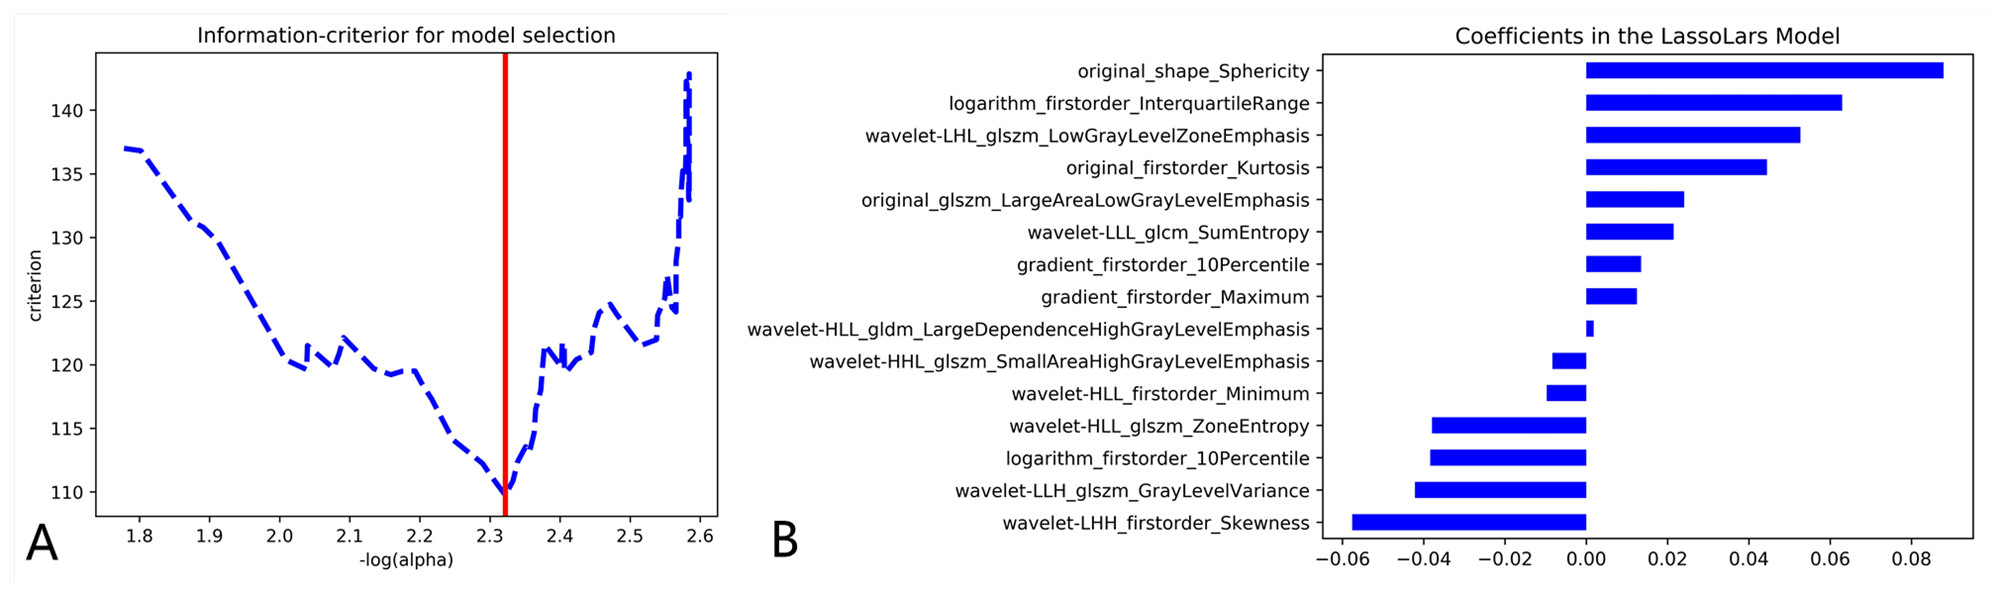
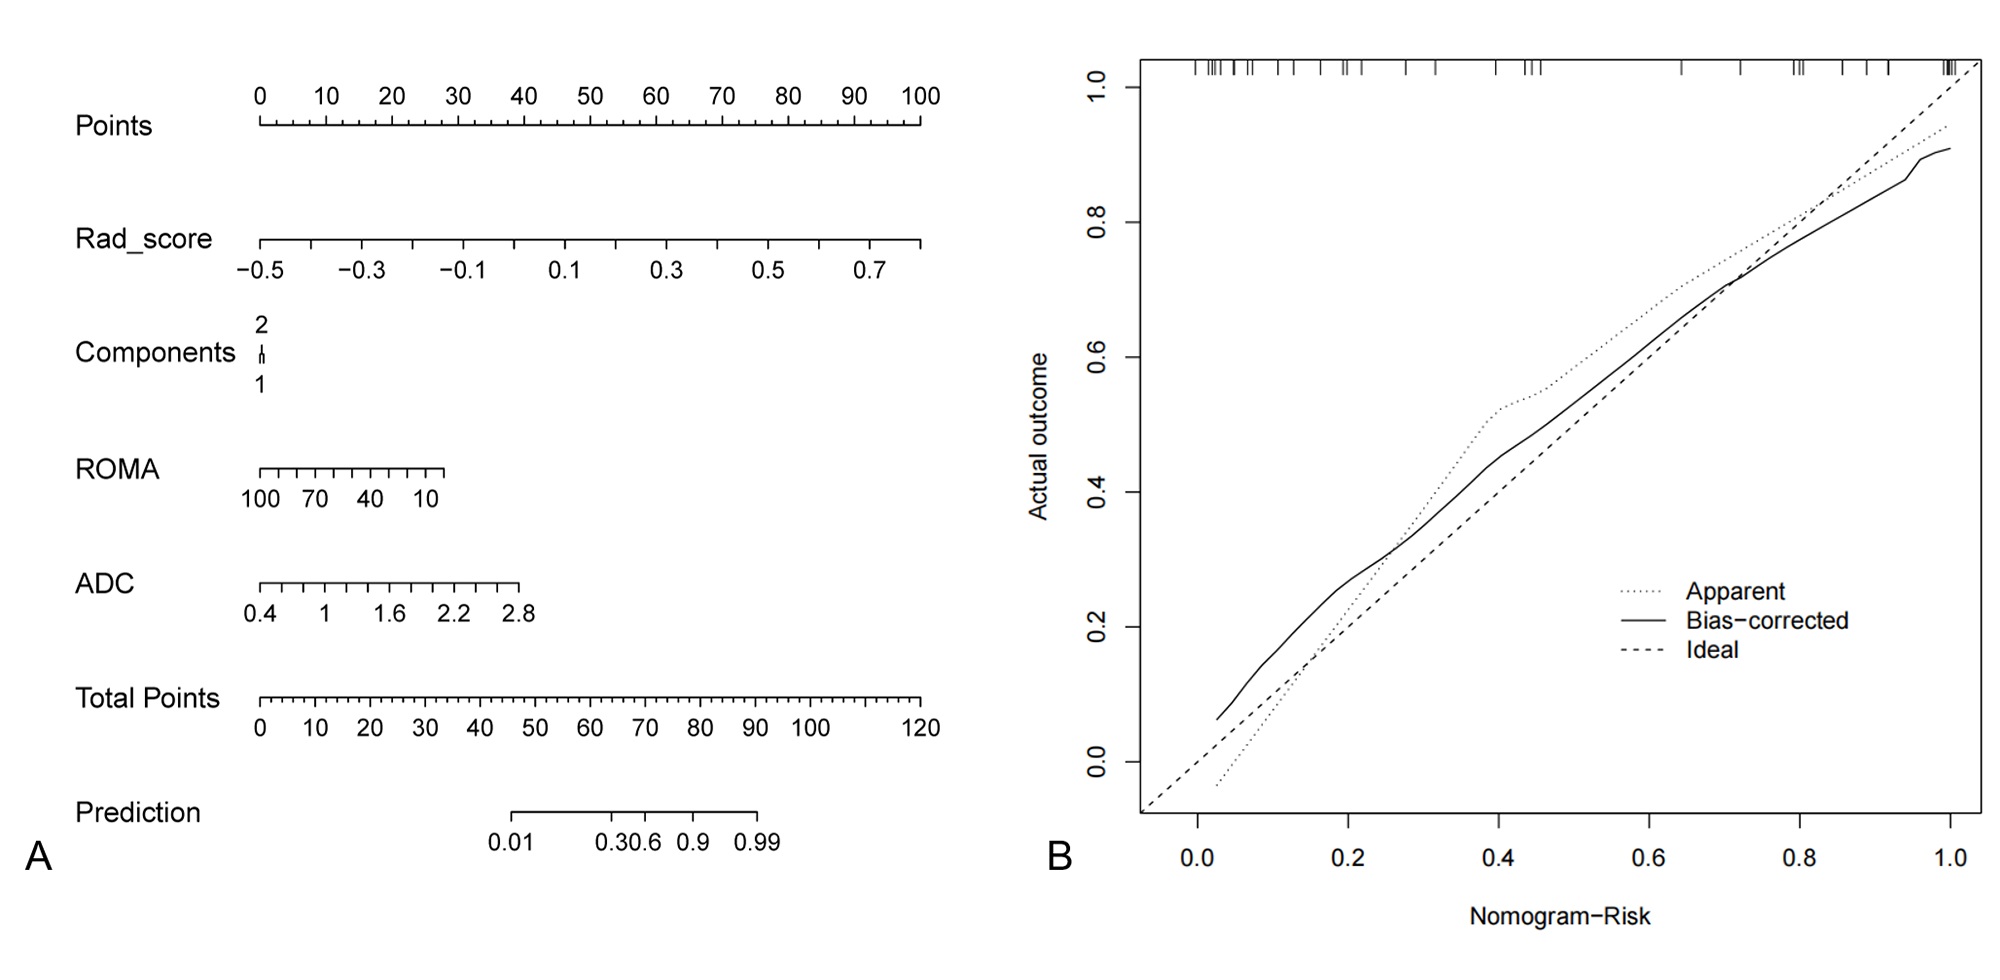
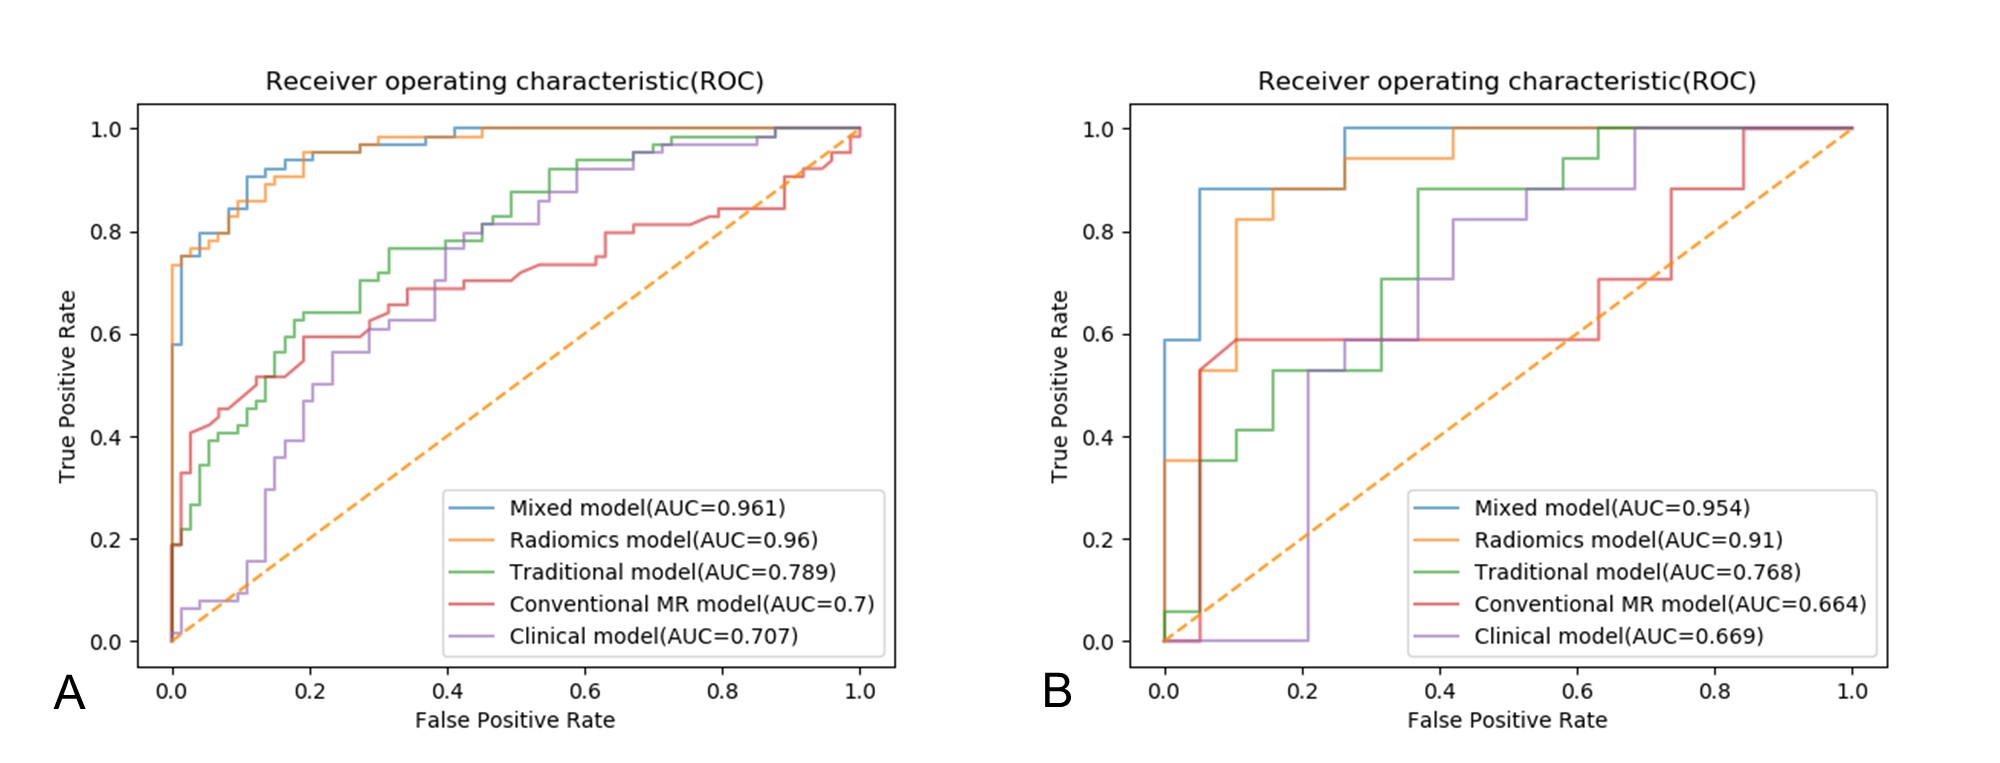
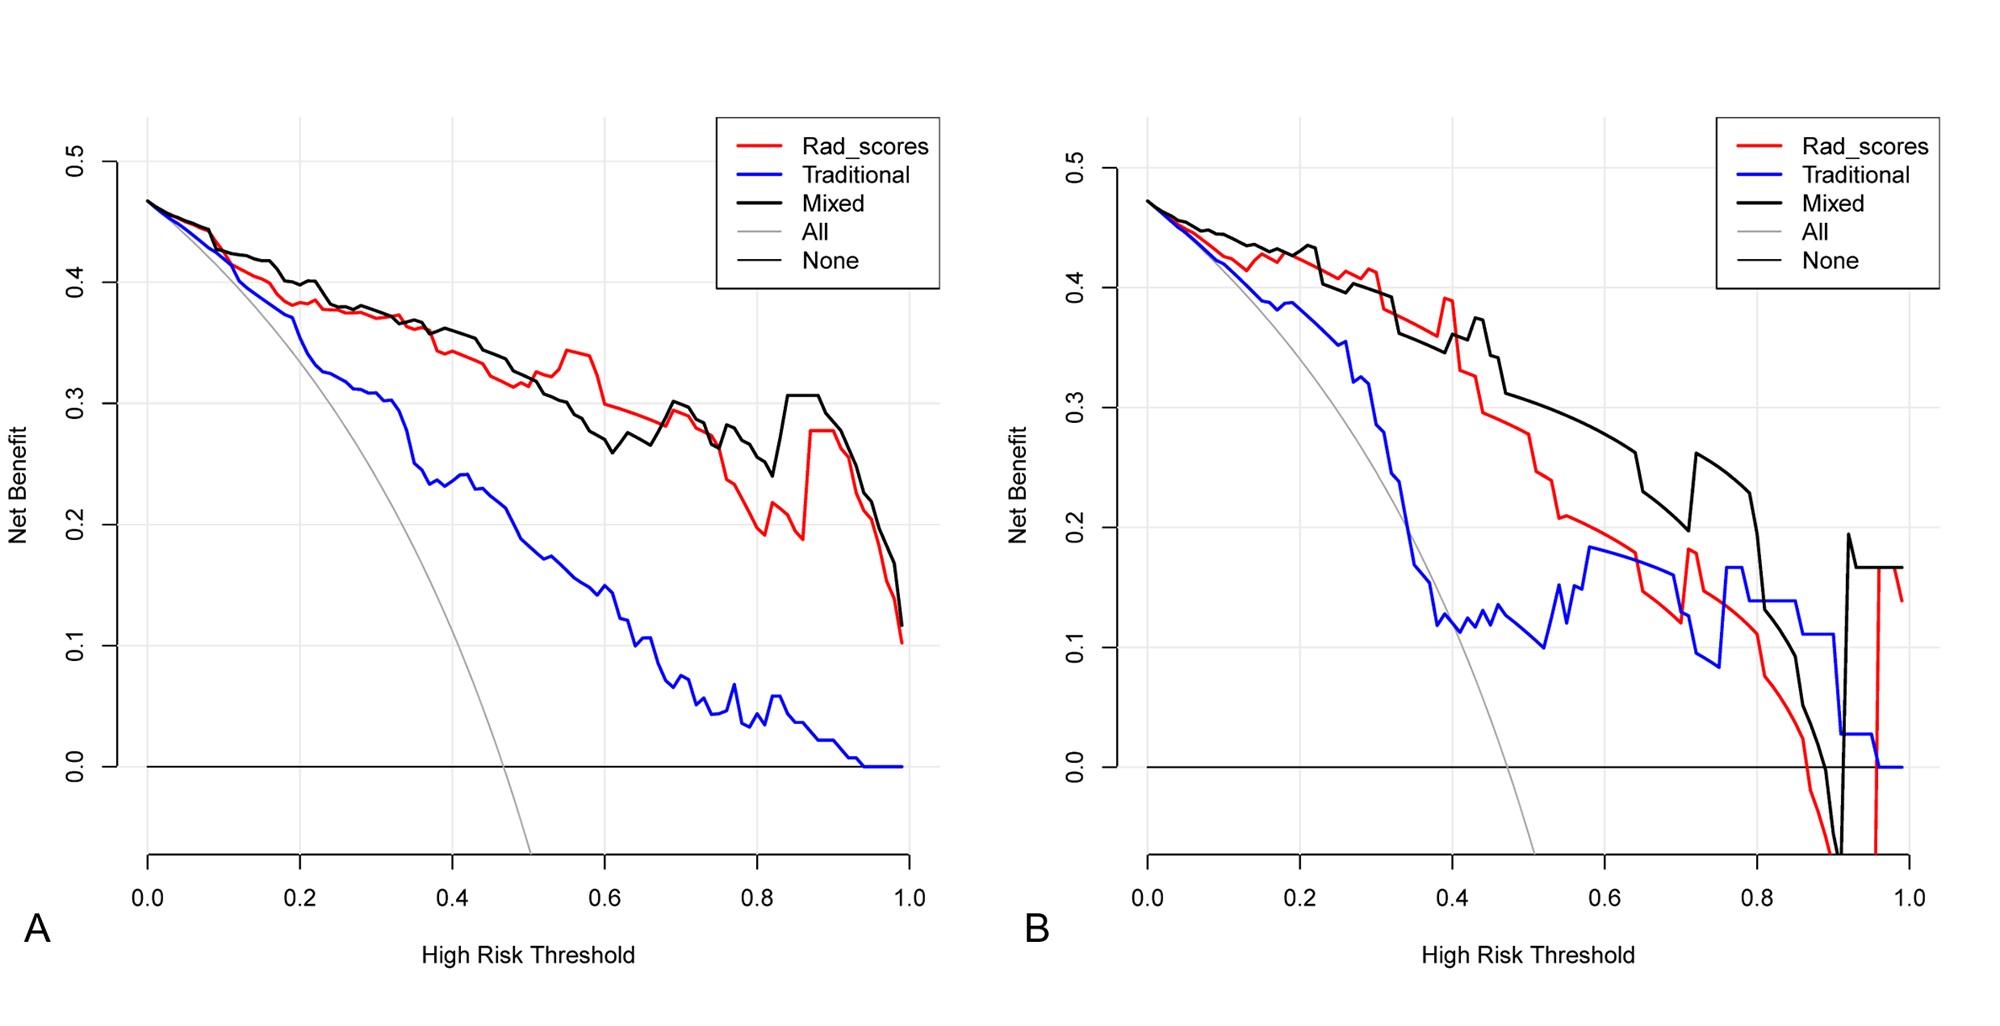
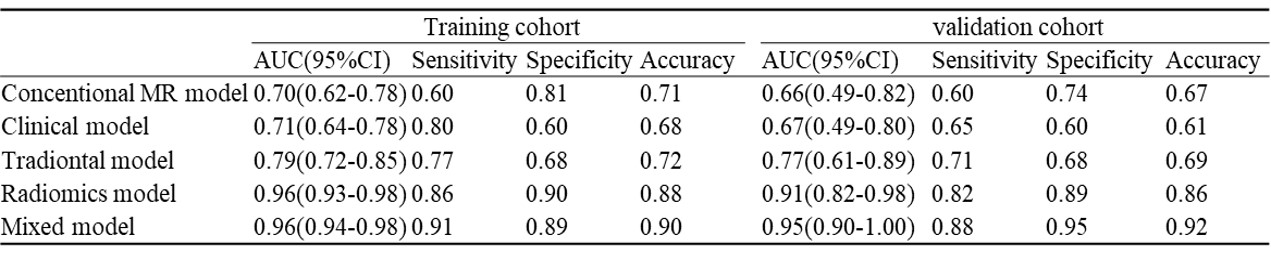
Among all the clinical data and MR parameters, ROMA index (P < 0.001), ADC value (P = 0.004), solid and cystic components (P = 0.043) were independent predictors on the multivariate logistic regression analysis. And a total of 15 features were finally selected to construct the radiomics signature (Figure 1). Based on the selected clinical variable ROMA index, a clinical model was established. Based on parameter ADC, solid and cystic components, a conventional MR model was established. Then, based on the combination of the above clinical factors and conventional MR parameters, a traditional model was established. Based on the selected radiomics features above, the radiomics model of FS-T2WI was established. Finally, we established a mixed model based on the Rad-score, clinical characteristics (ROMA), and conventional MR parameters (ADC, solid and cystic components). Then a radiomics nomogram was constructed by using the selected variables from multivariate logistic regression and Rad-score to provide a visualized outcome measure (Figure 2a). The calibration curves demonstrated good diagnostic consistency between the predictions of the radiomics nomogram and the actual observations of the samples (Figure 2b). The AUCs of the five models were displayed in Table 1 and Figure 3. The AUCs of the clinical model, conventional MR model, traditional model, radiomics model and mixed model were 0.669, 0.664, 0.768, 0.910, and 0.954 in the validation cohort, respectively. The DeLong test showed that the mixed model performed significantly better than the clinical model (P = 0.002), conventional MR model (P = 0.004), and traditional model (P = 0.02), but its performance was not statistically different from that of the radiomics model (P = 0.175). DCA revealed that the radiomics model and the mixed model provided a better net benefit than the traditional model across the majority of the range of reasonable threshold probabilities (Figure 4).Discussion and Conclusion
In our study, the radiomics approach achieved significantly better prediction efficiency than the traditional parameters, which was consistent with prior reports on radiomics3-5. However, SCSTs have been rarely discussed, this study was the first one to establish an MR-based radiomics model focusing on the differentiation of SCSTs from others. We believe that the radiomics approach could be a more objective and accurate way to distinguish between SCSTs and EOCs, and the mixed model in our study could provide a comprehensive, effective method for clinicians to develop an appropriate management strategy.Acknowledgements
We thank all the study participants.References
1. Sadowski EA, Thomassin-Naggara I, Rockall A, et al. O-RADS MRI Risk Stratification System: Guide for Assessing Adnexal Lesions from the ACR O-RADS Committee. Radiology. 2022; 303(1):35-47.
2. Nougaret S, McCague C, Tibermacine H, et al. Radiomics and radiogenomics in ovarian cancer: a literature review. Abdom Radiol (NY). 2021; 46(6):2308-22.
3. Zhang H, Mao Y, Chen X, et al. Magnetic resonance imaging radiomics in categorizing ovarian masses and predicting clinical outcome: a preliminary study. Eur Radiol. 2019; 29(7):3358-71.
4. Song XL, Ren JL, Zhao D, et al. Radiomics derived from dynamic contrast-enhanced MRI pharmacokinetic protocol features: the value of precision diagnosis ovarian neoplasms. Eur Radio.l 2021; 31(1):368-78.
5. Jian J, Li Y, Pickhardt PJ, et al. MR image-based radiomics to differentiate type Iota and type IotaIota epithelial ovarian cancers. Eur Radiol. 2021; 31(1):403-10.
Figures